Water, solid–water interfaces, and “interfacial water”
Water, the most abundant substance on Earth, has unusual properties. As a solid, water ice most commonly takes a hexagonal structure with a lateral lattice spacing of 4.52 Å, an interlayer spacing of 3.64 Å, and an oxygen–oxygen distance of 2.75 Å.Reference Lonsdale1 Under ambient conditions, water retains a disordered tetrahedral network (Figure 1) that is stabilized by hydrogen bonds (with an energy of ∼21 kJ/mol, 0.22 eV, or ∼9 k BT per bond).Reference Franks2,Reference Symons3 This interaction is largely responsible for the properties of liquid water, including the average O–O distance of 2.8 Å and its relatively high liquid density (1 g/cm3 at 4°C, with a corresponding number density of ρw = 1 H2O/30.3 Å3). The distance over which water retains a memory of perturbations (i.e., its correlation length) is ∼4 Å.Reference Xie, Ludwig, Morales, Hare and Sorensen4 Water also is a “universal solvent” and is a necessary ingredient for all living things. Because water is a polar molecule, it solvates charged species through its strong dipolar interaction, and the hydration energies of ions can be estimated based on the ion’s charge and effective size. This tendency of water to form “solvation shells” around ions is a key control over the nature and rates of chemical reactions in aqueous solutions.Reference Richens5
Schematic illustration of the transition from tetrahedrally ordered bulk water (with a number density of 33 H2O/nm3) to interfacial water ordered near the solid–water interface (with an areal density of ∼10 H2O/nm2).

A primary characteristic of any solid surface is that atoms at the surface are generally undercoordinated with respect to those in the bulk.Reference Zangwill6 The greater availability of atoms at the interface for reaction (i.e., without the need for solid-state diffusion of reactants) makes interfaces more chemically reactive than solid materials. Most interfaces that are stable in ambient environments are in the form of oxides, minerals, organics, or other materials having a relatively low surface energy. They consist of functional groups whose properties are controlled by the interaction of the undercoordinated surface lattice atoms with water and dissolved species. A common example is the acid-base chemistry found at oxide surfaces, leading to a pH-dependent surface charge as a result of its equilibration with water leading to a mixture of −OH2+, −OH, and −O– surface functional groups versus pH.Reference Stumm7
From these simple considerations, one can anticipate many of the properties of water in the vicinity of an interface (i.e., “interfacial water,” Figure 1) that are analogous to the hydration layers formed around dissolved ions. The structure of interfacial water is typically distinct from bulk water. The interaction of water with the surface functional groups (e.g., through hydrogen bonds to oxide surfaces) stabilizes the interfacial hydration structure (e.g., with a specific orientation of the water dipole moment) with respect to the hydrogen-bonding structure that occurs in bulk water. This interfacial hydration structure is also controlled by a balance between the lateral arrangement of the surface functional groups exposed at the solid surface with the natural lateral spacing of a dense water layer (i.e., its “epitaxy”). This can be characterized by comparing the size of the solid surface unit cell with the natural two-dimensional (2D) packing density of water, ρ2D, estimated through the dimensional relation ρ2D = ρw2/3 ≈ 1 H2O/10 Å2. Finally, the vertical organization of any hydration layer can be expected to be limited in extent to a few water correlation lengths,Reference Xie, Ludwig, Morales, Hare and Sorensen4 corresponding to distances of ∼1–2 nm from the surface.
Observing the solid–water interface structure with x-rays
Relatively few methods are available by which solid–water interfaces can be understood through direct observation. This is because most “surface science” probes use electrons or ions that are unable to penetrate through the liquid phase. Of the possible surface- and interface-sensitive tools, only scanning probe microscopiesReference Gratz and Bird8 and photon- or neutron-based probesReference Robinson and Tweet9–Reference Ostroverkhov, Waychunas and Shen14 can interrogate the solid–liquid interfaces directly through in situ observations. Of these, x-ray based tools have the capability to probe the interfacial hydration structure with Ångström-scale resolution.
Scattering of x-rays from well-defined interfaces (Figure 2), referred to generally as x-ray reflectivity (XR), including both specular and nonspecular scattering, provides what is arguably the most direct and quantitative method for probing the structure (i.e., atom locations) of the solid–water interface. XR of interfaces is the direct analogue of x-ray crystallography and has been applied to understand a wide range of solid–water interfaces.Reference Wang, Ocko, Davenport and Isaacs15–Reference Zhou, Ganesh, Presser, Wander, Fenter, Kent, Jiang, Chialvo, McDonough, Shuford and Gogotsi29 The precise time-averaged locations of atoms at the solid–liquid interface within both the solid and water phases can be observed through direct in situ measurements of the intensity and distribution of the scattered x-rays.
Schematic of the x-ray reflectivity measurement, with the x-ray beam reflecting from the surface with a total scattering angle of 2θ. For specular reflectivity measurements, the momentum transfer, Qz, is oriented along the surface normal direction and reveals the laterally averaged electron density, ρ(z).

The power of XR to probe the solid–liquid interface derives from the simple and robust relationship between the scattering intensity, expressed as the fraction of the incident beam that is reflected, R(Q), and the unknown structure, ρ(r), expressed as the electron density of the interface as a function of position, r, with respect to the origin at the interface. For the case of specular (i.e., mirror-like scattering, |Q| = Qz):
 $$R{\rm{(}}{{\rm{Q}}_{\rm{z}}}{\rm{)\ = \ (4\pi }}{r_{\rm{e}}}{\rm{/}}{A_{{\rm{uc}}}}{{\rm{Q}}_{\rm{z}}}{{\rm{)}}^{\rm{2}}}{\rm{\ |}}\int {\rm{\rho }} {\rm{(z)\ exp(i}}{{\rm{Q}}_{\rm{z}}}{\rm{z)\ dz}}{{\rm{|}}^{\rm{2}}} ,$$
where |Q| = (4π/λ)sin(2θ/2) is the momentum transfer, λ is the x-ray wavelength, 2θ is the total scattering angle, A uc is the surface unit cell area, r e = 2.828 × 10⁻⁵ Å is the classical electron radius, and z is the height above the interface. As in any crystallographic approach, the ability to know the structure is limited primarily by the crystallographic “phase problem” (that is, while the reflectivity signal can be calculated directly from the electron density, as shown in Equation 1, it is not generally possible to obtain the electron density directly from the measured reflectivity signal).Reference Robinson and Tweet9 Most commonly, the data can be understood by quantitative comparison to calculated intensities based on parameterized models of the interfacial structure. The models must include all relevant aspects of the interfacial structure, including intrinsic factors (i.e., the interfacial water organization), changes to the substrate interfacial structure (including the surface termination, substrate structural relaxations allowed by the broken symmetry associated with the presence of the surface, and reconstructions due to spontaneous symmetry changes), the presence of any adsorbed layers (e.g., ions at charged surfaces), as well as any extrinsic factors such as surface roughness. The field of view of these measurements is defined within the surface plane by the surface lattice spacings, a and b, and is sensitive to the complete density profile along the surface normal direction for heights in the range of –∞ < z < ∞ (including the continuous water profile above the surface, and any changes to the substrate crystal below the interface).
Hydration layers at the solid–water interface
The behavior of water adjacent to various solid surfacesReference Fenter and Sturchio30 has been well-studied using x-ray scattering approaches, including metal–aqueous electrochemistry,Reference Wang, Ocko, Davenport and Isaacs15,Reference Toney, Howard, Richer, Borges, Gordon, Melroy, Wiesler, Yee and Sorensen16 crystal growth,Reference Reedijk, Arsic, Hollander, de Vries and Vlieg17 biomineralization,Reference Arsic, Kaminski, Poodt and Vlieg18 metal oxides,Reference Eng, Trainor, Brown, Waychunas, Newville, Sutton and Rivers19–Reference Zhang, Fenter, Sturchio, Bedzyk, Machesky and Wesolowski22 natural minerals,Reference Cheng, Fenter, Nagy, Schlegel and Sturchio23–Reference Fenter and Sturchio25 and hydrophobic interfaces.Reference Mezger, Schöder, Reichert, Schröder, Okasinski, Honkimäki, Ralston, Bilgram, Roth and Dosch26–Reference Zhou, Ganesh, Presser, Wander, Fenter, Kent, Jiang, Chialvo, McDonough, Shuford and Gogotsi29
In this article, we present a few representative examples that provide insights into the range of interfacial hydration structure profiles that can be observed for surfaces with distinct chemical properties and functionalities (Figure 3). These include the (001) plane of muscovite mica, K2Al4(Al2Si6)O20(OH)4, a planar surface that has a fixed charge;Reference Cheng, Fenter, Nagy, Schlegel and Sturchio23 the (001) plane of graphene, a 2D carbon structure that is uncharged and chemically inert;Reference Zhou, Ganesh, Presser, Wander, Fenter, Kent, Jiang, Chialvo, McDonough, Shuford and Gogotsi29 the (110) plane of rutile TiO2, an oxide surface with chemically reactive surface functional groups and a pH-dependent surface charge;Reference Zhang, Fenter, Cheng, Sturchio, Bedzyk, Predota, Bandura, Kubicki, Lvov, Cummings, Chialvo, Ridley, Benezeth, Anovitz, Palmer, Machesky and Wesolowski21,Reference Zhang, Fenter, Sturchio, Bedzyk, Machesky and Wesolowski22 and the (104) plane of calcite, CaCO3, the major cleavage plane of this ionic crystal.Reference Fenter, Kerisit, Raiteri and Gale24,Reference Fenter and Sturchio25,Reference Geissbühler, Fenter, DiMasi, Srajer, Sorensen and Sturchio31
Structural schematics and measured hydration structures observed at the solid–water interface for (a) muscovite mica (001),Reference Cheng, Fenter, Nagy, Schlegel and Sturchio23 (b) epitaxial graphene (001) (for both the G0 and Gn layers (n = 1, 2, 3, …) (the inset shows water contact angles for [top] G0- and [bottom] Gn-dominant surfaces),Reference Zhou, Ganesh, Presser, Wander, Fenter, Kent, Jiang, Chialvo, McDonough, Shuford and Gogotsi29 (c) calcite CaCO3(104),Reference Fenter, Kerisit, Raiteri and Gale24 and (d) rutile TiO2(110).Reference Zhang, Fenter, Sturchio, Bedzyk, Machesky and Wesolowski22 In all cases, the height origin is chosen as the average location of the surface functional groups.

The muscovite–water interface
The basal surface of muscovite is representative of the dominant surfaces of many layer-silicate minerals (e.g., micas and clay minerals) in nature. This system is the first for which a distinct interfacial hydration structure was inferred on the basis of oscillatory force–distance curves observed by the surface forces apparatus for water confined between two cylindrically bent muscovite sheets.Reference Israelachvili and Pashley32,Reference Pashley and Israelachvili33 The muscovite basal surface is formed by cleaving layers that are held together by electrostatic attraction and therefore does not require the breaking of covalent bonds. Consequently, all surface lattice cations remain fully coordinated at the free surface (Figure 3a). This property leads to a relatively weak chemical interaction of water with the surface. The water–muscovite interaction is controlled by the large fixed surface charge (1 e– per surface unit cell area A uc, where A uc = 46.72 Å2 for muscovite, which corresponds to a charge of –0.34 C/m2). In electrolyte solutions, this surface charge is compensated by the formation of an electrical double layer of cations through a combination of specific adsorption and the formation of a diffuse ion cloud (see discussion below).
The muscovite surface exhibits a fairly complex interfacial hydration structure,Reference Cheng, Fenter, Nagy, Schlegel and Sturchio23 consisting of two distinct water layers whose heights (at 1.3 Å and 2.5 Å) are understood by the adsorption of water in (or near) a “ditrigonal cavity” (a structural depression within a distorted hexagonal ring formed by six corner-sharing SiO4 tetrahedra) and adsorption of water to the surface oxygens in the basal plane (at height z = 0). The 2D water densities for these two layers are 4.3 H2O/nm2 and 5.6 H2O/nm2, respectively, with a combined surface hydration layer density of ∼10 H2O/nm2. This is fully consistent with the expectation that interfacial hydration layers should have a 2D density of ∼10 H2O/nm2. This primary hydration layer is followed by a weakly modulated hydration structure that extends >1 nm above the surface with a layer spacing of 3.7 ± 0.3 Å. This observation of water layering at an isolated muscovite surface provides a first-order explanation for the oscillatory force–distance profiles observed by the surface forces apparatus.Reference Israelachvili and Pashley32,Reference Pashley and Israelachvili33 The observed oscillatory force curves can be interpreted as due to the perturbation of the intrinsic hydration layer structure that is found at each interface as they are forced to interact under confinement between the two surfaces.
The graphene–water interface
The graphene–water interface is perhaps one of the simplest solid–water interfacial systems when viewed from a chemical perspective. The basal surface of graphene carries no charge and is intrinsically hydrophobic (Figure 3b).Reference Shin, Wang, Huang, Kalon, Wee, Shen, Bhatia and Yang34 The interfacial water structure at epitaxial graphene (EG) surfaces (grown by thermal decomposition of silicon carbide (001) surface; Figure 3b) for multilayer graphene, Gn (where n ≥ 1) exhibit a primary hydration layer at a height of ∼3.1 Å above the graphene surface, followed by a secondary hydration layer at a height of ∼6 Å, and a nearly featureless water profile corresponding to the bulk water phase.Reference Zhou, Ganesh, Presser, Wander, Fenter, Kent, Jiang, Chialvo, McDonough, Shuford and Gogotsi29 The primary hydration layer height is even greater than that for water above the muscovite basal plane (2.5 Å) and apparently reflects the strongly hydrophobic character of the surface. The primary hydration layer is found to have a water density of 16 H2O/nm2, which is substantially larger than expected based on the simple estimates. EG typically forms with a distribution of graphene layer thickness (typically two or three layers thick). Although the thickness distribution can be characterized by ex situ studies prior to the studies of water structure, it is possible that the water coverage might be overestimated because of the similar values of the water adsorption height (∼3.2 Å) and the graphene–graphene spacing (∼3.4 Å).
Epitaxial graphene provides a well-defined system for understanding the relationship between hydrophobicity and interfacial water structure. The wettability of EG surfaces can be controlled by the degree of graphenization. Films with two or more graphene layers (e.g., Gn) exhibit the expected hydrophobic behavior with contact angles of ∼93° indicative of the intrinsically weak water–graphene interaction. In contrast, a partially graphenized surface, terminated predominantly by the G0 layer, exhibits a substantially smaller contact angle of ∼73°, indicative of stronger interactions between water and G0.Reference Zhou, Ganesh, Presser, Wander, Fenter, Kent, Jiang, Chialvo, McDonough, Shuford and Gogotsi29 Even though the G0 layer has the same composition as the intrinsic graphene layers, its interactions with water are distinct because of its difference in hybridization (sp Reference Symons3 versus sp 2) associated with its bonding to the SiC substrate.Reference Emery, Detlefs, Karmel, Nyakiti, Gaskill, Hersam, Zegenhagen and Bedzyk35,Reference Emtsev, Speck, Seyller, Ley and Riley36 XR studies on a G0-dominant EG sample showed that the structure of water adjacent to G0 is generally similar to that of water adjacent to Gn, but with a smaller average first water layer height of 2.3 Å.Reference Zhou, Ganesh, Presser, Wander, Fenter, Kent, Jiang, Chialvo, McDonough, Shuford and Gogotsi29Ab initio molecular dynamics studies suggest that this apparently smaller water layer height at the G0 surface can be understood as being due to the adsorption of hydroxyls at defect sites on the surface.Reference Zhou, Ganesh, Presser, Wander, Fenter, Kent, Jiang, Chialvo, McDonough, Shuford and Gogotsi29
The calcite–water interface
The calcite–water interface is representative of ionic crystals. The (104) cleavage plane has a unit mesh area of 20.2 Å2 and includes one Ca2+ ion and one carbonate group (CO32–). Although the surface is neutral, on average (Figure 3c), each ion at the surface expresses a charge that is not fully screened by adjacent counter ions. These surface groups are undercoordinated (e.g., Ca2+ has an octahedral coordination in the bulk, whereas Ca2+ at the surface is coordinated by five lattice oxygens), which is expected to result in a strong interaction of the ions with the water dipole. This surface, therefore, provides a natural template for the adsorption and organization of water, with space for two water molecules per surface unit cell.
The primary hydration layer at the calcite surfaceReference Fenter, Kerisit, Raiteri and Gale24,Reference Fenter and Sturchio25,Reference Geissbühler, Fenter, DiMasi, Srajer, Sorensen and Sturchio31 consists of two distinct types of water that are adsorbed at heights of 2.0 Å and 2.9 Å with respect to the average surface height (based on both XR results and classical molecular dynamics [MD] simulations). Both nonspecular XR data and MD simulations reveal that the lower water molecule directly coordinates with the surface Ca ion to complete its coordination shell. That is, water solvates the broken Ca–O bonds that were disrupted by forming the surface. The second water layer hydrates the surface carbonate ion through the formation of a donating hydrogen bond from the water hydrogen to the carbonate oxygen protruding from the surface at a height of ∼1 Å. Together, these two water layers form a single space-filling hydration layer with an average height of 2.4 Å and a 2D density of 10.9 H2O/nm2, again as might be expected for the close packing of a dense hydration layer. Beyond this primary hydration layer, a largely featureless water profile is observed.
The rutile–water interface
Rutile TiO2 is representative of many oxides (and other solids) in which the creation of a surface involves the breaking of covalent bonds (i.e., Ti–O bonds for rutile). As is typical of oxide surfaces, the ideally cleaved rutile surface with undercoordinated Ti atoms is energetically unstable under ambient conditions. A substantial reduction in surface energy occurs through its solvation by water, leading to the formation of a low-energy surface defined by the presence of surface functional groups, including terminal oxygen (i.e., Ti–O, or “TO”) and bridging oxygen (i.e., Ti–O–Ti, or “BO”) sites at heights of ±0.4 Å (Figure 3d). These functional groups exhibit a range of protonation states (e.g., Ti–O–, Ti–OH0, Ti–OH2+), leading to a pH-dependent surface charge. The TiO2(110) surface has a point of zero charge at pH 5.4, where it is thought to be primarily terminated by bare BO sites and doubly protonated TO–H2 sites (but with 30% of the surface sites deprotonated as TO–H).Reference Wesolowski, Sofo, Bandura, Zhang, Mamontov, Předota, Kumar, Kubicki, Kent, Vlcek, Machesky, Fenter, Cummings, Anovitz, Skelton and Rosenqvist37
The derived vertical water density profile shows that the surface hydration layer is very compact, consisting of what appears to be a single layer of water molecules with an average height of 2.1 Å above the average surface oxygen height.Reference Zhang, Fenter, Sturchio, Bedzyk, Machesky and Wesolowski22 Nonspecular XR measurements and MD simulations, however, reveal that this hydration layer consists of at least three distinct configurations of adsorbed water in distinct adsorption geometries that presumably are stabilized by hydrogen bonding with the TO and BO sites. No significant perturbation of the interfacial water structure is observed beyond this first hydration layer (i.e., at heights of >4 Å). This lack of a visible modulation in the water density profile beyond the first adsorbed water layer is not a general characteristic of oxide surfaces. For example, a more structured water layer is observed at the Al2O3(001) and Fe2O3(001) surfaces,Reference Catalano20 illustrating how multiple factors contribute to the observed behavior.
Together, these results provide a first-order experimental understanding of the relationship between the solid–water interactions and the organization of water at the solid–water interface. The hydrophobic surface of intrinsic graphene is observed to have the largest height of the first water layer (3.2 Å). In comparison, the average water height at the rutile (110) surface is significantly smaller (2.1 Å). For this specific case of rutile, the strong interaction between the first water layer and the substrate weakens the interaction of this first water layer with subsequent water layers.Reference Fenter and Sturchio30 This leads to the macroscopic observation that the hydrated surface appears to be “non-wetting.” A second manifestation of differences in the solid–water interaction is found in the spatial extent of perturbations of the water density profile away from the interface. Whereas graphene and muscovite show modulations that extend to ∼10 Å above the surface, in the case of the rutile surface, the water structuring is confined within a height of ∼4 Å. The case of calcite is intermediate, with perturbations extending to ∼7 Å above the surface.
Influence of adsorbed ions at charged solid–water interfaces
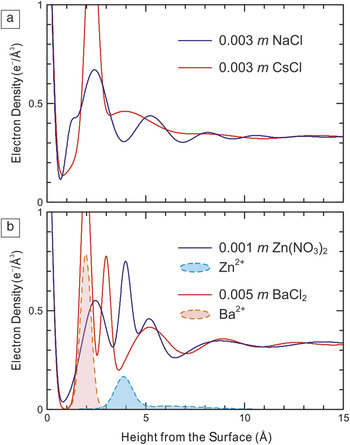
The preceding discussion is focused on the behavior of nominally pure water at various types of interfaces. When the interfaces are charged (e.g., the basal surface of muscovite mica), the formation of an electrical double layer neutralizes the surface, through either the specific adsorption of ions or the formation of a diffuse ion profile.Reference Stumm7 The impact of these adsorbed ions on the interfacial water structure is illustrated in Figure 4, where the interfacial electron density profiles of muscovite in contact with water containing various salts (including Na+ versus Cs+, and Zn2+ versus Ba2+)Reference Lee, Fenter, Nagy and Sturchio38,Reference Lee, Fenter, Park, Sturchio and Nagy39 are shown. In the case of monovalent ions (Figure 4a), there is an extended hydration structure in the presence of Na+, including approximately four distinct layers extending ∼1 nm into solution (the location of Na+ in this system is not known). This modulation is not observed in the presence of a different monovalent ion, Cs+ (here, the high-density peak at 2.3 Å is due to specific adsorption of Cs+). More dramatic changes are observed in the presence of divalent ions (Figure 4b), including multiple distinct hydration layers. Even when considering the contribution of each ion to the electron density profiles (shaded regions), it is apparent that the interfacial hydration structures for these systems are distinct, and these differences are controlled, at least in part, by the ion properties (e.g., charge, ion size, and hydration energy).
Measured interfacial electron density profiles of the muscovite–water interface in contact with aqueous electrolyte solutions. The presence of different ions, for example, (a) Na versus CsReference Lee, Fenter, Nagy and Sturchio38 and (b) Zn versus Ba,Reference Lee, Fenter, Park, Sturchio and Nagy39 leads to substantial changes in the observed interfacial hydration structure. The shaded regions in (b) indicate the electron-density profiles of Zn, measured by using resonant anomalous x-ray reflectivity, and Ba, calculated using a space-filling constraint, respectively.Reference Lee, Fenter, Park, Sturchio and Nagy39

Summary and perspective
The examples presented here illustrate how the relationships between solid–water interactions and the observed interfacial water structure can be revealed through the use of high-resolution synchrotron x-ray reflectivity measurements. These results, when complemented by high-level computational studies (e.g., density functional theory and molecular dynamics simulations), provide a robust approach to test and extend the current understanding of these systems.Reference Fenter, Kerisit, Raiteri and Gale24,Reference Zhou, Ganesh, Presser, Wander, Fenter, Kent, Jiang, Chialvo, McDonough, Shuford and Gogotsi29,Reference Wesolowski, Sofo, Bandura, Zhang, Mamontov, Předota, Kumar, Kubicki, Kent, Vlcek, Machesky, Fenter, Cummings, Anovitz, Skelton and Rosenqvist37,Reference Bandura, Sykes, Shapovalov, Troung, Kubicki and Evarestov40–Reference Park and Sposito42 Although the experimental results clearly indicate that water is ordered vertically and laterally near the solid–water interface, the ordered structures are not well-described as one of the known water ice structures (i.e., they are not “ice-like”).Reference Du, Freysz and Shen13 Instead, the observed hydration structures are dictated by the characteristics of the solid surface (e.g., the arrangement and coordination of atoms and the charge on the surface) and are observed to be sensitive to the adsorption of ions. This represents an important first step toward understanding the reactivity of solid–water interfaces, including how it influences the adsorption of ions, the heterogeneous growth of films, and the reactivity of the substrate solid (including dissolution and growth). More generally, it provides a basis for understanding the challenging question of how water structure is perturbed by confinement, as is now being studied.Reference Chodankar, Perret, Nygård, Bunk, Satapathy, Espinosa Marzal, Balmer, Heuberger and van der Veen43
Acknowledgments
The work described herein is the product of the contributions of many people over many years. Of particular note are the long-term collaborations with Neil C. Sturchio, Kathryn L. Nagy, David J. Wesolowski, and Michael J. Bedzyk, as well as the many current and past members of the Interfacial Processes Group at Argonne National Laboratory. This material is primarily based upon work supported by the US Department of Energy, Office of Science, Office of Basic Energy Sciences, Division of Chemical Sciences, Biosciences, and Geosciences (Geoscience subprogram, Nicholas Woodward), with the work on TiO2 done through a multi-institutional collaboration led by Oak Ridge National Laboratory. Work on graphene-water interactions was supported as part of the Fluid Interface Reactions, Structures and Transport (FIRST) Center, an Energy Frontier Research Center funded by the US Department of Energy, Office of Science, Office of Basic Energy Sciences. Measurements were performed at the Advanced Photon Source, a DOE Office of Science User Facility. The manuscript was created at UChicago Argonne, LLC, Operator of Argonne National Laboratory. Argonne, a US Department of Energy Office of Science laboratory, is operated under Contract DE-AC02-06CH11357. The US Government retains for itself, and others acting on its behalf, a paid-up nonexclusive, irrevocable worldwide license in said article to reproduce, prepare derivative works, distribute copies to the public, and perform publicly and display publicly, by or on behalf of the Government.