Introduction
Graphene achieved widespread attention when it was separated from graphite in 2004 using the micromechanical exfoliation (i.e., adhesive tape) method.Reference Novoselov, Geim, Morozov, Jiang, Zhang, Dubonos, Grigorieva and Firsov1 Although micromechanical exfoliation is a straightforward and easily reproduced method that results in high-quality graphene suitable for fundamental studies, it lacks sufficient scalability for the bulk production of graphene-based materials. Similarly, chemical vapor deposition (CVD) of graphene on metal substrates and epitaxial growth of graphene on silicon carbide (see the articles by Nyakiti et al. and Bartelt and McCarty in this issue) are well-suited for planar applications (e.g., integrated circuits), but are not naturally extended to three-dimensional graphene-based composites.Reference Hass, de Heer and Conrad2–Reference Li, Cai, An, Kim, Nah, Yang, Piner, Velamakanni, Jung, Tutuc, Banerjee, Colombo and Ruoff4 In contrast, solution methods for isolating graphene exhibit several attributes that overcome the limitations of micromechanical exfoliation and high-temperature growth techniques, including (1) utilization of inexpensive graphite powder as the source material, (2) elimination of the need to transfer graphene from the growth substrate, (3) scalability to large-volume processing for industrial applications, and (4) amenability to mixing with polymers or other nanomaterials to form graphene nanocomposites.
In this article, we review solution processing of graphene with a particular focus on methods that enable the incorporation of graphene and related materials into bulk materials and composites. For organizational purposes, the solution-processing methods are separated into four major categories: (1) oxidation and subsequent reduction of graphite as a pathway to isolating graphene oxide and reduced graphene oxide, respectively; (2) exfoliation of graphene in aqueous solutions using amphiphilic surfactants; (3) direct exfoliation of graphene in organic solvents; and (4) exfoliation of graphene using intercalation and electrochemical methods. After describing these solution-based methods, we outline the integration of graphene with polymers and other nanomaterials in bulk material and nanocomposite forms. Furthermore, representative applications in energy conversion and storage, catalysis, electronics, and high-strength materials are delineated throughout the article in an effort to foreshadow the expected technological impact of graphene-based materials and composites.
Isolating graphene through solution processing
Synthesis and characterization of graphene oxide and reduced graphene oxide
Oxidation of graphite to graphite oxide (now commonly called graphene oxide [GO]) traces its origins to 1859, when Brodie used fuming nitric acid and potassium chlorate (KClO3) to oxidize graphite.Reference Brodie5 Approximately a century later, Hummers and Offeman developed a procedure for oxidizing graphite that used potassium permanganate (KMnO4) and sulfuric acid as oxidative agents.Reference Hummers and Offeman6 Following this pioneering work, the Hummers method and its variantsReference Kovtyukhova, Ollivier, Martin, Mallouk, Chizhik, Buzaneva and Gorchinskiy7 have been widely used for GO formation.Reference Kovtyukhova, Ollivier, Martin, Mallouk, Chizhik, Buzaneva and Gorchinskiy7–Reference Sun, Liu, Welsher, Robinson, Goodwin, Zaric and Dai12
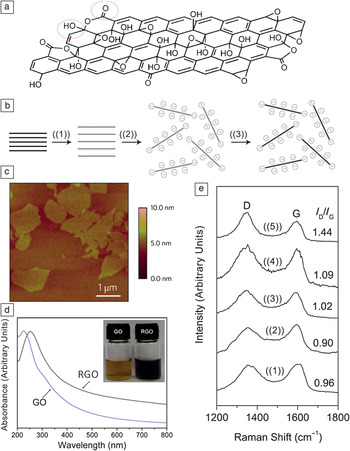
Nuclear magnetic resonance (NMR) and infrared (IR) spectroscopies and x-ray diffraction (XRD) indicate that hydroxyl and carbonyl groups decorate the surface of GO formed by these oxidation methods (Figure 1a). These hydroxyl and carbonyl groups provide electrostatic repulsion between GO sheets, thus minimizing aggregation in solution.Reference Gao, Alemany, Ci and Ajayan13, Reference Josepovits, Sanakis, Petridis and De16–Reference Rodriguez and Jimenez18 Furthermore, these oxygen moieties render GO hydrophilic, which enables straightforward dispersion in aqueous solution through sonication.Reference Wang, Yang, Park, Gou, Wang, Liu and Yao19, Reference Stankovich, Dikin, Piner, Kohlhaas, Kleinhammes, Jia, Wu, Nguyen and Ruoff20 Once in solution, the dispersed graphene oxide sheets can then be converted to reduced graphene oxide (RGO) through chemical reduction, as schematically depicted in Figure 1b.Reference Li, Müller, Gilje, Kaner and Wallace14Figure 1c shows an atomic force microscopy image of GO sheets produced by a modified Hummers method. The GO sheets have an average lateral size of about 1 μm and a thickness of approximately 1 nm.Reference Gao, Alemany, Ci and Ajayan13
(a) Structural model of graphene oxide (GO) showing hydroxyl and carbonyl groups. Adapted from Reference Reference Gao, Alemany, Ci and Ajayan13. (b) Schematic illustration of the synthesis of aqueous graphene dispersions: ((1)) oxidation of graphite (black blocks) to graphite oxide (light gray blocks) with greater interlayer distance, ((2)) exfoliation of GO in water by sonication to obtain GO colloids, and ((3)) chemical conversion of GO to RGO in solution. Reproduced with permission from Reference Reference Li, Müller, Gilje, Kaner and Wallace14. ©2008, Nature Publishing Group. (c) Atomic force microscopy image of GO sheets on a silicon substrate. Reproduced with permission from Reference Reference Gao, Alemany, Ci and Ajayan13. ©2009, Nature Publishing Group. (d) Optical absorbance spectra of GO and RGO. (e) Raman spectra of ((1)) GO; RGO obtained by hydrothermal treatment of GO at ((2)) 180°C, ((3)) 150°C, and ((4)) 120°C for 6 h; and ((5)) hydrazine-reduced GO, indicating the increased intensity of defect peaks (I D) relative to graphene peaks (I G) for chemically and hydrothermally reduced GO compared to GO. Parts (d) and (e) reproduced with permission from Reference Reference Zhou, Bao, Tang, Zhong and Loh15. ©2009, American Chemical Society.

Several applications have been demonstrated for GO prepared by the Hummers method. For example, as-produced GO has been used as a catalyst in reactions such as oxidation of alcohols and alkyls,Reference Pyun21 as a surfactant to disperse other nanomaterials such as carbon nanotubes (CNTs) in aqueous solution,Reference Cote, Kim, Tung, Luo, Kim and Huang22 and as a hole-transport and electron-blocking layer in organic photovoltaics.Reference Li, Tu, Lin, Chen and Chhowalla23, Reference Murray, Lou, Cote, Loser, Kadleck, Xu, Szarko, Rolczynski, Johns, Huang, Yu, Chen, Marks and Hersam24 Furthermore, GO exhibits intrinsic and tunable fluorescence, indicating potential application as an optical material.Reference Loh, Bao, Eda and Chhowalla25
More commonly, however, GO serves as a precursor to RGO. The reduction of GO has been achieved chemically with reducing agents such as hydrazine,Reference Li, Müller, Gilje, Kaner and Wallace14, Reference Yan, Zhao and Pan26–Reference Xu, Bai, Lu, Li and Shi28 zinc powder,Reference Mei and Ouyang29 iron powder,Reference Fan, Kai, Yan, Wei, Zhi, Feng, Ren, Song and Wei8 dimethylformamide (DMF),Reference Ai, Liu, Lu, Cheng and Huo30 laser irradiation,Reference Huang, Liu, Ji, Xie, Wang and Shi31 poly(diallyldimethylammonium chloride) (PDDA),Reference Zhang, Shao, Liao, Engelhard, Yin and Lin32 and nontoxic reducing agents such as green teaReference Wang, Shi and Yin33 and vitamin C.Reference Fernandez-Merino, Guardia, Paredes, Villar-Rodil, Solis-Fernandez, Martinez-Alonso and Tascon34 Other GO reduction methods include simultaneous electrochemical reduction and deposition on surfacesReference Guo, Wu, Liu, Ma, Yang, Zheng, Yu and Liu35 and high-temperature reduction of GO sheets in a reducing gas atmosphere such as hydrogen. The latter approach is often used for synthesizing RGO composites, papers, or thin films for electronics and energy applications.Reference Lee, Smith, Hayner and Kung36, Reference Wang, Zhi and Müllen37
As illustrated in Figure 1d, GO colloidal suspensions undergo a color change from yellow to black when RGO is formed.Reference Zhou, Bao, Tang, Zhong and Loh15 RGO has been employed in many applications, including transistors and transparent conductors,Reference Kim, Pham, Cuong, Kim, Chung, Hur and Cho38–Reference Becerril, Mao, Liu, Stoltenberg, Bao and Chen45 biological and chemical sensors,Reference Guo, Wu, Liu, Ma, Yang, Zheng, Yu and Liu35, Reference Jiang46–Reference Ji, Honma, Paek, Akada, Hill, Vinu and Ariga48 and photovoltaics.Reference Xu, Long, Huang, Huang, Wan, Ma and Chen49, Reference Liu, He, Wang, Wu and Wang50 In comparison with mechanically exfoliated graphene, RGO exhibits more topological defects and a higher surface roughness.Reference Gómez-Navarro, Meyer, Sundaram, Chuvilin, Kurasch, Burghard, Kern and Kaiser51Figure 1e shows the defect (D) peaks in the Raman spectra of chemically and hydrothermally reduced GO.Reference Zhou, Bao, Tang, Zhong and Loh15 As a result of these defects and remnant oxygen functionalities, the electrical properties of RGO are compromised compared to those of pristine graphene.Reference Tung, Allen, Yang and Kaner52
Exfoliation of graphite in aqueous solutions with amphiphilic surfactants
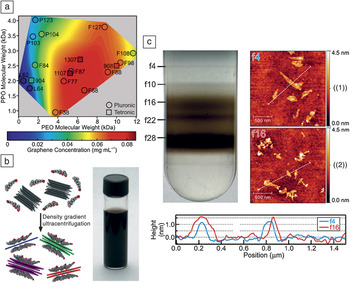
In an effort to avoid the defects introduced during the aforementioned oxidative and reductive chemical treatments, researchers have also developed methods for directly exfoliating graphene from graphite in aqueous solutions using ultrasonication in amphiphilic surfactants such as sodium dodecyl benzene sulfonate (SDBS),Reference Lotya, Hernandez, King, Smith, Nicolosi, Karlsson, Blighe, De, Wang, Mcgovern, Duesberg and Coleman53 sodium cholate (SC), and sodium dodecyl sulfate (SDS).Reference Green and Hersam54 Biocompatible, amphiphilic block copolymers (such as those sold under the trade names Pluronic and Tetronic) have also yielded effective dispersion of graphene in aqueous solutions.Reference Seo, Green, Antaris and Hersam55 These block copolymers contain hydrophobic poly(propylene oxide) (PPO) and hydrophilic poly(ethylene oxide) (PEO) domains that preferentially interact with graphene sheets and water molecules, respectively, enabling the graphene sheets to disperse in water without a covalent modification step. The concentration of graphene in aqueous solution depends on the lengths of the PPO and PEO chains, as shown in Figure 2a.Reference Seo, Green, Antaris and Hersam55
(a) Graphene concentration map for various Pluronic and Tetronic compositions (identified by trade name), showing the dependence of the concentration of graphene in aqueous solution on the lengths of the poly(propylene oxide) (PPO) and poly(ethylene oxide) (PEO) blocks of the block copolymers. Reproduced with permission from Reference Reference Seo, Green, Antaris and Hersam55. ©2011, American Chemical Society. (b) Schematic illustration of a surfactant-based graphene exfoliation process in aqueous solution, along with a photograph of a 90 μg ml–1 graphene dispersion in sodium cholate (SC). (c) Photograph of a centrifuge tube containing an aqueous solution of SC-coated graphene after the application of density gradient ultracentrifugation (DGU) and representative atomic force microscopy images of graphene from fractions designated ((1)) f4 and ((2)) f16 on a SiO2substrate. The height profiles corresponding to the indicated line scans from the two fractions demonstrate the different thicknesses of graphene flakes, in this case about 1 nm and 1.5 nm, segregated using DGU. Parts (b) and (c) reproduced with permission from Reference Reference Green and Hersam54. ©2009, American Chemical Society.

Figure 2b schematically illustrates the ultrasonic exfoliation of graphene from graphite in aqueous solution containing SC.Reference Green and Hersam54 As indicated in the schematic, solution-phase methods for directly exfoliating graphene from graphite typically offer minimal control over the thickness (i.e., number of layers) in the dispersed graphene sheets, which is suboptimal for many applications because many properties of graphene depend on the number of layers.Reference Green and Hersam56 For example, single-layer graphene is a zero-bandgap semimetal,Reference Castro Neto, Guinea, Peres, Novoselov and Geim57 whereas bilayer graphene has a tunable bandgap in the infrared regionReference Zhang, Tang, Girit, Hao, Martin, Zettl, Crommie, Shen and Wang58 and trilayer graphene has a band overlap that can be controlled by applying an electric field.Reference Craciun, Russo, Yamamoto, Oostinga, Morpurgo and Tarucha59
An important advantage of dispersing graphene in aqueous solutions is that these solutions are compatible with methods for separating and purifying nanomaterials such as density-gradient ultracentrifugation (DGU).Reference Arnold, Green, Hulvat, Stupp and Hersam60, Reference Green and Hersam61 For example, SC has a planar structure and can encapsulate few-layer-graphene particles to form well-ordered graphene/SC assemblies (as illustrated in Figure 2b). With this geometry, the buoyant density of these graphene/SC particles varies as a function of their thickness, presenting an opportunity for thickness sorting by DGU. In the graphene DGU process, SC-coated graphene sheets are initially loaded into a fluid of linearly varying density. During subsequent ultracentrifugation, the graphene sheets sediment through the density gradient until they reach the point where their density matches the local density of the fluid, forming distinct bands in the centrifuge tube. These bands contain graphene sheets with specific numbers of layers, which are then harvested in a fractionation step. Figure 2c shows these bands in a centrifuge tube along with atomic force microscopy characterization of selected fractions, illustrating separation by graphene thickness and thus number of layers.Reference Green and Hersam54 Single-layer graphene isolated by DGU was recently employed in high-performance flexible electronic devices that operate at frequencies in the gigahertz range.Reference Sire, Ardiaca, Lepilliet, Seo, Hersam, Dambrine, Happy and Derycke62
Direct exfoliation of graphene in organic solvents
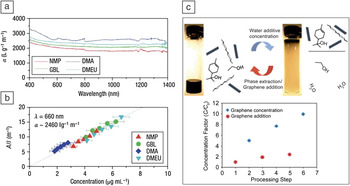
Another effective solution-phase method for exfoliating graphene from graphite is sonication of pristine graphite in organic solvents.Reference Hernandez, Nicolosi, Lotya, Blighe, Sun, De, McGovern, Holland, Byrne, Gun’Ko, Boland, Niraj, Duesberg, Krishnamurthy, Goodhue, Hutchison, Scardaci, Ferrari and Coleman63–Reference O’Neill, Khan, Nirmalraj, Boland and Coleman65 For example, Hernandez et al. used organic solvents such as N-methyl-2-pyrrolidone (NMP), γ-butyrolactone (GBL), N,N-dimethylacetamide (DMA), and N,N′-dimethylethyleneurea (DMEU) to obtain graphene dispersions with ~1 wt% yield (although the yield could be increased to ~12 wt% by recycling the graphite sediment). Because a mild-bath sonication was used for graphite exfoliation followed by a gentle centrifugation step for sedimentation and separation of the remaining graphite, the resulting graphene was reported to have a low defect density as determined by Raman spectroscopy.Reference Hernandez, Nicolosi, Lotya, Blighe, Sun, De, McGovern, Holland, Byrne, Gun’Ko, Boland, Niraj, Duesberg, Krishnamurthy, Goodhue, Hutchison, Scardaci, Ferrari and Coleman63 With this method, graphene dispersions with concentrations of approximately 0.01 mg/ml were obtained in various solvents. Figure 3a–b show the optical absorbance data for such solutions. NMP was found to be the best choice among the four tested solvents for graphene exfoliation, yielding the highest graphene concentration, because its surface energy provides the best match with the surface energy of graphene.Reference Hernandez, Nicolosi, Lotya, Blighe, Sun, De, McGovern, Holland, Byrne, Gun’Ko, Boland, Niraj, Duesberg, Krishnamurthy, Goodhue, Hutchison, Scardaci, Ferrari and Coleman63
(a) Absorption spectra for few-layer graphene dispersed in N-methyl-2-pyrrolidone (NMP), γ-butyrolactone (GBL), N,N-dimethylacetamide (DMA), and N,N′-dimethylethyleneurea (DMEU) at concentrations from 2 to 8 μg ml–1. (b) Optical absorbance, A (at λ = 660 nm), divided by cell length (l) for graphene in the four solvents NMP, GBL, DMA, and DMEU, showing Beer–Lambert behavior (absorbance proportional to concentration and path length) with an average absorption coefficient of 〈α660〉 ≈ 2460 l g–1 m–1. The x-axis error bars indicate the uncertainty in measuring the mass of graphene/graphite in solution. Parts (a) and (b) reproduced with permission from Reference Reference Hernandez, Nicolosi, Lotya, Blighe, Sun, De, McGovern, Holland, Byrne, Gun’Ko, Boland, Niraj, Duesberg, Krishnamurthy, Goodhue, Hutchison, Scardaci, Ferrari and Coleman63. ©2008, Nature Publishing Group. (c) Vials of a 1:5 mixture of terpineol and ethyl cellulose stabilized graphene/ethanol solution before and after water addition. Upon the addition of water, the hydrophobic graphene flakes preferentially separate into the concentrated terpineol fraction, leaving behind a predominantly ethanol and water mixture. The concentration factor C/C 0 of graphene (for an initial concentration of C 0= 102.4 μg/ml) is plotted after each solvent-exchange concentration and graphene/ethanol addition step for three iterations. Reproduced with permission from Reference Reference Liang and Hersam66. ©2010, American Chemical Society.

For applications that require higher graphene concentrations, Liang et al. employed a stabilizer and solvent-exchange method to increase the concentration of graphene in organic solvents. They initially used ethanol as a solvent to exfoliate graphite and obtained a graphene dispersion with a concentration of 1.6 μg/ml. However, upon addition of ~1% w/v ethyl cellulose (EC) to ethanol, the graphene concentration was substantially enhanced to more than 120 μg/ml. Terpineol was then added to dilute this solution to about 100 μg/ml. Because the EC-stabilized graphene flakes are hydrophobic, subsequent addition of water to the graphene/terpineol/ethanol/EC solution induced the graphene to leave the EC phase and concentrate in the small-volume terpineol phase, resulting in a graphene ink with a concentration of about 1 mg/ml following three iterations of this solvent-exchange process (Figure 3c).Reference Liang and Hersam66
Exfoliation of graphene using intercalation and electrochemical methods
Graphite intercalation compounds such as tetrabutylammonium hydroxide (TBA) have also been used for exfoliation of graphite or weakly oxidized graphite oxide. Although this method yields large graphene flakes, the resulting graphene contains significant quantities of defects.Reference Ang, Wang, Bao, Thong and Loh67, Reference Li, Zhang, Bai, Sun, Wang, Wang and Dai68 Ionic intercalation compounds can also be used for graphite exfoliation, but they either leave oxygen moieties on the graphene sheets or produce graphene flakes that are relatively small compared to those obtained using competing intercalation compounds (e.g., TBA).Reference Zheng, Di, Liu, Liu, Guo, Du, Wu, Yu and Zhu69, Reference Behabtu, Lomeda, Green, Higginbotham, Sinitskii, Kosynkin, Tsentalovich, Parra-Vasquez, Schmidt, Kesselman, Cohen, Talmon, Tour and Pasquali70
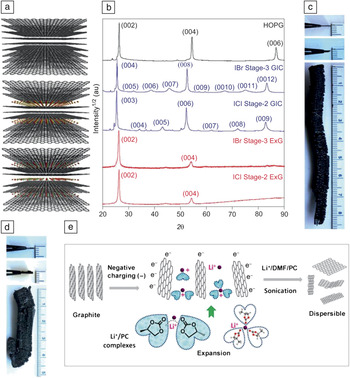
To address these issues, Shih et al. used halides (ICl and IBr) as intercalants for graphite.Reference Shih, Vijayaraghavan, Krishnan, Sharma, Han, Ham, Jin, Lin, Paulus, Reuel, Wang, Blankschtein and Strano71 In this method, a piece of highly oriented pyrolytic graphite (HOPG) was placed in a reactor along with the intercalation compounds and heated to 100–160°C for 48 h. The intercalated graphite was then immediately heated to 800°C in an argon atmosphere, leading to volumetric expansion. The degree of intercalation is controlled by the intercalation temperature, providing significant tunability. For example, every third layer of the graphite lattice can be intercalated (stage 3), or every second layer can be intercalated (stage 2), as shown in Figure 4a. These well-ordered crystallographic stages are demonstrated by the XRD patterns in Figure 4b.
(a) Schematic illustration of highly oriented pyrolytic graphite (HOPG) (top), IBr stage-3 graphite intercalation compound (GIC) (middle), and ICl stage-2 GIC (bottom) (carbon, gray; iodine, red; bromine, yellow; chlorine, cyan). (b) X-ray diffraction patterns of HOPG, IBr stage-3 GIC, ICl stage-2 GIC, IBr stage-3 expanded graphite (ExG), and ICl stage-2 ExG. For IBr stage-3 GIC, three additional peaks appear between two of the three main peaks corresponding to the (002), (004), and (006) planes in HOPG, which is a clear signature of stage-3 GIC (the intercalant layer inserts between every three graphene layers). (c) Photographs of HOPG (top), stage-3 GIC (middle), and stage-3 ExG formed by lithium intercalation (bottom). (The HOPG and GIC materials are held up with tweezers with the edges toward the viewer). (d) Photographs of HOPG (top), stage-2 GIC (middle), and stage-2 ExG (bottom). Parts (a)–(d) reproduced with permission from Reference Reference Shih, Vijayaraghavan, Krishnan, Sharma, Han, Ham, Jin, Lin, Paulus, Reuel, Wang, Blankschtein and Strano71. ©2011, Nature Publishing Group. (e) Schematic illustration of electrochemically charged graphite in Li+/propylene carbonate (PC). The expanded graphite is then exfoliated by power sonication in LiCl in a dimethylformamide/PC mixed solvent. Part (e) reproduced with permission from Reference Reference Wang, Manga, Bao and Loh72. ©2011, American Chemical Society.

Stage-2 and stage-3 expanded samples exhibit a substantial volume expansion, as shown in Figure 4c–d. The two bottom profiles in Figure 4b show the XRD patterns of stage-2 and stage-3 expanded graphite. The corresponding (002) and (004) peak positions are almost identical to those of HOPG, indicating that the spacing of the graphene planes in graphite is restored. Furthermore, the decrease in (004) peak intensity and the absence of the (006) peak show that the two materials are made of fewer than four graphite layers.Reference Shih, Vijayaraghavan, Krishnan, Sharma, Han, Ham, Jin, Lin, Paulus, Reuel, Wang, Blankschtein and Strano71
Inspired by electrochemical reactions in lithium-ion batteries, Wang et al. used intercalation of lithium ions in graphite to exfoliate graphite. The primary advantage of this method is the high yield of single- and few-layer graphene (more than 70%), whereas the yield is often less than 1% in competing exfoliation methods. In the lithium intercalation process, graphite is used as the negative electrode in a lithium-ion battery cell.Reference Wang, Manga, Bao and Loh72 In many commercial lithium-ion batteries, electrolytes are selected so that they form a protective layer on the graphite anode that is referred to as the solid electrolyte interphase (SEI). SEI formation prevents graphite exfoliation and promotes a longer battery life.Reference Shu, Mcmillan, Murray and Davidson73 Therefore, for effective graphite exfoliation with the highest yield, electrolytes are needed that do not form an SEI layer, such as propylene carbonate (PC).Reference Rauh and Brummer74 To further promote exfoliation, Wang et al. used a high applied potential (–15 ± 5 V) to activate the intercalation of PC molecules in addition to Li+ ions into the graphite.Reference Wang, Manga, Bao and Loh72 The resulting expanded graphite was then exfoliated to graphene by sonication in LiCl in a DMF/PC mixed solvent. Figure 4e schematically illustrates this process.Reference Wang, Manga, Bao and Loh72
Amphiphilic surfactants such as SDS have also been used as intercalating compounds. In addition to serving as intercalants, the surfactants that adsorb on the surface of the exfoliated graphene sheets prevent the sheets from restacking in solution following exfoliation. In this method, a graphite rod is used as a working electrode with a platinum counter electrode in a 1% SDS aqueous solution. The graphite rod is initially treated as an anode in an effort to drive SDS intercalation. Then, the intercalated graphite is treated as a cathode, leading to the exfoliation and dispersion of SDS-functionalized graphene sheets. The size and concentration of the graphene sheets can be controlled by the intercalation potential, thus providing a degree of dispersion tunability.Reference Alanyalıoğlu, Segura, Oró-Solè and Casañ-Pastor75
Solution-processed graphene composites
Because of its extended sp 2-hybridized carbon network, graphene has exceptional electrical and thermal conductivity and superlative mechanical properties, thus making it a promising candidate for composite materials.Reference Balandin, Ghosh, Bao, Calizo, Teweldebrhan, Miao and Lau76, Reference Lee, Wei, Kysar and Hone77 Additive components that are commonly used for synthesizing graphene composites are polymers and nanoparticles of metals, metal compounds, and carbon. Solution-processing methods such as solution mixing and in situ polymerization have the advantage of producing well-mixed composites in comparison with other methods such as melt compounding. The following two subsections provide representative examples of graphene/polymer and graphene/nanoparticle composites.
Graphene/polymer composites
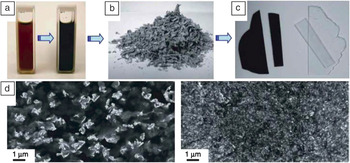
Graphene, GO, and RGO composites with insulating and conducting polymers have been widely reported in the literature.Reference Alzari, Nuvoli, Scognamillo, Piccinini, Gioffredi, Malucelli, Marceddu, Sechi, Sanna and Mariani78–Reference Santos, Tria, Vergara, Cui, Pernites, Advincula, Aileen and Vergara91 In the solution-mixing method for synthesizing graphene/polymer composites, a graphene, GO, or RGO colloidal dispersion is combined with the polymer in solution. This approach has been employed with a variety of both nonconducting polymers such as poly(vinyl alcohol),Reference Zhao, Zhang, Chen and Lu83, Reference Liang, Huang, Zhang, Wang, Ma, Guo and Chen88, Reference Das, Eswar Prasad, Ramamurty and Rao92 poly(methyl methacrylate),Reference Das, Eswar Prasad, Ramamurty and Rao92 poly(vinylidene fluoride),Reference Mohamadi and Sharifi-Sanjani93 polystyrene,Reference Stankovich, Dikin, Dommett, Kohlhaas, Zimney, Stach, Piner, Nguyen and Ruoff94, Reference Fang, Wang, Lu, Yang and Nutt95 and polycarbonateReference Higginbotham, Lomeda, Morgan and Tour96 and conducting polymers such as sulfonated poly(phenylene ethylene),Reference Yang, Zhang, Shan, Li, Han and Niu84 poly(3-hexylthiophene-2,5-diyl),Reference Wang, Kurunthu, Scott and Bardeen97 and poly(3,4-ethylenedioxythiophene).Reference Hong, Xu, Lu, Li and Shi98Figure 5 provides an example of the processing and resulting structure of a representative graphene/polymer composite.
An example of a fabrication process for a graphene/polymer composite: (a) Suspension of phenyl isocyanate-treated GO (1 mg/ml) and dissolved polystyrene in dimethylformamide before (left) and after (right) reduction of the GO by N,N-dimethylhydrazine. (b) Composite powder as obtained after coagulation in methanol. (c) Hot-pressed composite (opaque; 0.12 vol% graphene) and pure polystyrene (clear) of the same 0.4-mm thickness following identical processing. (d) Scanning electron microscopy (SEM) images obtained from a fracture surface of composite samples of 0.48 vol% (left) and 2.4 vol% (right) graphene in polystyrene. Reproduced with permission from Reference Reference Stankovich, Dikin, Dommett, Kohlhaas, Zimney, Stach, Piner, Nguyen and Ruoff94. ©2006, Nature Publishing Group.

In polymer composites that contain RGO, reduction of graphene oxide to RGO can be performed either before or after solution mixing. In the pregraphitization strategy, RGO is directly mixed with the polymer, thus avoiding exposure of the polymer to the graphene oxide reduction process that involves chemical treatments or high temperatures. On the other hand, the advantage of the postgraphitization strategy is that GO is easily dispersed in aqueous solutions because of its hydrophilicity, thus enabling the integration of GO with water-soluble polymers using a simple sonication step. Unfunctionalized graphene sheets that do not disperse well in water can be dispersed in solvents such as DMFReference Yu, Jiang, Wu, Wang and Wu99 and then mixed with the polymer solution. After the solutions are mixed, the composite can be precipitated by water/solvent evaporation,Reference Li, Liu, Li, Wan, Neoh and Kang100 filtration,Reference Li, Xie, Li, Liu and Li101 centrifugation,Reference Liu, Tao, Yang, Li, Boyer, Wuhrer, Braet and Davis102 or flocculation (for example, adding alcohol to a water-dispersed composite causes composite precipitation).Reference Salavagione, Martínez and Gómez103
In situ polymerization is another common solution method for synthesizing graphene/polymer composites. In this method, the monomer is mixed with the graphene, GO, or RGO colloidal suspension, and then polymerization is induced. Both pre- and postgraphitization processes are compatible with this strategy.Reference Xu and Gao104, Reference Hu, Wang, Wang, Wan, Liu, Zheng, Chen and Xu105 As an example, Hu et al. prepared graphene/polystyrene nanocomposites by mixing GO with styrene monomers and then inducing polymerization by adding potassium persulfate and heating in an inert atmosphere. In this case, hydrazine was then added to induce GO reduction to RGO.Reference Hu, Wang, Wang, Wan, Liu, Zheng, Chen and Xu105 This method tends to promote uniform coating of the graphene within the polymer matrix. However, the disadvantage is that interchain hydrogen bonding can be inhibited, resulting in a slight degradation in mechanical properties.Reference Kim, Miura and Macosko106
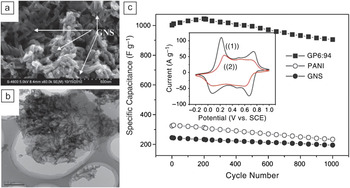
Applications for graphene-based polymer composites attempt to exploit the unique electrical, physical, and chemical properties of graphene and graphene oxide. For example, because of their high conductivities, polymer composites of graphene and RGO have been used in field-effect transistors,Reference Eda and Chhowalla107 supercapacitors,Reference Li, Xie, Li, Liu and Li101 and photovoltaics.Reference Liu, He, Wang, Wu and Wang50, Reference Spitsina, Lobach and Kaplunov108 Other applications such as biosensorsReference Lu, Do, Drzal, Worden and Lee109, Reference Zhou, Zhu, Yang, Luo, Li and Luan110 and biomedicalReference Fan, Wang, Zhao, Li, Shi, Ge and Jin111 applications rely on the high mechanical strength of graphene and GOReference Yang, Tu, Li, Shang and Tao112, Reference Kulkarni, Choi, Singamaneni and Tsukruk113 and the chemical stability of graphene. Figure 6a–b show scanning electron microscopy (SEM) and transmission electron microscopy (TEM) images of a composite of graphene nanosheets (GNSs) and polyaniline (PANI). PANI is generally regarded as a promising electrode material for supercapacitors because of its high energy-storage capacity. Figure 6c shows that addition of graphene nanosheets to PANI further improves this capacity by increasing the available surface area and conductivity of the PANI electrode.Reference Li, Xie, Li, Liu and Li101
(a) SEM and (b) transmission electron microscopy (TEM) images of a polyaniline (PANI)/graphene composite. (c) Variation of the specific capacitance of pure PANI, graphene nanosheets (GNSs), and graphene/polymer (GP) (6:94) composite electrodes as a function of cycle number measured at a rate of 50 mV s−1 in 1 M H2SO4aqueous solution. The inset shows the ((1)) first and ((2)) 1000th cyclic voltammograms of the GP6:94 composite. Reproduced with permission from Reference Reference Li, Xie, Li, Liu and Li101. ©2011, Elsevier.

Graphene/nanoparticle composites
Graphene and GO composites with other carbonaceous nanomaterials such as fullerenes and CNTs have also been reported.Reference Cai, Song and Xu114–Reference Tung, Chen, Allen, Wassei, Nelson, Kaner and Yang117 Typically, a colloidal dispersion of graphene or GO is directly mixed with another carbon nanomaterial dispersion and sonicated to form a uniform dispersion. The composite is then formed by vacuum filtration, drop casting, or blade coating of the mixed solution. In some cases, GO acts as a surfactant for the dispersion of CNTs in aqueous solutions because of its amphiphilic nature (GO has hydrophilic edges and hydrophobic regions on its basal plane).Reference Cote, Kim, Tung, Luo, Kim and Huang22 The addition of CNTs and fullerenes can increase the conductivity of graphene-based materials, which has utility for applications in electronics and transparent conductors.Reference Tung, Chen, Allen, Wassei, Nelson, Kaner and Yang117
Metal and metal-compound nanoparticles have also been explored as additives in graphene-based composites.Reference Liu, Pan, Lv, Zhu, Sun and Sun118–Reference Chang, Sun, Ho, Tao, Yan, Kwok and Zheng130 As for carbon-based nanomaterials, the most common method for preparing these composites is solution mixing of dispersions of graphene and a metal or metal compound. In addition, in situ methods for directly depositing nanoparticles on graphene sheets in solution have been reported.Reference Yang, Xu, Qiu, Chen, Deng, Zhang, Iwai, Watanabe and Chen131–Reference HongKun and Chao134 For example, HongKun and Chao demonstrated that gold, platinum, palladium, and silver nanoparticles can be deposited on RGO from their precursors (AuCl3·HCl·H2O, K2PtCl4, PdCl2, and AgNO3, respectively). These composites exhibited enhanced catalytic activity for the reduction reaction of potassium hexacyanoferrate(III).Reference HongKun and Chao134 Yang et al. also reported enhancement in electrocatalytic activity of graphene following decoration with gold nanoparticles, with potential applications in biomedical and energy technologies.Reference Yang, Xu, Qiu, Chen, Deng, Zhang, Iwai, Watanabe and Chen131 Similarly, RGO/silver nanoparticle composites showed excellent antibacterial capability comparable to that of the antibacterial drug ampicillin,Reference Xu, Zhang, Li, Lu, Li, Ma, Wang and Yu128 whereas graphene/iron nanoparticleReference Guo, Zhu, Song, Chen and Zhang135 and graphene/tin nanoparticleReference Wang, Wang, Wang, Park, Dou, Ahn and Kim136 composites were reported to have high lithium-ion capacities for use in rechargeable lithium-ion batteries.
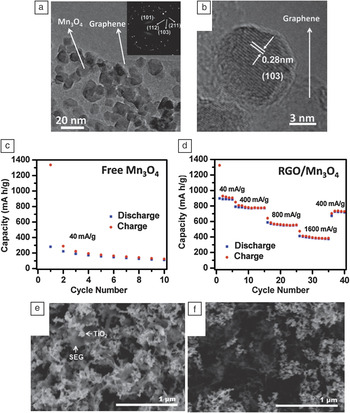
A variety of metal compounds have also been employed in graphene/nanoparticle composites. For instance, graphene and RGO have been incorporated into composites with Fe3O4,Reference Ji, Tan, Kuykendall, Aloni, Xun, Lin, Battaglia and Zhang124 vanadium nitride,Reference Zhang, Wang, He, Liu, Wang, Gu, Xu, Han, Dong, Zhang, Yao, Cui and Chen137 MnO2,Reference Deng, Zhu, Wang, Kang, Liu, Yang and Wang138, Reference Sun, Hu, Luo and Huang139 Mn3O4,Reference Wang, Cui, Yang, Casalongue, Robinson, Liang, Cui and Dai140 SnO2,Reference Zhao, Zhang, Song, Jiang, Zhuang, Liu and Fang125, Reference Paek, Yoo and Honma141 MoO2,Reference Sun, Hu, Luo and Huang139 TiO2,Reference Qiu, Yan, Yang, Jin, Deng and Li142 and CuOReference Wang, Wu, Shu, Guo and Wang143 for application in high-performance lithium-ion battery electrodes. In addition, RGO composites with CdSReference Liu, Pan, Lv, Zhu, Sun and Sun118 and ZnOReference Liu, Pan, Lv, Lu, Zhu, Sun and Sun144 were used for photocatalytic reduction of Cr(VI), and RGO composites with MnO2 were utilized in supercapacitors.Reference Deng, Zhu, Wang, Kang, Liu, Yang and Wang138Figure 7a–b show TEM and high-resolution TEM images, respectively, of an RGO/Mn3O4 composite. Figure 7c–d compare the specific lithium capacity and battery cycling performance of pure Mn3O4 and RGO/Mn3O4 composite, respectively, revealing improvement in the reversible capacity following the addition of RGO.Reference Wang, Cui, Yang, Casalongue, Robinson, Liang, Cui and Dai140Figure 7e–f show SEM images of solvent-exfoliated graphene (SEG) and solvent-reduced graphene oxide (SRGO) composites with mixed-phase titania (TiO2 P25) particles. These composites act as effective catalysts for CH3CHO photo-oxidation and CO2photoreduction reactions, respectively. In particular, SEG-based composites were found to exhibit higher catalytic activity than SRGO-based composites in both oxidation and reduction reactions. This observation was attributed to the reduced defect density and thus higher electron mean free path for SEG compared to SRGO.Reference Liang, Vijayan, Gray and Hersam145
(a) TEM and (b) high-resolution TEM images of reduced graphene oxide (RGO)/Mn3O4 composites. (c) Capacity retention of free Mn3O4 nanoparticles without graphene degrades after even one cycle at a current density of 40 mA/g. (d) Improved cycling performance of an RGO/Mn3O4 composite in a lithium-ion battery. Parts (a)–(d) reproduced with permission from Reference Reference Wang, Cui, Yang, Casalongue, Robinson, Liang, Cui and Dai140. ©2010, American Chemical Society. (e–f) SEM images of (e) an annealed solvent-exfoliated graphene (SEG)/P25 TiO2 nanocomposite and (f) an annealed solvent-reduced graphene oxide (SRGO)/P25 TiO2nanocomposite. Parts (e) and (f) reproduced with permission from Reference Reference Liang, Vijayan, Gray and Hersam145. ©2011, American Chemical Society.

Conclusions and perspective
Solution-processing techniques have helped graphene-based research proliferate because they provide relatively straightforward access to large quantities of graphene, thus enabling widespread exploration of graphene materials and composites in fundamental studies and application development. Various solution methods have emerged for scalable exfoliation of graphite to graphene, including aqueous surfactant, solvent, and electrochemical exfoliation of graphene in addition to oxidation/reduction graphene oxide/reduced graphene oxide pathways. Because each of these methods involves tradeoffs in the quality and size of graphene sheets, processing time, and yield, the choice of graphene dispersion method is often dictated by the needs of the specific experiment or application. After being dispersed in the solution phase, graphene can be straightforwardly integrated with a variety of polymer and/or nanomaterial solutions, providing vast opportunities for the synthesis and testing of graphene-based composites. These composites are already impacting numerous applications, including electronics, biomedical devices, and energy conversion and storage technologies.
Despite the rapid progress and many accomplishments in this field, important challenges remain for solution-processed graphene. Because many graphene properties depend on the size and number of graphene layers, methods for better control of the monodispersity of these parameters are needed. In addition, solution-phase processing techniques typically yield graphene flakes with relatively small lateral sizes (less than 100 μm2) despite the advantages that larger flakes have in high-performance applications (e.g., electronics). Methods for directly controlling or postsynthetically selecting the number of graphene layers also remain of high interest. In this regard, intercalation methodsReference Shih, Vijayaraghavan, Krishnan, Sharma, Han, Ham, Jin, Lin, Paulus, Reuel, Wang, Blankschtein and Strano71 show promise and will likely be the subject of future efforts in this field.
Another emerging challenge is the direct solution-phase exfoliation or synthesis of graphene nanoribbonsReference Lu, Yang, Wang, Lim, Wang and Loh146, Reference Ling, Setzler, Lin, Dhindsa, Jin, Yoon, Kim, Cheng, Widjaja and Zhou147 with tunable widths, which are of interest because of their potential applicability in digital electronics. Similarly, biomedical applications of grapheneReference Patil, Vickery, Scott and Mann148, Reference Zhang, Xia, Zhao, Liu and Zhang149 are in their infancy but are expected to expand as methods emerge to improve the biocompatibility of graphene dispersions.Reference Duch, Budinger, Liang, Soberanes, Urich, Chiarella, Campochiaro, Gonzalez, Chandel, Hersam and Mutlu150 Finally, practical issues including throughput, yield, and cost will require continual attention and innovation as graphene materials and composites transition from research laboratories to nascent industrial-scale applications.
Acknowledgments
This work was supported by the Center for Electrical Energy Storage, an Energy Frontier Research Center funded by the US Department of Energy, Office of Science, Office of Basic Energy Sciences (Award DE-AC02-06CH11357).