


The rhetorical questioning of the possible sound of an unobserved “tree falling in a forest” is a common thought experiment that has raised philosophical questions for decades. From a pragmatic perspective, however, the tree indeed will make a sound which simply occurs unrecorded. It is possible—in principle—to observe the signal. Similarly, the constant vibration of molecules at the nanoscale[Reference Wilson, Cross and Decius1] can be considered largely overlooked signals, occurring without any direct observance or recording. However, these vibrational frequencies can be exploited—we frequently make use of vibrational signatures to identify molecular structures via X-ray diffraction,[Reference Chapman, Fromme, Barty, White, Kirian, Aquila, Hunter, Schulz, DePonte, Weierstall, Doak, Maia, Martin, Schlichting, Lomb, Coppola, Shoeman, Epp, Hartmann, Rolles, Rudenko, Foucar, Kimmel, Weidenspointner, Holl, Liang, Barthelmess, Caleman, Boutet, Bogan, Krzywinski, Bostedt, Bajt, Gumprecht, Rudek, Erk, Schmidt, Homke, Reich, Pietschner, Struder, Hauser, Gorke, Ullrich, Herrmann, Schaller, Schopper, Soltau, Kuhnel, Messerschmidt, Bozek, Hau-Riege, Frank, Hampton, Sierra, Starodub, Williams, Hajdu, Timneanu, Seibert, Andreasson, Rocker, Jonsson, Svenda, Stern, Nass, Andritschke, Schroter, Krasniqi, Bott, Schmidt, Wang, Grotjohann, Holton, Barends, Neutze, Marchesini, Fromme, Schorb, Rupp, Adolph, Gorkhover, Andersson, Hirsemann, Potdevin, Graafsma, Nilsson and Spence2] for example. Understanding and potential manipulation of these signals—effectively the vibration of a molecule—can be beneficial in the field of tera- and gigahertz sensor technology.[Reference Debus and Bolivar3–Reference Ferguson and Zhang6] The interest in biosensors and terahertz technology is increasing in the field of nanotechnology due to the comparable scale between nanostructures and biomolecules and their large range of applications.[Reference Chartuprayoon, Zhang, Bosze, Choa and Myung7] One simply desires a nanoscale system with tunable vibrational frequencies. In particular, one-dimensional (1D) nanostructures demonstrate promising qualities for these technologies due to their high surface area, reliability, and fast electron transport properties.[Reference Chenoweth, van Duin and Goddard8, Reference Liu, Artyukhov, Lee, Xu and Yakobson9]
At the macroscale, there is a common instrument that utilizes such 1D elements (strings) and can precisely manipulate changes in vibrational frequency—a guitar. Anyone who has played a guitar knows that small changes in string tension (winding the tuners) produce a recognizable change in a string's pitch, related to the length and mass of the guitar string. We want to shrink the scale of this physics to the molecular scale and ask: Can molecular strings produce musical notes?
An ideal molecular string candidate is carbyne.[Reference Liu, Artyukhov, Lee, Xu and Yakobson9–Reference Kocsis, Yedama and Cranford11] Carbyne, or linear acetylene, is a 1D allotrope of sp-hybridized carbon atoms.[Reference Jones and Seifert12] It may take a cumulene [(=C=)] repeating double bond form or a polyyne form with alternating single and triple bonds [–(C≡C)–; see Fig. 1(a)], which has been determined to be more energetically favorable.[Reference Liu, Artyukhov, Lee, Xu and Yakobson9] Although carbyne typically demonstrates conductive behavior, it can also demonstrate semi-conductive behavior when subject to torsion.[Reference Liu, Artyukhov, Lee, Xu and Yakobson9] Thus, it can be treated as a semi-conducting string or nanowire, due to its structure and adjustable electrical properties, and it has many potential applications. Experimentally, short carbyne segments have been successfully synthesized,[Reference Chalifoux and Tykwinski13] stabilized with heavy molecular endgroups, or observed bridging sections of graphene.[Reference Jin, Lan, Peng, Suenaga and Iijima14, Reference Chuvilin, Meyer, Algara-Siller and Kaiser15]
Vibrational response of a carbyne chain. (a) Molecular structure of carbyne—a 1D monoatomistic chain of carbon atoms with a repeating polyyne structure (alternating single/triple carbon bonds); a representative atomistic model of carbyne (20 atoms) is also depicted. (b) Simulation snapshots of carbyne chain under free vibration (fixed ends). The displacement, Δ, of a central atom is recorded over time. (c) Plot of vibrational displacement versus time, displaying a repeating sinusoidal-like response. (d) Plot of FFT analysis results (amplitude versus frequency spectrum) to determine dominant, fundamental frequency, f 0. The recorded frequency (315.3 GHz) depicted is equivalent to a D note.

Here, we look to investigate the extent in which the vibrational frequency of carbyne can be predicted and controlled, and its sensitivity due to length. We first consider a single carbyne chain akin to a single nanoscale guitar string as a model system [Fig. 1(b)]. The finite length of carbyne is subject to a specific strain or pre-tension (similar to tuning a guitar) and then subject to vibration by mechanical “plucking”. Using full atomistic molecular dynamics (MD) simulations, we record the displacement time history during vibration [Fig. 1(c)], which can be used to determine the frequency of a specific carbyne chain [Fig. 1(d)]. We demonstrate that different frequencies can be produced and compared with a standard musical scale across an octave, by nominally adjusting the strain and chain length of the carbon chain.
Guitar string model
The ability to explore micro-tonality and segue between pitches in a continuous manner is one element of guitar playing that sets it apart from other popular instruments (such as the piano) where pitch is discrete.[Reference Grimes16] It is also this characteristic that makes a desirable sensor or signaling device—the ability to access a wide range of vibrational responses. From a physical perspective, the basic vibration of strings has been well studied for centuries and can be captured by the 1D wave equation,
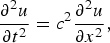 $$\displaystyle{{{\partial ^2}u} \over {\partial {t^2}}} = {c^2}\displaystyle{{{\partial ^2}u} \over {\partial {x^2}}},$$
where u = u(t, x) is the displacement of the string at position x, for a time, t, and c = (T/μ)1/2, T is the tensile force in the string and μ the linear density (mass per length, or m/L). This is the form of the wave equation which applies to a stretched string (extended in the x-direction) or a plane electromagnetic wave. The solution u = Asin[(π/λ)(x ± vt)]) for a standing wave (where A is a constant and λ the wavelength) results in:
 $$v = c = {(T/\mu )^{{1 / 2}}}.$$
In order for the above standing wave equation to apply to the waves in a string, it must meet certain constraints. Carbyne chains provide an approximate system for these constraints. Specifically, for an ideal string, it is assumed that the string is perfectly uniform with a constant mass per unit length. The carbon atoms in carbyne provide discrete mass, but are uniformly spaced, resulting in constant mass per unit length assuming multiple bonds. It is also assumed the string is perfectly elastic with no resistance to bending. Carbyne chains are semi-flexible with non-negligible bending rigidity. However, relative to their axial stiffness, carbyne is considered highly compliant, akin to a cable as opposed to a rod. Finally, during vibration, small segments of the string are presumed to move transversely in a plane perpendicular to the string, and the displacements and slopes of segments of the string are assumed to be small. This condition can be met by limiting the initial excitation of the carbyne strings. Though stringent, these idealizations permit the development of a wave equation, which describes well the vibrations of thin real strings.
We note that the frequency of vibration, f, is related to the velocity by the wavelength, where v = λf. The lowest frequency mode for a stretched string, called the fundamental frequency, f 0, occurs when the wavelength is equal to twice the length, or λ = 2L. The fundamental frequency of a “stretched” string is thus derived from the 1D wave equation and is defined as:
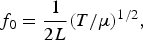 $${\,f_0} = \displaystyle{1 \over {2L}}{(T/\mu )^{{1 / 2}}},$$
where L is the length of the string, T is the string tension, and μ is the mass per unit length of the string.[Reference Grimes16] By manipulating this equation, it is clear that f 02 must be proportional to F and also to L −1, if the mass of the string is assumed to be constant. Equation (3) provides the basis of frequency prediction given either a chain of length, L, or known tension, T.
Single-chain vibration
First, we delineate the accessible frequency range of a single carbyne chain (see Methods section for simulation details). After energy minimization is imposed on the system, and the carbyne chain is strained to the appropriate value, a central atom is plucked, inducing free vibration (note the plucking increases the strain in the chain by ε = secα−1, where α ≈ 2Δ/L, with L being the length of the chain and Δ the plucked distance). The dominant standing wave will correspond to the fundamental frequency, f 0, of the system. During vibration, the vertical displacement of a single atom is tracked, and displacement versus time results are produced. Fourier analysis is then used to extract the frequency content. Carbyne chains of lengths 44, 65, 88, and 130 Å are systematically strained from ε = 0 to its maximum strain value, which occurred at 11–12% strain for each chain length. This maximum strain was determined by increasing the strain percentage by 1% increments until the chain lost stability upon plucking (note that, under pure axial tension, the ultimate strain of carbyne is approximately 18%[Reference Kocsis, Yedama and Cranford11]). Thus, the vibrational response is limited to approximately 10% strain. The frequencies as a function of strain are plotted in Fig. 2(a), encompassing a range from 156.1 to 762.8 GHz.
Accessible frequency range and model behavior. (a) Frequency variation as a function of applied strain (ε) for carbyne chains of varying length (L = 44, 65, 88, and 130 Å). Frequency response is nonlinear due to the nonlinear stress–strain behavior of carbyne. All chains fail with strain exceeding 12%. The frequencies encompass a range from 156.1 to 762.8 GHz. Shaded region indicates required frequency range for C major scale. (b) Frequency-squared (f 2) versus applied tension (T) to confirm ideal string model [Eq. (3)] with constant chain lengths. Equivalent musical notes indicated on plot. (c) Frequency-squared (f 2) versus inverse-length (1/L) to confirm ideal string model [Eq. (3)] with constant applied tension. For both (b) and (c) the linear trends support the theoretical model.
Although the range of vibrational frequencies is useful from a sensing or signal detection perspective, we wish to manipulate the signal to produce common musical notes—in effect translating the vibrations to an audible “language”. Musical notes are defined and ordered according to their pitch. Pitch may be quantified as a frequency, but it is not a purely objective physical property—pitch is a perceptual property that allows the ordering of sounds on a frequency-related scale.[Reference Klapuri and Davy17] Pitch and frequency are related by a standard, a convention to assemble notes in relative harmony/tuning. Here, we considered the most common standard pitch used for modern tuning where the A above middle C is usually set at 440 Hz. The note A is then set as a reference note, with other notes being set relative to it. Moreover, we wish to extend our note set across a complete octave or scale. A musical scale represents a division of the frequency space into a certain number of scale steps, such that the scale bridges the interval between one musical pitch and another with half or double its frequency. Thus, if 440 Hz is an A, 880 Hz is also an A one octave higher, whereas 220 Hz is an A one octave lower. A specific scale is defined by its characteristic interval pattern and by a special note, known as its first tonic—here chosen as C. Thus, we produce the C major scale consisting of the pitches C, D, E, F, G, A, and B. Since these frequency definitions are on the scale of Hz, while our carbyne frequencies are on the scale of GHz, we must convert the octaves by scaling by powers of 2n. For the frequency range delineated by carbyne vibration, n = 30. The standard pitch and converted pitch frequencies for our C major scale are listed in Table 1. From the desired frequencies, we use the vibrational responses [Fig. 2(a)] to reverse engineer the required carbyne chain length (L) and applied prestrain (ε i) to produce a desired note. The frequency of carbyne is within 2% of the actual frequency of each note in the musical scale. We note that no single chain can bridge an entire octave, necessitating changes in length.
Musical Scale (C major scale; standard pitch of A = 440 Hz) and frequency values as a result of the MD simulations involving carbyne chains of length, L = 44, 65, and 88 Å with varying strain values. Note: shaded values not standard notes in C major scale.
From these results, we further confirm the theoretical correlation between both frequency and length and frequency and applied tension, as per Eq. (3), as the carbyne chain did not strictly meet the assumptions of an ideal string. First, we inspect the effect of tension. While strain increments were used here to vary frequency (similar to a guitars tuning pegs), a given strain corresponds to a single tension force in a nonlinear relation. The force–strain relation was determined in a recent previous study using the same MD potential (ReaxFF) implemented here.[Reference Kocsis, Yedama and Cranford11] Thus, the frequency-strain relation can be easily converted to a frequency–tension relation, for the three chains of constant lengths [Fig. 2(b)]. A linear relation between f 2 and T indicates the proportionality predicted by Eq. (3). It is clear that these values are directly proportional due to the close linear fit of all values (with a statistical coefficient of determination of R 2 > 0.951). Next, we inspect the effect of length by grouping the chains of varying length when subject to the same strain/tension. The square of the frequency is plotted against L −1 for varying strain values of 0%–8% [see Fig. 2(c)]. These values again demonstrate direct proportionality due to the close linear fit demonstrated by a high coefficient of determination (R 2 > 0.968). Owing to these relationships, we concluded carbyne can be accurately modeled as a vibrating string, akin to a “stretched” guitar string.
Finally, we use the displacement-time output of our simulations to produce audible tones and simulated “molecular music”. Each displacement history can be thought of as representing a sound wave. Upon scaling to audible octaves, the signal can easily be output as an audio file for individual notes (see Supplementary Audio Files #1–#12) or a scale (see Supplementary Audio File #13), or combined for a short melody (see Supplementary Audio File #14).
Sensitivity and sensing resolution
The last decade has produced a variety of activities in the measurement of small forces, which has become a demand of nanotechnology. At small scales, forces can only be detected indirectly using basic physics principles, which are key to nanoscale designs. This work can have significant impact on the development of nanoscale devices, for detection or signaling. Even the smallest strain detectors are on the scale of hundreds of nanometers—here, we propose using a system that is only a single atom thick! Per Table 1, it is clear that the three chain lengths, L = 44, 65, 88 Å, each have very sensitive frequency values. Sensitivity can be as small as 0.12% strain per half note (e.g., A# → B) and 0.36% strain per whole note (e.g., A → B). Converting to force, these strains correspond to tensile loads of the order of 0.5 nN/note (more accurate approximation is limited by the nonlinear behavior of carbyne; e.g. the force increment depends on the total strain, not just strain increment). Moreover, the strains are associated with a displacement of the order of a few picometers (10−12 m) per note. Also, by adjusting the chain length by three-quarters or half of the longest chain length, the frequency changes by a half note or more [see Fig. 2(a)], indicating that these resolution ranges can be manipulated by variation in initial chain length.
From notes to chords
Finally, we extend the system to multiple chains, to explore the possibility of more complex signal generation. In music, a harmonic set of three or more notes that is heard simultaneously is known as a chord. Major chords are formed with the frequencies of three notes that are in a ratio of 4:5:6 with each other, the lowest frequency being called the root. A fundamental beat frequency associated with a chord can be determined by looking at the repeat period—that is, for the frequency ratio given (which is reduced to the lowest possible integer values), the repeat period for the major chord is four times the period of the lowest note in the chord. Or, in other words, the chord has a beat frequency of one-quarter the root note. If you listen carefully, the beat frequency is audible as an additional unplayed note. In effect, there is an undertone frequency produced due to the superposition of the waves.
In our system, by combining three carbyne chains of different frequencies, carbyne can output such a beat frequency and a chord. Plucking three carbyne chains of different frequency or note value can be compared with strumming a chord on the guitar or playing three harmonic notes simultaneously. By combining the notes C (280 GHz), E (352 GHz), and G (420 GHz), we can create a C Major chord (e.g., C is the root; a beat frequency of ~70 GHz, which itself is a C). This chord can be achieved by combining the three-carbyne chains representing these notes (see Supplementary Audio File #15). Combining these three frequencies can help us create a major triad, while also demonstrating the flexibility and applications that carbyne has to offer in the nanotechnology field (see Fig. 3). Once again, like a guitar can produce thousands of note and chord combinations, a limited number of carbyne “strings” can be used in unison for highly complex vibrational responses.
Multiple chain carbyne chords. (a) Simulating three chains with different prescribed prestrains (ε i) results in three different vibrational frequencies (f i). (b) The individual responses related to individual notes (C, E, and G). (c) Superposition of the waveforms results in a chord—a harmonic set of notes that is heard as a single tone. Here, the C maj chord is presented, where the necessary frequencies are in a ratio of 4:5:6 and the lowest frequency note (root) is a C. Such combinations further extend the accessible signaling regime of vibrating carbyne, similar to the many possible notes/tones achievable on a six-string guitar.
Conclusion
While nanotechnology and music are not two subjects that typically share commonalities, combining these two fields presents a unique approach to understanding carbyne when it its subject to external tension and left to vibrate. By comparing carbyne's frequencies to an audible scale, the frequency sensitivity is more easily determined, and carbyne's additional benefits as a nanostructure can be appreciated.
By likening carbyne to a guitar string and modeling as a simple string in tension, we can look to understand the benefits of utilizing carbyne as a sensor or terahertz detector. Carbyne has strong frequency sensitivity when strained at different percentages or fixed to different chain lengths. With frequencies close to the THz time domain and carbyne's high surface area and fast electron transport, carbyne could be a new interest in 1D nanostructure sensors. Utilizing carbyne can present new research opportunities in the field of agriculture, pharmaceutical research, spectroscopy, bio-terrorism, and genomic studies.[Reference Chartuprayoon, Zhang, Bosze, Choa and Myung7, Reference He, Fujimura, Lloyd, Erickson, Talin, Zhang, Gao, Jiang, Kawano, Hauge, Léonard and Kono18] Moreover, the string itself can carry an electrical signal, has a tunable band gap, and is relatively stable/stiff/strong in comparison with other materials. A purely 1D material can act as an efficient molecular “wire” and can be easily integrated into existing micro and nanoscale systems.
The primary goal of this study was to determine the accessible frequency range of carbyne. This will indicate the potential applications. We note that the musical platform is arbitrary and merely provides a demonstration of the ability to tune the vibrational frequency. We do not envision nanoscale Fender guitars. We can further expand the vibrational frequency range by combining carbyne strings and other molecules to produce molecular “chords” (e.g., any harmonic set of three or more notes that is heard as if sounding simultaneously). Sensitivity to molecular changes is key to produce a sensor with high fidelity. Vibration based biosensors, for example, utilize the biomolecule's mass to shift the frequency of the nanostructure.[Reference Chowdhury, Adhikari and Mitchell19] By determining the frequency of the 1D carbyne, we can determine its sensitivity to other molecules and demonstrate its function as a biosensor, force transducer, or signaling device. Ultimately, we wish to set out the design rules and performance limits for this new “instrument” and compose our own desired “music”.
Methods
Atomistic simulations
All simulations are implemented by the molecular dynamics (MD) software package LAMMPS (http://lammps.sandia.gov/).[Reference Cranford, Buehler, Hull, Jagadish, Osgood, Parisi and Wang20] Visualization is carried out using the VMD visualization package.[Reference Humphrey, Dalke and Schulten22] The carbon–carbon interactions are calculated via MD with first principles-based ReaxFF force field.[Reference Chenoweth, van Duin and Goddard8] ReaxFF imitates the local chemical environment to allow dynamic alterations to the molecular and atomistic interactions,[Reference Cranford, Buehler, Hull, Jagadish, Osgood, Parisi and Wang20] and has been shown to replicate the mechanical properties of carbyne.[Reference Nair, Cranford and Buehler10, Reference Kocsis, Yedama and Cranford11, Reference Cranford21] First, carbyne chains of varying length and strain are simulated individually to systematically explore the accessible frequency space and determine the required system details to output each frequency on the musical scale. A 100 carbon atom (L = 13 nm), 68 carbon atom (8.8 nm), 50 carbon atom (6.5 nm), and a 34 carbon atom (4.4 nm) chain are subject to energy minimization (conjugate gradient algorithm as implemented in LAMMPS with an energy tolerance of 10−6 kcal/mol), then briefly equilibrated under a microcanonical (NVE) ensemble with maximum distance limit of 0.05 Å to attain an initial structure. Each structure is subject to a brief period of finite temperature (100 K) equilibrium prior to applied tension. Each system is strained axially under a canonical (NVT) ensemble, timestep 0.2 × 10⁻¹⁵ s at a temperature of 100 K with an axial strain rate of approximately 0.1 × 10⁻⁶/fs.
After being strained, the carbyne chain is “plucked” a distance of 10, 6.8, 5, and 3.4 Å for the 100, 68, 50, and 34 carbon chains, respectively, and it is held for 1.0 × 10⁻¹⁰ s. “Plucking” occurs by moving the central atom of each carbon chain a respective distance under a similar NVT ensemble as straining but with a temperature of 100 K for all carbon atom chain lengths. The chain is then released and left to vibrate for 5.0 × 10⁻¹⁰ s. The output of the LAMMPS simulation is the displacement of the central atom during vibration.
Frequency calculation/note conversion/audio output
The fundamental frequency of each chain is determined utilizing a Fast Fourier Transform (FFT) of the displacement results in Matlab. The frequencies of each chain are compared with the musical scale, and the required chain length and strain combination for each note in the musical scale is determined by interpolation. The .wav file is created in Matlab from the displacement results. To ensure the sound files are in the audible regime, the sample rate is scaled by 230.
Chord response
To simulate a molecular “chord”, three carbyne chains are spaced 15 Å apart and plucked simultaneously away from each other in the z-direction to simulate a guitar chord. A C Major is simulated by combining C, E, and G notes. Each chain represents a different note in the chord, and has a different chain length and strain combination. The z displacements of each chain are combined, the frequency is determined, and the .wav file is created in Matlab.
Supplementary materials
For supplementary material for this article, please visit http://dx.doi.org/10.1557/mrc.2015.9
Acknowledgments
A.J.K. and S.W.C. acknowledge generous support from NEU's CEE Department. S.W.C. also wishes to thank James Hurley and Mark Belbin for fruitful musical discussion. The calculations and the analysis were carried out using a parallel LINUX cluster at NEU's Laboratory for Nanotechnology In Civil Engineering (NICE).





