


The mechanical behavior at nano/microscale has been a subject of considerable interest in both the physical and biological sciences. The interest has been sparked by continued progress in the miniaturization of components for microelectronic applications,[Reference Khatibi, Betzwar-Kotas, GrÖGer and Weiss1, Reference Danaher, Williams, Singh, Jiang and Chawla2] synthesis of nanostructured materials for biomedical scaffolds,[Reference Ma, Kotaki, Inai and Ramakrishna3, Reference Leung and Ko4] as well as the recognition that many biological tissues and fibers exhibit superlative mechanical performance.[Reference Hayashi, Shipley and Lewis5–Reference Meyers, Chen, Lin and Seki7] A good example is the sustained effort in characterizing, synthesizing, and understanding the behavior of spider silks, many of which are stronger than steel and exhibits higher toughness than Kevlar.[Reference Termonia8, Reference Vollrath9] Fabrication of nano- and microfibers with similar properties has also showed promise in biomedical and composite applications.
Mechanical characterization of materials at nano/microscale presents significant challenges due to the small forces and extensions that must be applied and measured. Some of the challenges have been addressed with recent advances in depth-sensing nanoindentation technique, and in situ deformation studies inside an electron microscope. Quasi-static tensile mechanical properties of fibers with less than a few 10's of μm in diameter have also been reported in literature.[Reference Tan, Ng and Lim10–Reference Lechat, Bunsell, Davies and Piant12] However, the challenge is slightly different for soft and ductile materials in the form of small diameter fibers—below 100 µm—which require extremely small forces but can sustain large amounts of strain. In addition, polymeric and biological fibers often exhibit strain-dependent or time-dependent properties, leading to difficulties in interpreting their mechanical properties by conventional techniques. Unlike metals and ceramics, mechanical deformation in polymeric materials involves evolution of the molecular network.[Reference Schultz13] The fundamental changes in the molecular structure have been observed through in situ x-ray diffraction and other spectroscopic methods.[Reference Toki, Fujimaki and Okuyama14–Reference Washer, Brooks and Saulsberry16] However, very little quantitative information is available on how the evolution of the structure of polymer chains affects the mechanical properties of the material. Herein, we describe a novel nanomechanical tensile testing methodology, called continuous dynamic analysis (CDA) that not only provides accurate measures of quasi-static properties, but also determines the dynamic storage and loss moduli as a continuous function of strain.
Conventional tensile tests extend a fiber at a certain rate and measure the uniaxial stress as a function of strain. The true stress and true strain in a fiber sample can be represented as:
 $$\sigma = \displaystyle{F \over A}$$
and
 $$\varepsilon = \ln \displaystyle{{{L_f}} \over {{L_i}}}\comma$$
where, F is the applied force, A is the instantaneous cross-sectional area, L f is the extended length, and L i is the initial gage length of the fiber. The initial part of the true stress–true strain plot is linear and the slope represents the Young's modulus. The various other parameters that can be calculated from a quasi-static tensile test include yield stress, failure stress, failure strain, and toughness.
On the other hand, dynamic mechanical analysis applies a harmonic force (F 0) on a fiber specimen. The measurement of the resulting harmonic displacement (z 0) and the phase lag (δ) makes it possible to calculate the elastic properties, such as storage and loss moduli, dynamically. The storage modulus, E′, and the loss modulus, E″, is given by,
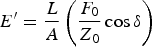 $${E^{\prime}} = \displaystyle{L \over A} \left(\displaystyle{{{F_0}} \over {{Z_0}}}\cos \delta \right)$$
and
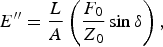 $${E^{\prime \prime}} = \displaystyle{L \over A} \left(\displaystyle{{{F_0}} \over {{Z_0}}}\sin \delta \right)\comma$$
where, L and A are the instantaneous length and cross-sectional area of the fiber. The loss factor, or tan δ, can be written as:
 $$\tan \delta = \displaystyle{E^{\prime \prime} \over E^{\prime}}.$$
Most ceramics and metals do not exhibit significant damping during their deformation. Hence, for such materials, the loss modulus becomes negligible and the storage modulus becomes almost identical to the Young's modulus measured from quasi-static experiments. The storage modulus is often referred to as “dynamic modulus” for non-damping materials. The dynamic characterization method is specifically advantageous for polymeric and biological materials, which exhibit viscoelastic behavior. However, the drawback of a conventional dynamic mechanical analysis is that it is performed when the fiber deformation is constant at extremely small strains, to ensure linear viscoelasticity. Hence, conventional dynamic mechanical analysis cannot capture the effect on the mechanical properties of changes in the molecular structure due to applied strain.[Reference Lechat, Bunsell, Davies and Piant12, Reference Toki, Fujimaki and Okuyama14, Reference Ran, Fang, Zong, Hsiao, Chu and Cunniff15, Reference Cranford, Tarakanova, Pugno and Buehler17]
The CDA combines the advantages of dynamic mechanical analysis with those of quasi-static tensile test, to generate a more thorough picture of mechanical properties and their evolution as a continuous function of strain. The CDA measures the dynamic properties from extremely small harmonic force modulation, applied throughout a tensile test. It is important to note here that the resulting harmonic strain is independent of and much smaller in magnitude than the applied quasi-static strain. The nanomechanical approach that is at the heart of the CDA measurement, using the Agilent T150 UTM, ensures that the harmonic oscillatory strain stays in the linear viscoelastic (LVE) regime, even if the quasi-static strain is much larger and often in the nonlinear regime. Thus, the dynamic storage and loss modulus are calculated at every point during the tensile test. The details of the dynamic model for the nanomechanical actuating transducer (NMAT), which was first developed to be used in a nanoindenter, have been discussed elsewhere.[Reference Oliver and Pethica18, Reference Hay, Agee and Herbert19] In the following sections, we discuss the CDA results obtained for small-diameter metal wires and individual filaments of polymeric fibers.
Tensile tests with CDA were carried out on single wires of copper, tungsten, and gold, single filaments of polyethylene terephthalate (PET), and individual strands of Argiope spider dragline silk. These materials are chosen because of their popularity and importance in the electronics, structural, and biomedical applications. At least three samples were tested for each different material, with nominal gage lengths between 30 and 40 mm. The tests were performed at a strain rate of 1 × 10⁻³ per second up to failure. For the CDA measurements, a small harmonic force of 4.5 mN was applied through the NMAT, and the resulting harmonic displacement on the fiber was measured throughout the test. Note that the resulting harmonic strain was much lower than the LVE limit (~0.1%) in order to calculate the dynamic storage and loss moduli. This is important especially for the PET and silk fibers. For example, the maximum harmonic displacement observed for a 30 mm PET fiber was only ~9 µm even with the maximum applied harmonic force (4.5 mN) on the NMAT, which puts the harmonic strain well within the LVE regime. These small harmonic strains were possible because of the nanomechanical force sensing capability of the NMAT. The harmonic frequency for measuring the dynamic storage and loss modulus was 20 Hz. The harmonic frequency was selected close to the resonance frequency of the force transducer to obtain the best possible resolution in the harmonic displacement measurement. As frequency and temperature are known to influence viscoelastic properties, especially of polymeric fibers, these parameters were kept constant for all the tests discussed here to focus on the influence of quasi-static strain on the evolution of viscoelastic properties. However, it is acknowledged that further studies are needed, especially for polymer fibers, to determine the combined effects of strain, frequency, and temperature.
The tensile true stress–true strain curves for different metal wires are shown in Fig. 1(a). The diameters of the wires are mentioned in the figure. It is important to note that the small amplitude of harmonic force for the CDA measurement does not affect the quasi-static tensile deformation behavior. The stress–strain curve clearly exhibits the linear elastic regime, followed by yielding and plastic deformation. The Young's modulus of the metal wires, as measured from the slope of the initial elastic regime matches very well with the previously reported values from quasi-static measurements of same, however dimensionally larger, materials. As measured from the slope of the stress–strain curves in our experiments, the Young's modulus for the high purity hardened tungsten wire is 403 ± 6 GPa, for pure copper wire it is 124 ± 8 GPa, and for high purity gold wire the measured Young's modulus is 81 ± 1 GPa.
(a) Quasi-static tensile stress–strain response of tungsten and gold microwires. The response of copper microwire is shown in the inset as it deformed to larger strains compared with other microwires. (b) CDA during the tensile tests shown in (a). Note the constant nature of the dynamic modulus over the range of strain, as expected from dislocation based plastic deformation.

Figure 1(b) shows the CDA measurement of the dynamic modulus for the metal wires plotted as a function of increasing strain. The initial increase in the dynamic modulus [up to a strain of ~0.001 in Fig. 1(b)] is a measurement artifact, most likely due to a discrepancy between the harmonic displacement and the specimen extension during the initial part of the deformation. After this brief regime, the storage modulus becomes almost constant, even for stresses higher than the yield stress. As expected, the dislocation-based plastic deformation did not change the elastic properties of the metal wires, and the dynamic modulus for tungsten, copper, and gold wires remained constant throughout the complete tensile deformation. It is important to note that the dynamic modulus is in good agreement with the Young's moduli mentioned above. This finding also supports the fact that the small deformation that is caused by the CDA harmonic force produce only linear elastic deformation, and validates the dynamic modulus measurements from the CDA. It may be hard to visualize the advantage of using CDA over quasi-static tensile method for metal wires; however, in many ductile metal wires where plasticity comes into play at an early stage of deformation, the CDA provides an excellent means to measure the elastic properties irrespective of the quasi-static strain.
The advantages of a CDA measurement become more apparent while characterizing the tensile behavior of polymer fibers. Figure 2(a) represents a typical true stress–true strain curve for an individual PET fiber (monofilament) of 17 µm diameter. The polymer chains in this thermoplastic fiber are distributed in crystalline and amorphous regions. Depending on the draw ratio during manufacturing, a fraction of the crystalline microfibrils is oriented along the fiber axis, and these crystalline regions are connected by amorphous chains. The different regimes observed in the tensile stress–strain curve [Fig. 2(a)] can be explained by the deformation of these different microstructural regions. First there is a homogeneous elastic deformation, giving rise to the linear part in the beginning. The curve starts to diverge from linearity when the amorphous chains between the crystalline microfibrils start to align themselves in the similar orientation as the crystalline domains along the fiber axis.[Reference Schultz13] The stress–strain curve goes through another point of inflexion when the applied load starts to strain the bonds in both amorphous and crystalline phases simultaneously, resulting in higher stiffness. The final part of the curve represents slippage between the oriented microfibrils.[Reference Lechat, Bunsell, Davies and Piant12]
(a) Stress–strain curve showing different deformation regimes during tensile deformation of an individual PET filament. The schematics show how the alignment of crystalline, and amorphous, regions in the filament increases with the increasing strain. (b) The changes in dynamic storage modulus and loss factor as a continuous function of strain. Note that the value of dynamic storage modulus at small strains (below ~0.02) agrees well with the Young's modulus measured from the stress–strain curve in (a).
The measured Young's modulus from the slope of the initial part of the stress–strain curve is 10.1 ± 0.5 GPa, and it agrees well with the modulus values reported in literature.[Reference Lechat, Bunsell, Davies and Piant12] However, in light of the change in the orientation of molecules during the deformation of the PET fiber, the following question arises. Does the reported Young's modulus truly represent the elastic properties after significant deformation of the fiber? The answer becomes clear from the CDA measurement of the dynamic storage modulus and loss factor, as shown in Fig. 2(b). Initially, the dynamic storage modulus value is consistent with the Young's modulus measurement. Soon after, the dynamic storage modulus shows a slight drop in magnitude [vertical arrow in Fig. 2(b)] before the yield occurs [Fig. 2(a)]. This phenomenon has not been observed for any of the metal wires characterized during this study, and hence it is not an artifact of the measurement. One possible conjecture is that, in this regime, the amorphous molecules undergo unfolding, which decreases the effective stiffness of the fiber. However, this is the first time this behavior is measured using the CDA, and future in situ structural characterizations will shed more light on the exact nature of deformation in this regime. After the yield point, the molecules in both crystalline and amorphous regions become aligned along the fiber axis, resulting in a significant increase in the storage modulus. The same physical mechanism causes the corresponding drop in the loss factor as observed in Fig. 2(b). The mechanism of increase in stiffness with strain in polymeric materials has been qualitatively known for years. That is why polymer fibers are drawn to different ratios during manufacturing to enhance the stiffness. Hence, the importance of a CDA measurement cannot be overemphasized as it can now quantitatively measure the changes in dynamic storage and loss modulus of a polymeric fiber as a continuous function of strain, providing more insight to the fiber drawing process.
The interesting evolution of viscoelastic properties is also observed for the major ampullate (dragline) silk from an Argiope spider. Figure 3(a) shows a typical true stress–true strain response from the CDA experiment. The solid vertical lines in Fig. 3(a) represent the different regimes of deformation that can be correlated to the structural evolution of the semi-crystalline silk strand. Previous experimental and computational studies have shown the changes that occur in the crystalline β-sheets and the amorphous regions during these different deformation regimes.[Reference Cranford, Tarakanova, Pugno and Buehler17] The initial linear region [region I in Fig. 3(a)] corresponds to the homogeneous stretching of amorphous molecules. Region II, where the stress–strain curve starts to deviate from linearity, represents the unfolding of amorphous molecules by breaking the hydrogen bonds. In region III, the amorphous protein chains align with the crystalline β-sheets resulting in the hardening observed. When the aligned chains start to slip past each other in region IV it causes a slight decrease in the slope of the stress–strain curve, and finally results in failure. The small spikes observed in regions III and IV may be related to failure of a small fraction of the aligned molecular chains. Although all the fibers finally failed within the gage section, some slippage of these very small diameter fibers at the grips cannot be ruled out at this moment. An in situ video monitoring, and spectroscopic studies before and after the spikes may reveal more details regarding the microscopic deformation process. Although it distinguishes different regimes of deformation, the quasi-static stress–strain curve does not provide quantitative understanding of how the changes in alignment of protein molecules affect the viscoelastic nature of the silk. Since every species of spider produces silk with different molecular arrangement, information about the evolution of their viscoelastic properties will provide a much more complete understanding of the fundamental physical mechanisms behind the unique mechanical properties of these protein fibers.
(a) True stress versus true strain for tensile deformation of an individual strand of dragline silk from Argiope spider. I, II, III, and IV represent the different regimes of deformation as discussed in the text. (b) CDA during the same test, shown in (a), measures the change in dynamic storage modulus and loss factor as a function of strain. Note that the initial storage modulus is close to the Young's modulus measured from the linear elastic slope in (a).
The changes in storage modulus and loss factor as a function of strain, as measured from the CDA experiment, are shown in Fig. 3(b). It is clearly evident that the viscoelastic properties, corresponding to the different regions marked in Fig. 3(a), are significantly different from each other. The variations in the storage modulus and loss modulus as a function of strain agree well with a previously reported CDA study on Argiope spider silks, performed on the same instrument and using similar method to the one reported here.[Reference Blackledge and Hayashi20] Similar characterization of these fibers is repeated during this study to compare the behavior with other fibers discussed above. In other words, the agreement confirms the reproducibility of the CDA measurements. It is important to note here that the evolution of dynamic mechanical properties with strain is consistent with the molecular structure proposed for these silk fibers. The initial slight increase in the loss modulus [Fig. 3(b)] most likely corresponds to breakage of hydrogen bonds during the yield process, which could potentially lead to viscous flow.[Reference Termonia8, Reference Blackledge and Hayashi20] This comment notwithstanding, in situ spectroscopic study during the CDA test may further the understanding of these deformation mechanisms. As the protein molecules become oriented during further extension, the dynamic storage modulus increases significantly during regions III and IV (Fig. 3), from ~8 GPa to ~40 GPa (a fivefold increase), along with a corresponding drop in the loss factor.
In summary, it is evident from the results discussed above that it is important to characterize the elastic properties of fibers as a continuous function of strain. For ultra-thin metal wires, especially with a low-yield stress, it can provide a more reliable measurement of the elastic modulus irrespective of the applied strain. However, a more elaborate and fundamental application of this unique method will be for polymeric and biological fibrous materials, where the evolution in molecular structure during deformation changes the viscoelastic properties significantly. It is not only important for development of various fiber products with controlled properties, but also provides a fundamental quantitative measurement of the molecular evolution.



