Introduction
Combining the characteristics of electrolysis and plasma discharge, plasma electrolysis (PE) has promising potential in surface engineering.[Reference Belevantsev, Terleeva, Markov, Shulepko, Slonova and Utkin1–Reference Belkin, Pasinkovskii, Tkachenko, Faktarovich and Yulyugin6] During PE, a gas sheath forms around one of the electrodes and discharge occurs due to the ionization in the gas sheath when a high voltage is applied. PE was first studied by Kellogg in 1950. His results showed that the gas sheath was formed due to solvent evaporation in addition to the formation of gas during electrolysis.[Reference Kellogg7] The ionization and plasma-induced chemical reactions were investigated during the 1960s by Hickling and Ingram. Their results suggested that the products of the PE were related to the electrolytes used.[Reference Hickling8, Reference Hickling and Ingram9]
This pioneering work prompted subsequent studies of both the basic science and practical applications of PE.[Reference Sengupta and Singh10–Reference Toriyabe, Watanabe, Yatsu, Shibayama and Mizuno17] The identified main factors that influence the plasma discharge included applied voltage, electrolyte, reactor geometry, electrolyte temperature, and flow dynamics.[Reference Sengupta and Singh11, Reference Sengupta, Srivastava and Singh13–Reference Shih and Locke15] PE could occur on either cathode or anode. PE oxidation, which occurs on the anode, has been widely used to form oxide coatings on metals and alloys in order to enhance their performance such as wear, corrosion, and thermal barrier[Reference Aliofkhazraei, Rouhaghdam and Gupta16]; PE saturation (of the surface with other elements), which occurs on the cathode, has been used for surface cleaning, heat treatment, and deposition of metal and alloy coatings. A common feature of the interactions between the plasma and the working electrode was the formation of micro-/nano-particles and the creation of irregular microstructures in the surface of the solid electrode, either cathode or anode.[Reference Yerokhin, Nie, Leyland, Matthews and Dowey2, Reference Gupta, Tenhundfeld, Daigle and Ryabkov3, Reference Toriyabe, Watanabe, Yatsu, Shibayama and Mizuno17]
Previous studies indicated that the plasma–electrode interaction was due to the implosion of plasma bubbles as a consequence of the cooling of the high-temperature plasma bubbles by its surrounding low-temperature electrolyte solution. This was a physical-reaction dominated process. On the other hand, a plasma emission study confirmed the existence of a variety of chemical species and chemical reactions during PE.[Reference Dunleavy, Golosnoy, Curran and Clyne18] Therefore, multiple chemical and physical reactions were expected to occur, while the chemical reactions on the work surface somehow appeared suppressed and were not well understood.
This work aimed to reveal the role of the chemical reactions in PE. It showed that under certain PE regimes, the physical reactions were completely decoupled or suppressed. As a result, the PE led to anisotropic chemical etching that created highly ordered textured surface. This phenomenon has not been reported before.
Experiment
Figure 1 illustrates the PE experimental setup and the plasma discharge. The PE unit included a 250 mL stainless steel beaker that was grounded as the anode. The beaker diameter was 65 mm and height 80 mm. A mirror polished n-type (100) silicon wafer of 650 µm thickness was positioned at the center of the beaker and connected to a negative DC bias. The wafer size was 6 mm wide and 25 mm long with about 13 mm immersed into the electrolyte solution. The electrolyte solution consisted of sodium bicarbonate, deionized water, and glycerol. The molarity of sodium bicarbonate was 0.05 and 0.03 M. The volume ratio of glycerol to water was varied from 0 to 40:1. The electrolyte solution was heated to 70 °C before the plasma electrolysis was conducted.
PE experimental setup (left) and plasma discharge (right).

The sodium bicarbonate and glycerol used were as received from Fisher Scientific. A DC power supply (Kikusui PAN 600-2A) was used to excite the PE. The maximum current was 1.5 A during PE. A stable plasma was achieved at −400 V DC bias. Under this stable plasma, each sample was treated for 10 s.
The morphology of the silicon samples were characterized using a Hitachi S-3400N scanning electron microscope (SEM) and a Nano-R2 atomic force microscope (AFM, Pacific Nanotechnology Inc.). The total reflectance, including diffused light and specular light, was measured using a Shimadzu UV-2600 spectrophotometer with an integrating sphere. A Horiba LabRam HR Raman Spectrometer was used to verify the crystalline silicon structure before and after the PE processes.
Result and discussion
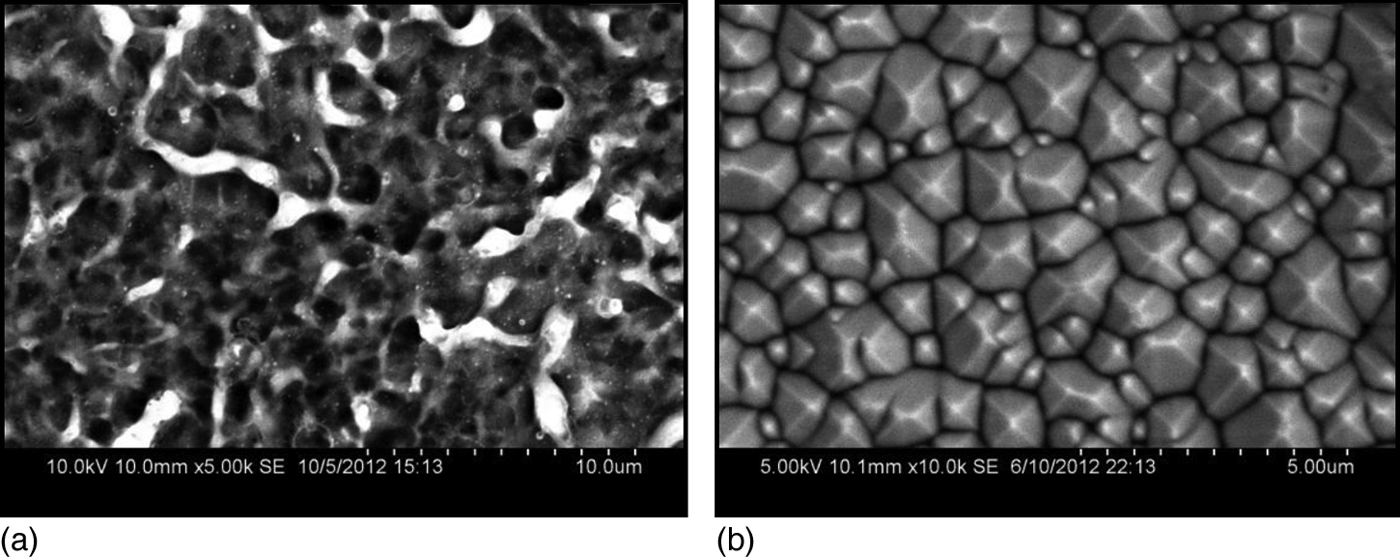
Figure 2(a) shows a typical silicon wafer surface with the nano-/micro-porous structure following PE treatment using the electrolyte solution that had a glycerol/water volume ratio less than 5:1. Once the glycerol/water ratio was increased to over 10:1, the textured surface shown in Fig. 2(b) was obtained. The textured surface was dominated by pyramidal structures. Using PE to generate such kind of ordered texture has not been reported before.
SEM images of (a) porous and (b) textured Si wafer obtained by PE under different process conditions.
It is interesting to note that fully textured surface was achieved with the ratio of glycerol versus water in the range about 10:1 to 24:1. When the ratio was higher than 24:1, the surface of silicon was coated with a layer of carbon. Such materials may have interesting applications (e.g. battery anode) and we are conducting further research to understand the film formation mechanisms.
AFM analysis was performed to quantify the pyramidal structures (Fig. 3). The average height of the pyramids was 839 nm. The angle between the exposed (111) surface (triangle shape) and the (100) plane (taken as the X–Y plane in Fig. 3) was found to be about 52°, which was close to that obtained from anisotropic chemical etching of crystalline silicon.[Reference Campbell and Green19–Reference Ou, Zhao, Diao, Zhang and Wang21] These results implied that the chemical reactions dominated the PE process under certain conditions.
AFM image of textured Si wafer obtained by PE.
Raman spectra of the textured surface, porous surface, and the as-received crystalline Si wafer are shown in Fig. 4. The spectra of all the three samples had the characteristic silicon peak at ~520 cm−1, which is the energy of the first-order Raman optical phonon with symmetry Γ25′ at the Brillouin-zone center.[Reference Russell22] The Raman spectra confirmed that both the porous and the textured silicon surfaces created by the PE conserved the silicon crystalline structure. Detailed analysis showed that the Raman peak of the textured surface shifted to the left slightly compared with the as-received wafer. This peak shift implied an effect of lattice relaxation, most possibly due to the creation of the larger surface area. It is interesting to note that the textured silicon produced a more intensive Raman scattering than the as-received mirror polished wafer. This Raman scattering enhancement was a result of the much reduced reflection from the textured surface (see Fig. 5 below), which led to significantly enhanced absorption of the Raman excitation laser.
Raman spectra of textured Si, porous Si, and as-received Si.
Reflectance spectra of textured Si and as-received Si.
Figure 5 shows the total reflectance R% from the textured and the as-received wafer. The total reflectance R% of the textured silicon was dramatically reduced in the full spectrum, indicating the effective light trapping. It is noteworthy that within the wavelength range 500–1060 nm, the reflectance of the textured silicon was ~8%, which is an attractive feature for solar cell applications.[Reference Papet, Nichiporuk, Kaminski, Rozier, Kraiem, Lelievre, Chaumartin, Fave and Lemiti20]
The irregular porous surface formed in our PE experiment was expected as a result of the physical reaction dominated processes. During the PE, the electrode was surrounded by numerous plasma bubbles that formed a continuous layer. Locally, the plasma temperature was high (6–7 × 10³ K).[Reference Klapkiv23] This high-temperature plasma was in direct contact with both the solid electrode and the liquid electrolyte. The relatively cool electrolyte (~boiling point of water) cooled the plasma. This quenching effect caused the plasma bubble to implode on the electrode.[Reference Gupta, Tenhundfeld, Daigle and Ryabkov3] This intensive physical interaction between the plasma and the electrode resulted in the formation of an irregular surface microstructure accompanied by the creation of nano-/micro-particles.[Reference Gupta, Tenhundfeld, Daigle and Ryabkov3, Reference Toriyabe, Watanabe, Yatsu, Shibayama and Mizuno17]
On the other hand, the formation of the textured surface implied that the physical reactions were suppressed and/or the chemical reactions were enhanced. Conventional chemical etching of crystalline silicon included anisotropic etching using strong alkaline solution (e.g., KOH or tetramethylammonium hydroxide (TMAH), pH > 12), isotropic chemical etching using HF/HNO3 mixture, and plasma etching (isotropic) using fluorine containing gas. The textured silicon obtained from the PE appeared to be due to anisotropic chemical etching.
It is known that OH− ions play critical role in the anisotropic alkaline etching.[Reference Allongue, Costa-Kieling and Gerischer24–Reference Baum and Schiffrin26] However, the negative bias (−400 V) applied to the silicon cathode in PE would repel the OH− ions from the silicon surface. Therefore, either the OH− ions were somehow transported to the cathode or other etching reactions were incorporated (e.g., hydrogen ions and excited hydrogen atoms) to create the textured surface. In either case, the physical interactions between the plasma and the cathode surface had to be suppressed or decoupled from the chemical reactions. Increasing the concentration of glycerol seemed responsible for suppressing the physical interactions. Our preliminary assumption is that the glycerol may limit the gas bubble growth and localize the bubbles. As a result, the cathode surface experiences less intensive physical impact caused by plasma bubble collapsing and localized current heating.[Reference Toriyabe, Watanabe, Yatsu, Shibayama and Mizuno17] Further study is needed to clarify the chemical reactions and the mechanisms of suppressing the physical reactions.
In the PE processes, sodium bicarbonate (molarity ~0.05 M, which is <1wt.%) was added into the electrolyte with the primary purpose of creating necessary conductivity. It is worth noting that Vallejo et al. [Reference Vallejo, González-Mañas, Martínez-López and Caballero27] obtained textured silicon based on purely chemical etching using sodium bicarbonate solution. They showed that the texturization depended strongly on the etching time (10–40 min) and the Na2CO3 concentration (5–25wt.%). Therefore, the PE creation of textured Si could partly involve the NaHCO3 induced chemical etching. However, the PE process only took a few seconds with much diluted NaHCO3 solution and the created pyramids had similar or larger sizes than that created by the chemical etching over 10 min. Since the surface morphology changed significantly with the same ratio of NaHCO3 but different glycerol versus water concentration, there were likely other etching mechanisms, which will need to be further studied.
Conclusions
PE can create textured silicon surfaces. The results indicate that the anisotropic etching is an effect of decoupling the chemical reactions from the physical processes in PE. The chemical reaction mechanisms need further clarification. The chemical-reaction dominated PE process may lead to a variety of potential applications, such as efficiently creating textured silicon surface to realize light trapping, which can significantly improve solar cell efficiency.
Acknowledgments
This material is based on work supported by the National Science Foundation/EPSCoR (grant no. 0903804) and by the State of South Dakota. This research has been supported in part by the NSF-IGERT program “Nanostructured Solar Cells: Materials, Processes and Devices” (DGE-0903685), South Dakota BOR PIF Grant, and SDSU Research Fund. The National Science Foundation (grant numbers 1248454 and 1248970) is also acknowledged.