Electrodeposition is a synthesis method with numerous applications, such as surface coating and plating and fabrication of microelectronics.[Reference Gamburg and Zangari1] It also occurs during operation in some systems such as rechargeable batteries. Electrodeposition often results in the formation of unstable morphologies such as dendrites, with characteristic length scales ranging from tens of nanometers to tens of microns. While these instabilities can be exploited to synthesize nanostructures, in many applications including batteries, dendrite formation must be avoided. In fact, dendrite formation during charging remains one of the major hurdles for the development of lithium metal batteries.
Solidification and electrodeposition share one common feature: in both cases, the growth of the crystal is influenced by diffusion (of solute or latent heat in solidification and ions in electrodeposition). Therefore, models developed for solidification have been applied to describe unstable electrodeposition. For example, Barton and Bockris[Reference Barton and Bockris2] introduced a model of dendritic growth based on the difference between the diffusion fluxes associated with planar and spherical geometries. Although this is a valuable first approximation,[Reference Monroe and Newman3, Reference Akolkar4] this type of analysis does not rigorously incorporate the coupling between ionic diffusion, electrostatics, and the kinetics of electrochemical reactions.
In addition to the growth instabilities that arise from diffusion, the electrostatic potential, which is also governed by a Laplace-type equation, has been identified as a possible source of unstable deposition.[Reference Ding, Xu, Graff, Zhang, Sushko, Chen, Shao, Engelhard, Nie, Xiao, Liu, Sushko, Liu and Zhang5] According to electrostatics, an equipotential surface induces a localized enhancement of the electric field around protuberances inversely proportional to the local radius of curvature.[Reference Goldenfeld6] This local enhancement, called the ‘lightning rod’ effect, has been used to explain the preferred growth at dendrite tips.[Reference Ding, Xu, Graff, Zhang, Sushko, Chen, Shao, Engelhard, Nie, Xiao, Liu, Sushko, Liu and Zhang5]
The deposition flux during electrodeposition is governed by the electrochemical reaction rate, for which the Butler–Volmer equation is often employed to describe the nonlinear relationship between the flux and the value of electrostatic potential. A linear stability analysis of electrodeposition on flat electrodes yields finite, positive growth rates for long wavelength perturbations,[Reference Sundström and Bark7] suggesting that morphological instabilities prevail for all applied currents. However, such analysis does not account for the nonlinearities linking the evolution of the ionic concentration, the Butler–Volmer reaction kinetics, the electrostatic potential, and the complex geometry of the evolving front; in addition, incipient instabilities might be overrun by the growing deposits. Indeed, experiments have shown that stable growth is possible for certain metals such as Mg,[Reference DeWitt, Hahn, Zavadil and Thornton8] while instabilities are frequently observed in other metals like Li.[Reference Xu, Wang, Ding, Chen, Nasybulin, Zhang and Zhang9]
The strong coupling of electrostatics and ion migration via nonlinear reaction kinetics at an evolving, and possibly complex, surface makes the phase-field method a well-suited tool to study electrodeposition at the micrometer length scale. Most studies utilizing this approach have focused on the conditions for unstable growth,[Reference Okajima, Shibuta and Suzuki10–Reference Ely, Jana and García12] but there are also works that performed simulations of the stable electrodeposition of Mg.[Reference DeWitt, Hahn, Zavadil and Thornton8] The objective of the present work is to identify the conditions that drive the transition from stable to unstable growth.
We consider a half cell, where a material is being electrodeposited on a substrate immersed in a binary electrolyte.[Reference DeWitt, Hahn, Zavadil and Thornton8, Reference Orvananos, Ferguson, Yu, Bazant and Thornton13] Each region of the simulation domain is defined by a field variable similar to a phase field order parameter that takes the value one inside and zero outside of each subdomain: ψ s indicates the substrate, ψ l the electrolyte, and η i each grain of the deposit, where the index i ranges from 1 to p. The order parameter of the substrate ψ s is assumed to be constant in time. The evolution equations for the remaining order parameters are derived from a free-energy functional  ${ {\rm \cal F}}$ proposed for modeling grain growth in polycrystalline solids.[Reference Moelans, Blanpain and Wollants14] The governing equation for η i is based on the Cahn–Hilliard equation,[Reference Cahn and Hilliard15] which ensures mass conservation. Since electrochemical reaction only occurs at the surface of the deposit exposed to the electrolyte, we express the normal unit vector of the reacting surfaces in terms of the gradient of ψ l. Thus, the evolution equation for η i is given by[Reference DeWitt, Hahn, Zavadil and Thornton8]
 $$\displaystyle{{\partial \eta _i} \over {\partial t}} = \nabla M_{\eta _i} \nabla \displaystyle{{\delta {{\rm \cal F}}} \over {\delta \eta _i}} - v\left( {\displaystyle{{\nabla \psi _{\rm l}} \over { \vert \nabla \psi _{\rm l} \vert}} \cdot \nabla \eta _i} \right).$$
Assuming that currents arising from non-faradaic processes can be neglected, the normal velocity of the interface is related to the reaction current density i rxn via v = i rxn/(z + FC s), in which C s is the number density of atoms in the deposits, C l the concentration of ions in the electrolyte, z + the charge number, and F the Faraday constant. As the deposit grows, the electrolyte is displaced; we employ the Allen–Cahn equation[Reference Allen and Cahn16] for the evolution of ψ l,
 $$\displaystyle{{\partial \psi _{\rm l}} \over {\partial t}} = - L_{\psi _{\rm l}} \,\displaystyle{{\delta {{\rm \cal F}}} \over {\delta \psi _{\rm l}}}. $$
For the scope of the present paper, we make the approximation of a uniform concentration of ions, corresponding to a well-stirred electrolyte, or assuming short times compared with diffusion time scales. While conducting the calculations presented in this work we also performed preliminary simulations of electrodeposition that accounted for the evolution of the concentration of ions, and we did not observe that ionic diffusion could be a source of unstable growth before Sand's time (the characteristic time until the electrolyte is depleted near the electrode). Even though depletion can be a source of instabilities for highly driven systems due to the appearance of space-charge regions,[Reference Chazalviel17, Reference Nielsen and Bruus18] unstable growth has also been commonly observed before Sand's time.[Reference Xu, Wang, Ding, Chen, Nasybulin, Zhang and Zhang9] Therefore, our study is applicable to the onset of unstable growth during the early stages of the electrodeposition process.
We obtain the electrostatic potential by solving the continuity equation for the current,  $\nabla \cdot i = 0$, along with electroneutrality, which yields[Reference DeWitt, Hahn, Zavadil and Thornton8, Reference Orvananos, Ferguson, Yu, Bazant and Thornton13]
 $$z_ + C_{\rm l} F\,\nabla \left[ {{\rm (}z_ + D_ + - z_ - D_ - {\rm )}\displaystyle{F \over {RT}}\nabla \phi} \right] = 0,$$
where ϕ is the electrostatic potential, and we have replaced mobilities with diffusivities by making use of Einstein's relation. D + and D − are the cation and anion diffusivities, z + and z − are the corresponding charge numbers, R is the gas constant, and T is the temperature. Here, we note that the ionic conductivity can be written as  $\kappa = z_ + C_{\rm l} F^2 {\rm (}z_ + D_ + - z_ - D_ - {\rm )}/RT$.
The smoothed boundary method[Reference Yu, Chen and Thornton19] is utilized to combine the governing equation with the associated boundary conditions on the evolving domain of the electrolyte. Thus, Eq. (3) is reformulated as
 $$\nabla \psi _{\rm l} \left[ {{\rm (}z_ + D_ + - z_ - D_ - {\rm )}\displaystyle{{C_{\rm l} F} \over {RT}}\nabla \phi} \right] + \vert \nabla \psi _{\rm l} \vert \displaystyle{{i_{{\rm rxn}}} \over {z_ + F}} = 0.$$
Because the substrate and the deposit are both metallic solids, their electrostatic potential is assumed to be uniform, with a value denoted by ϕ w. Potential drops within the substrate and deposit are therefore neglected in this work, which is a good approximation for the geometries we consider. Deposition is then driven by the overpotential ϕ − ϕ w, and the reaction current density i rxn is given by the Butler–Volmer equation,[Reference Gamburg and Zangari1]
 $$i_{{\rm rxn}} = i_0 {\rm (}e^{\beta z_ + F{\rm (}\phi - \phi _{\rm w} {\rm )}/RT} - e^{ - {\rm (}1 - \beta {\rm )}z_ + F{\rm (}\phi - \phi _{\rm w} {\rm )}/RT} {\rm ),}$$
where i 0 is the exchange current density and β is the symmetry factor. Combining Eqs. (4) and (5), a dimensional analysis with  $\tilde \phi = {\rm (}\phi - \phi _{\rm w} {\rm )}/\phi ^* $ and
 $\tilde x = x/L^* $ yields characteristic units for the potential and length scale: ϕ* = RT/F and L* = ((z + D + − z − D −) z + FC l)/i 0, which depend solely on the material parameters and not on the configuration of the electrodeposition setup.
Electrodeposition as described above is controlled by ionic migration and reaction kinetics. The suitable dimensionless number is then the second Damköhler number, defined to measure the relative magnitude of the chemical reaction flux to the mass migration flux, Da II ∝ i 0/κ.[Reference Fogler20] Given the length scale L associated with the geometry of the electrode and its features, we write
 $$Da_{{\rm II}} = \displaystyle{F \over {RT}}\displaystyle{{i_0 L} \over \kappa} = \displaystyle{L \over {L^*}}. $$
Da II may therefore be reinterpreted as the ratio between the length scale L of the geometry to the characteristic length scale L* given by the material parameters.
Our simulations indicate that, within the model presented here, there are two main conditions leading to unstable growth. One is linked to large exchange current densities, as measured by Da II, and the other related to very large deposition currents.[Reference Ding, Xu, Graff, Zhang, Sushko, Chen, Shao, Engelhard, Nie, Xiao, Liu, Sushko, Liu and Zhang5] To examine each of these instabilities, we proceed by studying the reaction rates on the surface of a model ‘dendrite,’ a single columnar deposit with a hemispherical tip. The details of the model, along with the numerical methods used and the material parameters (chosen to correspond to typical values for Li electrodeposition during battery operation) are summarized in the Supplementary Material.
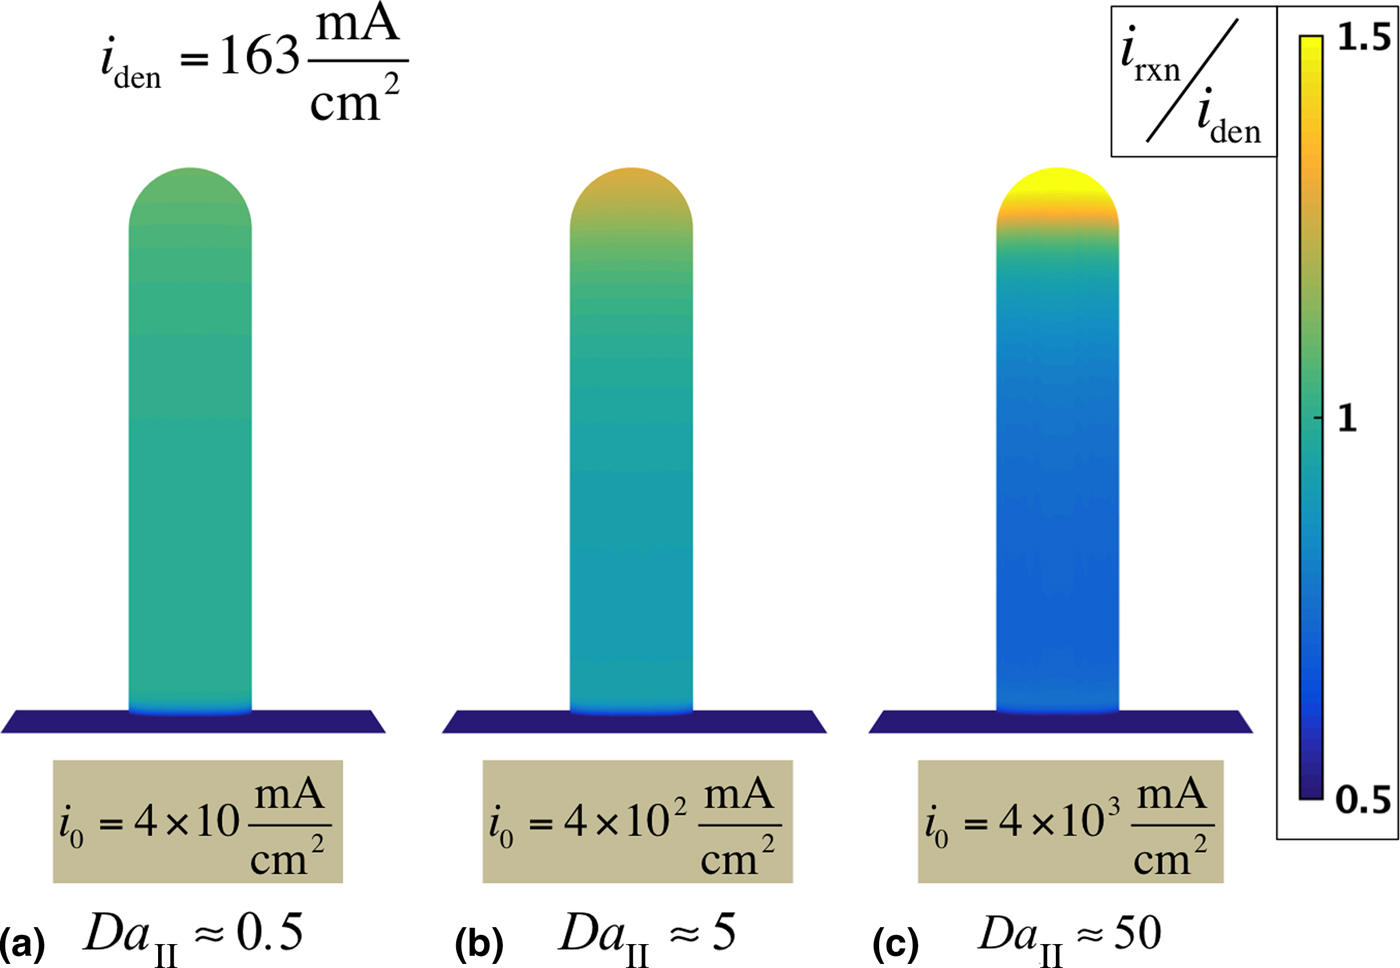
Figure 1 shows the calculated reaction rates on the dendrite's surface as i 0 is varied from 4 × 10 to 4 × 10³ mA/cm2. Note that values calculated from experimental data assuming uniform deposition are in the range 0.1 ~ 10 mA/cm2.[Reference Lee, Jung, Kim, Kim, Ahn and Chun21] However, due to the experimental difficulties in achieving stable Li electrodeposition, reliable exchange current density measurements are scarce; these values are likely underestimated, considering that unstable deposition is highly localized. The distribution of the reaction current density is indicated by the color on the surface, which corresponds to the ratio between the local reaction rate i rxn and the average current density over the dendrite's surface, i den. Taking the height of the column as the length scale L, Da II = L/L* is evaluated, which varies by two orders of magnitude from 0.5 (Fig. 1(a)) to 50 (Fig. 1(c)). Figure 1(a), with Da II ≈ 0.5, exhibits nearly uniform deposition rates, indicating that the columnar shape itself, with a high curvature dome capping a flat-sided cylinder, does not always lead to unstable growth. Enhancement of the reaction rates due to curvature is not observed, and therefore the ‘lightning rod’ effect does not necessarily occur under the Butler–Volmer reaction kinetics. However, when the column height is larger than the characteristic length scale, i.e., for greater values of Da II, we observe a relative increase of the reaction rate at the dendrite tip, which would lead to unstable growth. It should be noted that, for the parameters in these calculations, the nondimensional potential, and therefore the arguments of the exponential terms in the Butler–Volmer equation, are much smaller than one, becoming even smaller as i 0 is increased. Therefore, the instability stemming from large exchange current densities is not influenced by the exponent in the Butler–Volmer equation, and this behavior would also occur in the linearized formulation of the equation.[Reference Ely, Jana and García12] Thus, if present, this type of instability would not be mitigated by lowering the deposition current. Experimentally, a correlation between lower exchange current densities — produced by the inclusion of additives — and stable electrodeposition has been observed for zinc metal.[Reference Banik and Akolkar22]
Non-uniform electrodeposition produced by high exchange current densities. Side view of a single dome-capped columnar ‘dendrite’ with 1 μm radius and 9 μmheight placed on a 30 μm square substrate. A 10 mA/cm2 current density is applied over the total area, resulting in an averaged current density of i den = 163 mA/cm2 on the deposit; the substrate is assumed to be inert. Results at t = 0 s show enhancement of the reaction current i rxn at the tip of the deposit as i 0 is increased from (a) i 0 = 4 × 10 mA/cm2 to (b) i 0 = 4 × 10² mA/cm2 to (c) i 0 = 4 × 10³ mA/cm2. The second Damköhler number is evaluated from Da II = (F/RT)(i 0 L/κ) with L = 9 μm.

The applicability of the Damköhler number in determining the condition of stability can be justified from the general features of the electrostatic potential in these simulations, as follows. We find that during electrodeposition, the overpotential variations on the surface of the deposit depend on the height difference along the general direction of the electric field rather than on the differences in curvature. Furthermore, we observe that such variation in potential is comparable in magnitude with the potential drop over a similar length scale in the electrolyte. With L representing the length scale of features of the deposit, the variation of potential along a distance L is approximately given by Δϕ = i nom L/κ, where i nom is the nominal current density defined as the average deposition current density in the electrolyte far from the deposit. Whether this potential difference is significant enough to trigger instabilities depends on the corresponding variation in reaction current density, which can be estimated from the Butler–Volmer equation,
 $$\Delta i_{{\rm rxn}} = \displaystyle{{di_{{\rm rxn}}} \over {d\phi}} \Delta \phi \approx i_0 \displaystyle{{z\beta F} \over {RT}}\Delta \phi = i_0 \displaystyle{{z\beta F} \over {RT}}\displaystyle{{i_{{\rm nom}} L} \over \kappa}. $$
The tendency for non-uniform deposition can be characterized by the ratio between the variations in reaction current density to the average deposition current density,
 $$\displaystyle{{\Delta i_{{\rm rxn}}} \over {i_{{\rm nom}}}} \approx i_0 \displaystyle{{z\beta F} \over {RT}}\displaystyle{L \over \kappa} = \beta Da_{{\rm II}}. $$
Therefore, within an order of magnitude, Da II serves as a measure of growth instability. Similarly, the condition of stability can also be expressed in terms of the Wagner number, W = (dϕ/di)(κ/L),[Reference Gamburg and Zangari1, Reference Wagner23] in the form Δi rxn/i nom ≈ 1/W.
Generally, systems governed by Laplace's equation, such as solidifying solid–liquid mixtures, are susceptible to unstable growth due to the convergence of gradient lines towards protuberances when the surface is set at a constant-value boundary condition,[Reference Arneodo, Argoul, Couder and Rabaud24] analogous to an equipotential surface. However, because the Butler–Volmer kinetics makes the flux a function of the potential, morphological evolution during electrodeposition exhibits some unique features, distinct from those of solidification. The Butler–Volmer kinetics dictates a uniform reaction rate on a surface with a constant overpotential, therefore not allowing for ‘lightning rod’ curvature effects. Our simulations demonstrate that the electrostatic potential at the deposit's surface varies to satisfy the galvanostatic boundary condition. The magnitude of these potential variations may trigger instabilities only if they are large enough to produce significant differences in reaction rates. In all our simulations, we observe a higher reaction rate on hills compared with valleys, in agreement with linear stability analysis that predicts morphological instabilities for all values of applied current.[Reference Sundström and Bark7] However, only when the value of L/L* is large, this non-uniform growth is significant enough to induce instabilities.
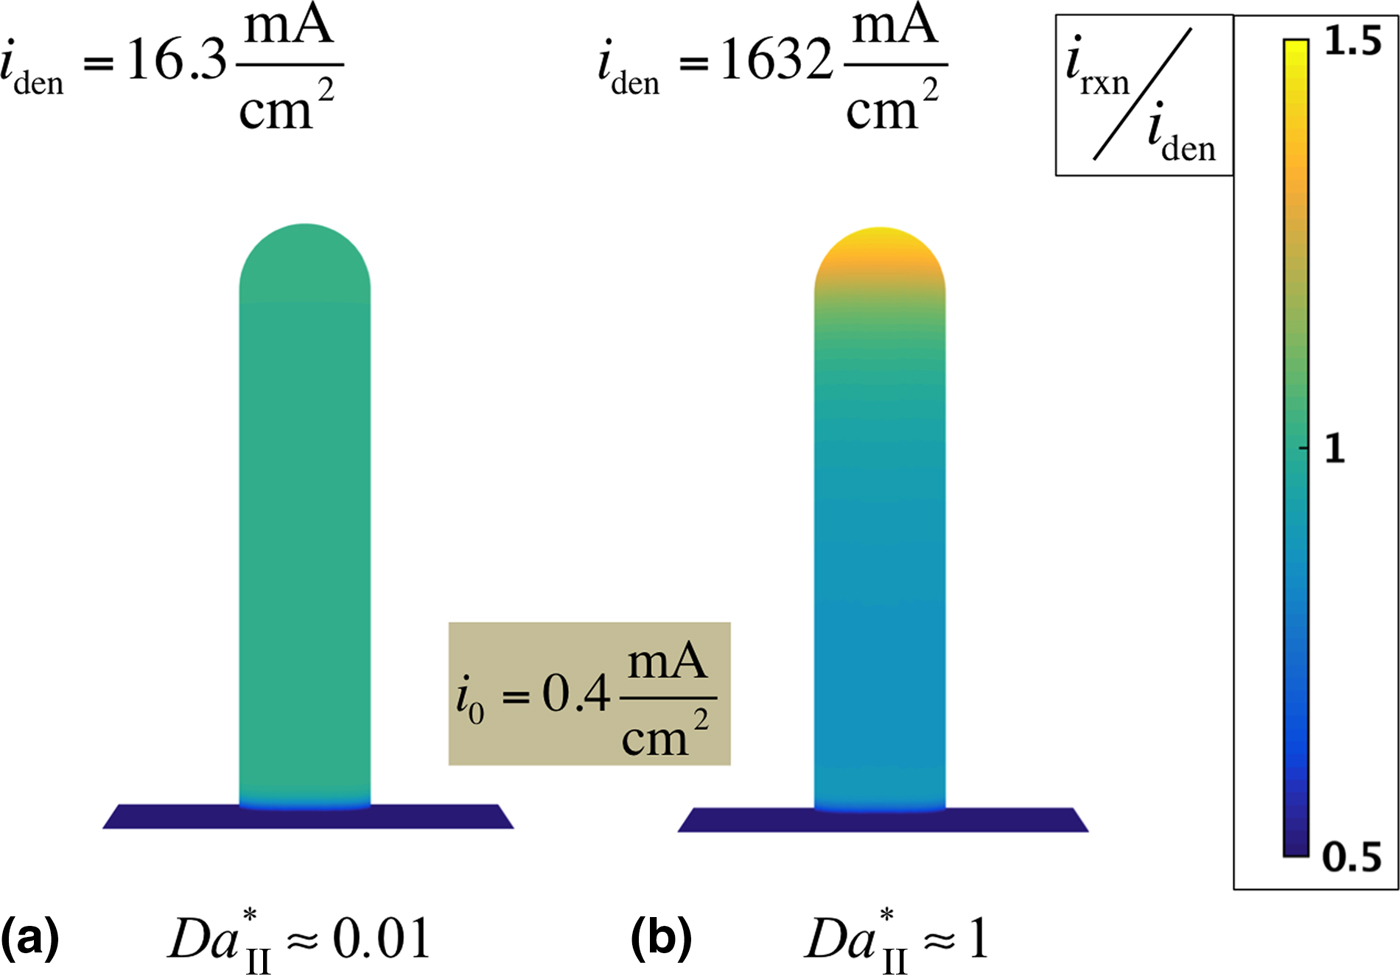
Even for low Damköhler numbers, the nonlinearity of the Butler–Volmer equation can contribute to unstable growth at large overpotentials, which occurs at high deposition current densities relative to i 0. Figure 2 illustrates this scenario, where we take the setup from Fig. 1 and, while fixing i 0 at a value corresponding to Da II ≈ 0.05, we apply nominal currents of 1 mA/cm2 (Fig. 2(a)) and 100 mA/cm2(Fig. 2(b)). As in Fig. 1, the color indicates the ratio of the reaction current density to the reaction current density averaged over the dendrite surface. It can be observed that the higher-current case results in an increase of the relative reaction rate at the tip of the column, indicating that sufficiently high current densities would also induce unstable growth. In order to observe non-uniform reaction rates, a very high current density is assumed in this calculation, but it should be noted that it is not an unrealistic value, as local current densities of 100–400 mA/cm2 have been estimated at dendrite tips during Li electrodeposition.[Reference Crowther and West25]
Non-uniform reaction rate caused by large deposition currents. Side view of a single hemispherical columnar ‘dendrite’ with 1 μm radius and 9 μmheight on a 30 μm square substrate and an exchange current density of i 0 = 0.4 mA/cm2. Nominal current densities of (a) 1 mA/cm2 and (b) 100 mA/cm2 are applied over the total simulation area, resulting in averaged current densities of (a) i den = 16.3 mA/cm2 and (b) i den = 1632 mA/cm2 on the deposits. Results at t = 0 s show enhancement of the reaction current i rxn at the tip of the deposit for higher currents. The modified Damköhler number is computed from  $Da_{{\rm II}}^* = {\rm (}F/RT{\rm )(}i_{{\rm nom}} L/\kappa {\rm )}$ with L = 9 μm.
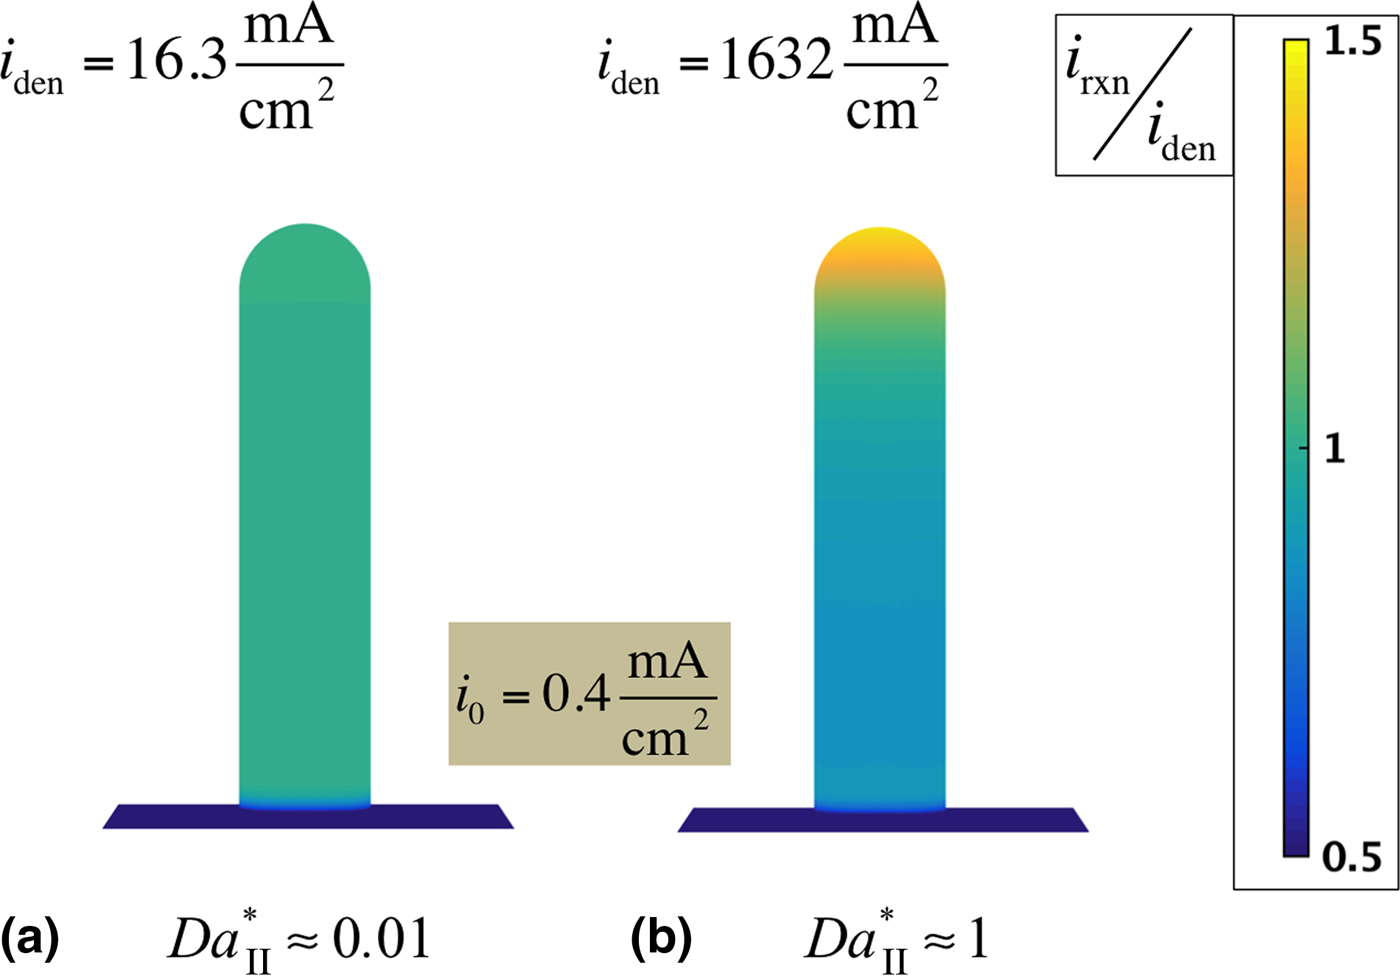
In principle, lowering the average deposition current or increasing the reaction surface area can mitigate this type of instability. For this case of large applied currents, we have also observed that variations in potential on the surface of the deposit depend mainly on the height difference and are approximately proportional to Δϕ = i nom L/κ. Noting that, for this case, only the deposition term of the Butler–Volmer equation is significant, one can characterize reaction inhomogeneities by the ratio between the currents of peaks compared with valleys:
 $$\displaystyle{{i_{{\rm peak}}} \over {i_{{\rm valley}}}} \approx {\rm exp(}Fz_ + \Delta \phi /RT{\rm )} = {\rm exp(}z_ + \beta Fi_{{\rm nom}} /RT\kappa {\rm )}{\rm.} $$
Thus, for large currents, stability is controlled by a Damköhler-like nondimensional number that still has the deposit surface roughness as the characteristic length scale but replaces the exchange current density with the nominal deposition current,  $Da_{{\rm II}}^* = {\rm (}F/RT{\rm )(}i_{{\rm nom}} L/\kappa {\rm )}$.
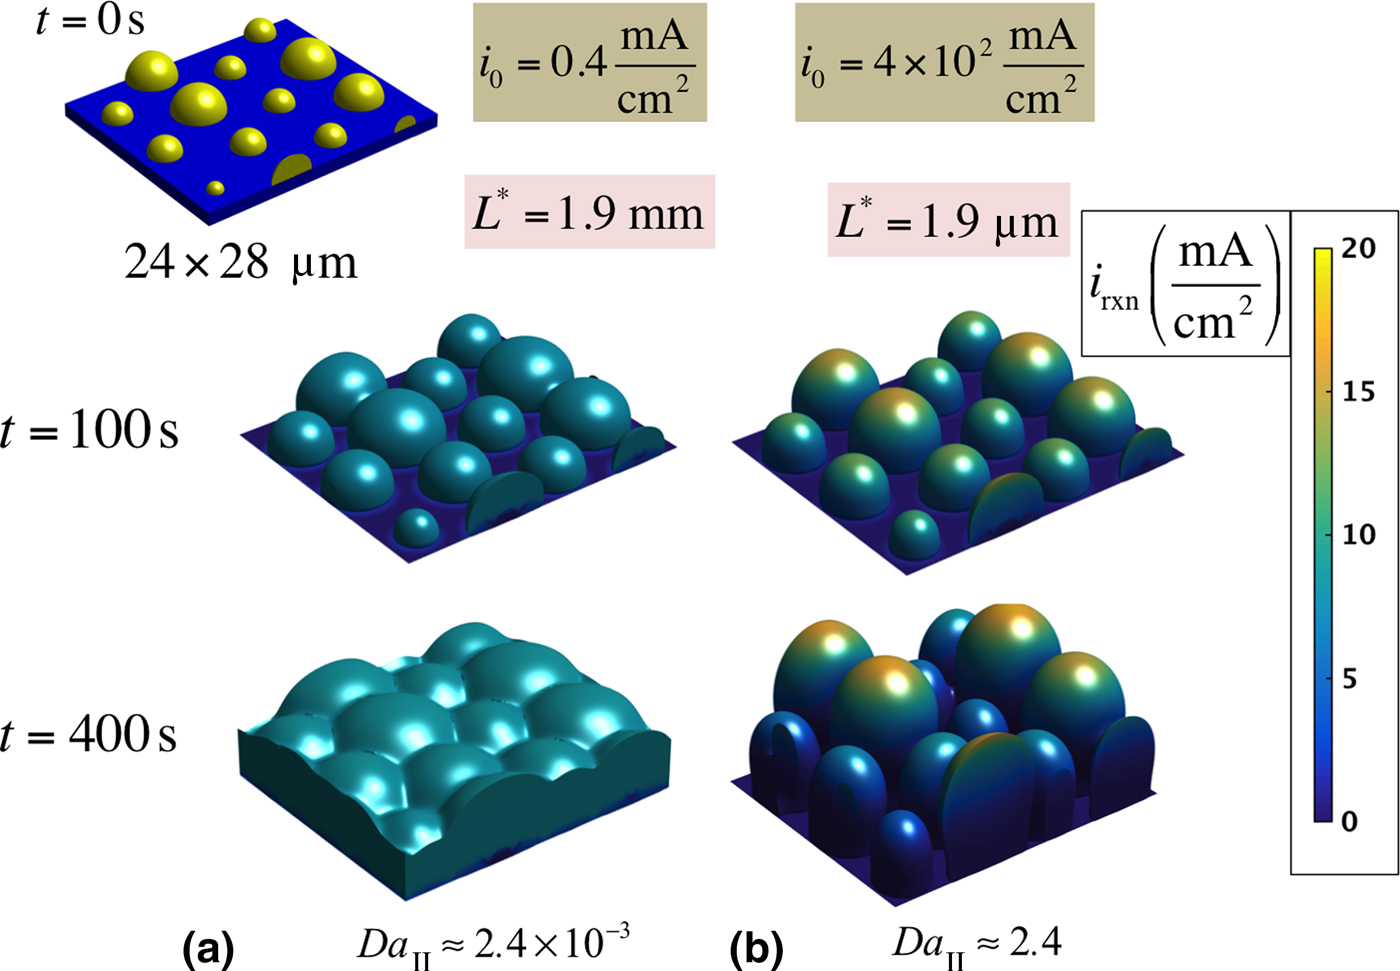
A deposit morphology that would more closely represent electrodeposition onto an inert conductive electrode, with an initial distribution of small seed grains is shown in Fig. 3. On a 24 × 28 μm substrate, we place 12 nuclei with random radii in the range 0.8 ~ 3.0 μm in a triangular array. An average current of 10 mA/cm2 is applied for 400 s with i 0 = 0.4 mA/cm2 (Fig. 3(a)) and i 0 = 4 × 10² mA/cm2 (Fig. 3(b)). For a low exchange current density (Fig. 3(a)), nuclei grow nearly uniformly and merge towards a compact film of columnar deposits like those reported by Zhang et al. [Reference Zhang, Qian, Xu, Russell, Chen, Nasybulin, Bhattacharya, Engelhard, Mei, Cao, Ding, Cresce, Xu and Zhang26] In contrast, a high exchange current causes nuclei to grow preferentially at the tip (Fig. 3(b)), resulting in a growth morphology similar to that recently reported by in situ electron microscopy by Mehdi et al. [Reference Mehdi, Qian, Nasybulin, Park, Welch, Faller, Mehta, Henderson, Xu, Wang, Evans, Liu, Zhang, Mueller and Browning27] and Leenheer et al.,[Reference Leenheer, Jungjohann, Zavadil, Sullivan and Harris28] with deposits taking an elongated ‘light bulb’ shape.
Morphological evolution for a distribution of deposits for low and high values of i 0. Galvanostatic electrodeposition at 10 mA/cm2, starting from a triangular array of nuclei with random radii in the range 0.8–3.0 μm and average separation of L = 4.7 μm, with exchange currents of (a) i 0 = 0.4 mA/cm2 and (b) i 0 = 4 × 10² mA/cm2. Higher exchange current densities lead to the formation of unstable deposits. The second Damköhler number is evaluated from Da II = (F/RT)(i 0 L/κ) with L = 4.7 μm.

Recently, Cogswell[Reference Cogswell29] reported a similar analysis of electrodeposition using phase field modeling. Although the model construction and the simulation methods are different (for instance, the present work includes 3D simulations of multigrain material), Cogswell also determines that the Damköhler number is a parameter that governs growth stability. However, the physical parameters that enter into the Damköhler number expressions are different, as well as the manner in which the expressions are constructed. In this work, we derive the Damköhler number as a measure of instability by linearizing the Butler–Volmer equation (Eqs. (7) and (8)), while Cogswell makes use of a purely dimensional argument, leading to an incorrect choice of the parameters that enter into the analysis. For example, Cogswell's expression is inversely proportional to C s (instead of C l) and takes the electrode separation as the relevant length scale L (instead of the length scale associated with surface roughness). We propose that our expression for the Damköhler number is a direct indication of morphological stability during electrodeposition, as we find that uneven growth is not affected by the inter-electrode spacing, but rather depends on the magnitude of the gradient of the potential relative to the exchange current density, which leads to an expression inversely proportional to C l. Also, we find that the relevant length scale for L should be given by that associated with the surface roughness, whether it originates from uneven reaction rates, nucleation events, or non-uniformly distributed catalysts, as this increases the difference in the deposition current density at protrusions compared with other regions.
It is important to note that we have implicitly assumed uniform kinetic properties at the deposit/electrolyte interface. Therefore, the model described here do not account for dendritic structures that would result from non-uniform surfaces (including solid-electrolyte interfaces) or the catalytic action of impurities.[Reference Steiger, Kramer and Mönig30] However, such inhomogeneities may lead to uneven deposition that could later be magnified by the instabilities studied in this work.
In summary, this work identifies two criteria for growth instability during electrodeposition. The first criterion is defined in terms of the ratio, L/L*, between the length scale of the features of the deposit and the characteristic length scale that is a function of the material parameters of the system. This ratio is also identified as the second Damköhler number associated with the length scale of the features of the deposit, and the criterion applies when the current is sufficiently small. The second criterion is based on the same ratio, which we termed as the modified Damköhler number, but with the exchange current density in L* replaced by the far-field average current density. This criterion applies for instabilities arising from the large overpotentials required to maintain large current densities, which makes the nonlinearity of the exponential term in the Butler–Volmer equation important. This instability is also influenced by the roughness of the surface, and thus the relevant length scale is the feature size of the deposits. When sufficiently strong (i.e., the numbers are much greater than unity), both of these two instability mechanisms would increase surface roughness, which would trigger a positive feedback loop and eventually lead to runaway dendritic growth. However, if the deposition surface is nearly flat (as compared with the respective characteristic length scales), the roughness increase will be overrun by the growing front. Therefore, our results suggest that unstable electrodeposition can be suppressed by favoring relatively homogenous initial conditions, such as those resulting from high nucleation densities, and also by controlling kinetics by lowering the exchange current density and increasing the ionic conductivity.
Acknowledgments
The authors would like to thank H.-C. Yu for critical reading of the manuscript. This work was supported as part of the Joint Center for Energy Storage Research, an Energy Innovation Hub funded by the U.S. Department of Energy, Office of Science, Basic Energy Sciences. Additionally, this research used resources of the National Energy Research Scientific Computing Center, a DOE Office of Science User Facility supported by the Office of Sciences of the U.S. Department of Energy under Contract No. DE-AC02-05CH11231.
Supplementary material
The supplementary material for this article can be found at https://doi.org/10.1557/mrc.2017.38