Introduction
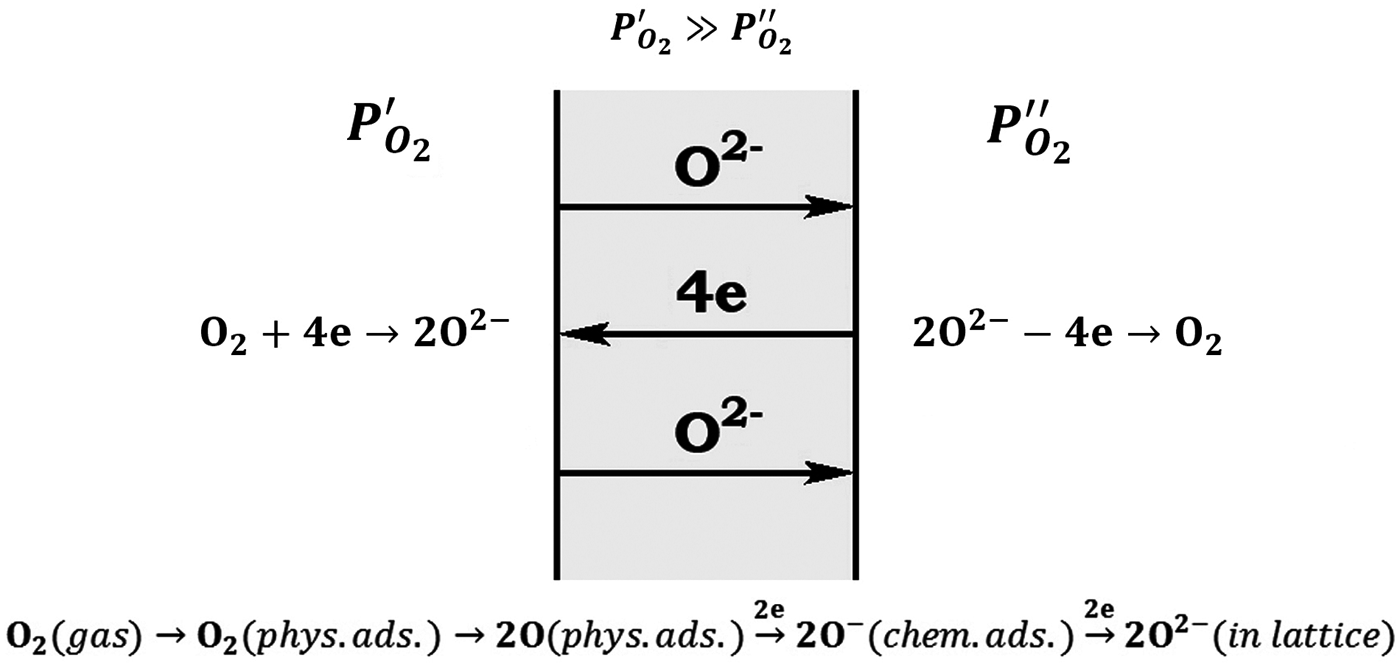
Gas-tight ceramic or solid/liquid metal oxide composites exhibiting high mixed conductivity could be used as ion transport membranes, ITM, for oxygen separation from air.[Reference Bose, Stiegel, Armstrong, Halper, Foster and Bose1–Reference Belousov, Fedorov and Vorobiev5] The advantages of oxygen separation by ITM over technologies such as pressure- and temperature-swing adsorption and porous membrane separation methods[Reference Isalski6–Reference Toshima, Asanuma and Toshima9] is their infinite separation factor. The composite ITM are usually made from electron- and ion-conducting chemically compatible and thermodynamically stable metal oxides. In an electrochemical field, the high ambipolar conductivity of oxygen ions and electrons results in the high oxygen permeation rate (Fig. 1). The oxygen permeation flux through ITM depends on three mechanisms: the first is the dissociation of oxygen molecules into oxygen anions at the membrane surface, known as surface exchange kinetics.[Reference Bouwmeester, Kruidhof and Burggraaf10] The second is the migration of oxygen anions through the membrane,[Reference Van Hassel11] while the third is the recombination of oxygen anions back to oxygen molecules on the other side of the membrane. Each mechanism has the potential to become the rate-limiting step.
Schematic of oxygen ion and electron transport through ITM.

Bismuth oxide exists as four crystallographic polymorphs.[Reference Harwig and Gerards12–Reference Harwig and Gerards18] The room temperature α-Bi2O3 is monoclinic. It transforms at 730 °C into the face-centered cubic (fcc) δ-Bi2O3, which is stable up to the melting point at 820 °C.[Reference Battle, Catlow, Drennan and Murry13, Reference Battle, Catlow, Chadwick, Cox, Greaves and Moroney14] On cooling, large thermal hysteresis occurs and the metastable tetragonal β or body-centered cubic (bcc) γ form can be obtained, depending on the cooling conditions, transforming to the β-phase at 650 °C or the γ-phase at 639 °C.[Reference Blower and Graves15–Reference Harwig and Weenk17] The β-phase transforms to the α-phase at 303 °C, and the γ-phase at 500 °C, although the γ-phase may persist to room temperature with slow cooling rates.[Reference Harwig and Gerards12, Reference Harwig and Gerards18] The α-monoclinic and γ-bcc forms are semiconductors, whereas the β-tetragonal and δ-fcc forms are oxide ion conductors. The δ-phase has the highest known oxygen ionic conductivity. The high ionic conductivity is caused by the large number of oxygen vacancies and high anion mobility. The high concentration of oxygen vacancies is a result of obtaining the fluorite structure with a Bi3+ cation. The high anion mobility is related to the high polarizability of the Bi3+ cation with its lone pair of electrons.
Ordering of the oxygen vacancies in a monoclinic α-Bi2O3 is established.[Reference Harwig16, Reference Harwig and Weenk17] On heating trough 730 °C, a first-order α → δ-Bi2O3 transition is a vacancy order-disorder transition. The transition enthalpy is 2.7 times the heat of melting. The entropy gain is 75% of the total entropy gain on passing from the solid to the liquid state. The transition corresponds to a disordering of the anion sublattice,[Reference Harwig and Gerards18] which results in an abrupt increase of the oxygen ionic conductivity. However, one major problem of using δ-Bi2O3 as the oxygen ionic conductor in composite ITM is their cracking due to the volume change (~11–12%) associated with polymorphic transformation of the monoclinic α- into cubic δ-Bi2O3 at the ITM heating. The δ-phase can be stabilized, but the ionic conductivity is substantially reduced.[Reference Jiang and Wachsman19–Reference Jiang, Buchanan, Henn, Stevenson and Wachsman27] Recently this problem is alleviated. The in situ Bi2O3 melt crystallization and grain boundary wetting methods of formation of the gas-tight NiO/δ-Bi2O3 and In2O3/δ-Bi2O3 ceramic and ZnO/Bi2O3 solid/liquid composites are developed, respectively.[Reference Belousov, Schelkunov, Fedorov, Kulbakin and Vorobiev28–Reference Kul'bakin, Belousov, Fedorov and Vorobiev30] These composites show the oxygen permeation rate comparable with that of the state-of-the-art membrane materials[Reference Hong, Kirchen and Ghoniem31–Reference Yaremchenko, Buysse, Middelkoop, Shijkers, Buekenhoudt, Frade and Kovalevsky34] and could be used as ITM for oxygen separation from air. The aim of this paper is to summarize and discuss data on formation methods and transport properties of these composites. Some focus is directed to our own work.
Formation methods
The gas-tight NiO/δ-Bi2O3 and In2O3/δ-Bi2O ceramic composites were prepared by the in situ Bi2O3 melt crystallization method.[Reference Belousov, Schelkunov, Fedorov, Kulbakin and Vorobiev28, Reference Belousov, Schelkunov, Fedorov, Kulbakin and Vorobiev29] The previously sintered NiO–54 wt.% Bi2O3 and In2O3–55 wt.% Bi2O3 ceramic composites were then heated to 840 °C. This temperature, according to the NiO–Bi2O3 and In2O3–Bi2O3 phase diagrams [Figs. 2(a) and 2(b)], corresponds to the two-phase area, where the solid NiO or In2O3 and liquid are in equilibrium (liquid-phase sintering[Reference German, Suri and Park38]). After holding at 840 °C for 10–15 min, the composites were slowly (1–5 °C/min) cooled to 800 °C. This temperature corresponds to the two-phase area, where the solid NiO or In2O3 and δ-Bi2O3 are in equilibrium [Figs. 2(a) and 2(b)]. To avoid the polymorphic transformations of Bi2O3, in situ oxygen permeation measurements were performed at 800 °C by gas flow technique.[Reference Fedorov, Belousov and Vorobiev4] Microstructure of the composites is presented in Fig. 3.
Phase diagrams of (a) Bi2O3–NiO,[35] (b) Bi2O3–In2O3,[36] and (c) Bi2O3–ZnO.[37]
Scanning electron micrographs of fractures of (a) NiO–54 wt.% Bi2O3 and (b) In2O3–55 wt.% Bi2O3 composites after cooling from 840 °C; dark constituent is NiO or In2O3, respectively.
The gas-tight ZnO/Bi2O3 solid/liquid composites were prepared by the grain boundary wetting method.[Reference Kul'bakin, Belousov, Fedorov and Vorobiev30] The previously sintered ZnO – 15, 20, 25, and 30 wt.% Bi2O3 ceramic composites were then heated to 760–820 °C. This temperature range corresponds to the two-phase area, where the solid ZnO and liquid are in equilibrium [Fig. 2(c)]. During the heating, grain boundary wetting transition occurred. The grain boundary wetting transition has been established at eutectic point in Bi2O3-containing ceramic composites.[Reference Belousov39–Reference Belousov49] The result is a solid/liquid composite consisting of ZnO solid grains and liquid channels at the grain boundaries (Fig. 4). This is called a liquid-channel grain-boundary structure (LGBS).[Reference Belousov and Fedorov3, Reference Fedorov, Belousov and Vorobiev4, Reference Belousov50, Reference Belousov51] The intergranular liquid channels give the LGBS high mechanical plasticity[Reference Xie, Mitomo and Zhan52] (Fig. 5), which would make it easy to shape and alleviate problems due to brittleness.
Scanning electron micrograph of polished cross-section of ZnO–30 wt.% Bi2O3 composite after cooling from 800 °C; dark constituent in IMG1 is ZnO.
Photography of (a) starting ZnO–30 wt.% Bi2O3 ceramic composite and (b) ZnO–30 wt.% Bi2O3 LGBS after deformation at 800 °C.
Transport properties
NiO/δ-Bi2O3 and In2O3/δ-Bi2O3 ceramic composites
Transport properties of NiO–54 wt.% Bi2O3 and In2O3–55 wt.% Bi2O3 ceramic composites are reported in Refs.[Reference Belousov, Schelkunov, Fedorov, Kulbakin and Vorobiev28, Reference Belousov, Schelkunov, Fedorov, Kulbakin and Vorobiev29] Temperature dependences of conductivities of these composites are presented in Fig. 6 (temperature dependences of NiO, In2O3, and Bi2O3 conductivities for comparison). In the temperature range of 500–730 °C, contribution of In2O3 or NiO electron or hole conductivity, respectively, is considerable.[Reference Kofstad53–Reference Eror and Wagner56] The conductivity jump at 730 °C induced by α → δ-Bi2O3 polymorphic transformation was accompanied by increasing oxygen ionic conductivity. The defect chemistry models are proposed to explain the ionic conductivity of δ-Bi2O3.[Reference Mac Do'nail and Jacobs57–Reference Willis65]
Temperature dependences of conductivities of NiO–54 wt.% Bi2O3, In2O3–55 wt.% Bi2O3, NiO, In2O3, and Bi2O3. S = Siemens.
Figure 7 shows the oxygen permeation fluxes through NiO–54 wt.% δ-Bi2O3 and In2O3–55 wt.% δ-Bi2O3 ceramic composites as a function of oxygen partial pressure difference lg(P′O2 / P″O2) between oxygen-rich and -lean sides of the composites. Wagner's Eq. (1) is usually used to describe the oxygen permeation flux (j O2) due to the bulk chemical diffusion[Reference Wagner66]
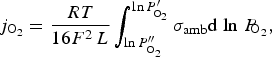 $$\,j_{{\rm O}_ 2 } = \displaystyle{{RT} \over {16F^2\, L}}\int _{\ln P^{\prime \prime}_{{\rm O}_ 2} }^{\ln P^{\prime}_{{\!\rm O}_ 2 } } \sigma _{\rm amb} {\rm d \;ln \;}P_{{\!\!\rm O}_ 2 }\comma$$
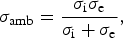 $$\sigma _{\rm amb} = \displaystyle{{\sigma _{\rm i} \sigma _{\rm e} } \over {\sigma _{\rm i} + \sigma _{\rm e} }}\comma \;$$
where σamb, σi, and σe are the ambipolar, ionic, and electronic conductivities, respectively, L is the membrane thickness, F is the Faraday constant, R is the universal gas constant, and T is the temperature. Taking an average value of σamb simplifies Eq. (1) further so that j O2 is proportional to  $\overline {\sigma _{\rm amb} } $ and P′O2 / P″O2
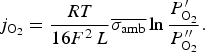 $$\,j_{{\rm O}_ 2 } = \displaystyle{{RT} \over {16F^2\, L}}\overline {\sigma _{\rm amb} } \ln \displaystyle{{P^{\prime}_{{\rm O}_ 2 } } \over {P^{\prime \prime}_{{\rm O}_ 2 } }}.$$
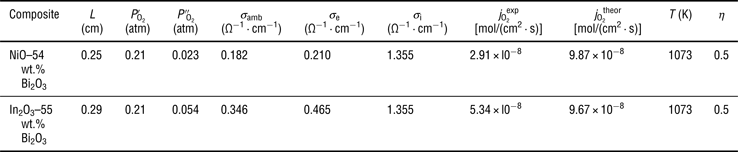
The calculated by Eq. (3) and the experimental values of oxygen permeation fluxes are of the same order of magnitude (Table 1), which shows that (in the range of composite thickness 2.5–2.9 mm used in the present study) the oxygen permeation rate is controlled by ambipolar conductivity.
Dependences of oxygen permeation fluxes through NiO–54 wt.% Bi2O3 (thickness 2.5 mm) and In2O3–55 wt.% Bi2O3 (thickness 2.9 mm) ceramic composites on oxygen partial pressure difference at 800 °C.
Experimental (j O2exp) and calculated (j O2theor) values of the oxygen permeation fluxes through NiO–54 wt.% Bi2O3 and In2O3–55 wt.% Bi2O3 ceramic composites.
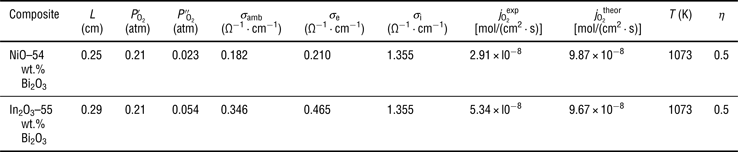
σi = ησBi2O3; σe = (1 − η)σNiO (or In2O3); η is the volume fraction of Bi2O3; σBi2O3, σIn2O3, and σNiO are the conductivities of Bi2O3, ln2O3, and NiO, respectively (Fig. 6).
ZnO–15, 20, 25, and 30 wt.% Bi2O3 solid/liquid composites
Transport properties of ZnO–15, 20, 25, and 30 wt.% Bi2O3 LGBS are reported in Ref.[Reference Kul'bakin, Belousov, Fedorov and Vorobiev30] Temperature dependences of conductivities of these composites are presented in Fig. 8. According to the ZnO–Bi2O3 phase diagram [Fig. 2(c)], the Bi38ZnO58 compound is in the temperature range of 600–753 °C. In this temperature range, contribution of Bi38ZnO58 electron conductivity is considerable. The conductivity enhancement at 753 °C was caused by LGBS formation (Fig. 4). At the LGBS formation, contribution of oxygen ionic conductivity comes significant. The intergranular liquid channels can serve as conduction pathways for oxygen ions.[Reference Belousov and Fedorov3] The oxygen ionic conductivity of LGBS will be increased with Bi2O3 content.
Temperature dependences of conductivities of ZnO–15, 20, 25, and 30 wt.% Bi2O3, ZnO, and Bi2O3. S = Siemens.
The liquid volume fraction dependences of the LGBS oxygen ion transference number are presented in Fig. 9. The oxygen ion transference number increases with volume fraction of liquid. The LGBS is a mixed conductor, where the intergranular liquid channels can conduct both the oxygen ions and electrons[Reference Waseda and Toguri67] and the solid grains of ZnO conduct the electrons.[Reference Janotti and Van de Walle68, Reference Liu, Xu, Wang, Jiang, Wang, Li, Zhang, Zhao, Shan, Yao and Shen69]
Liquid volume fraction dependences of oxygen ion transference number of ZnO–15, 20, 25, and 30 wt.% Bi2O3 LGBS.
Figures 10 and 11 show the oxygen permeation fluxes through LGBS as a function of oxygen partial pressure difference and volume fraction of liquid, respectively. The oxygen permeation flux increases with volume fraction of liquid. As the volume fraction of liquid is in direct proportion to the Bi2O3 content [Fig. 2(c)], the oxygen permeation flux through LGBS increases with Bi2O3 content.
Dependences of oxygen permeation fluxes through ZnO–20 and 30 wt.% Bi2O3 LGBS (thickness 1.7 and 1.9 mm, respectively) on oxygen partial pressure difference at 800 °C.
Liquid volume fraction dependences of oxygen permeation fluxes through ZnO–15, 20, 25, and 30 wt.% Bi2O3 LGBS (thickness approximately 2 mm); P′O2 = 0.21 atm and P″O2 = 0.005 atm.
The calculated by Eq. (3) and the experimental values of oxygen permeation fluxes are of the same order of magnitude (Table 2), which shows that (at the LGBS thickness approximately 2 mm used in the present study) the oxygen permeation rate is controlled by ambipolar conductivity.

Prospects
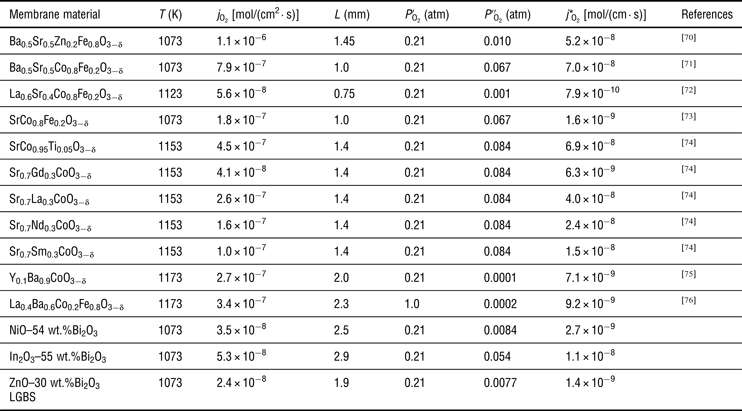
In order to compare the membrane material performances, the oxygen permeability (j*O2) was calculated by Eq. (4):
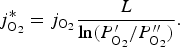 $$\,j_{{\rm O}_ 2 }^\ast = j_{{\rm O}_ 2 } \displaystyle{L \over {\ln \lpar P^{\prime}_{{\rm O}_ 2 } /P^{\prime \prime}_{{\rm O}_ 2 } \rpar }}.$$
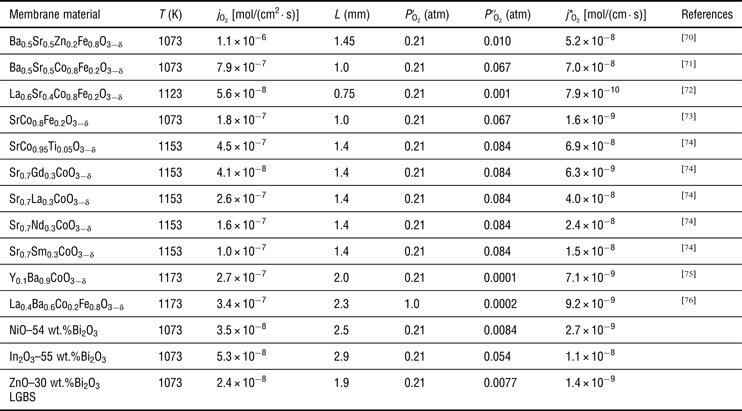
The values of oxygen permeability of In2O3–55 wt.% δ-Bi2O3 and NiO–54 wt.% δ-Bi2O3 ceramic composites and ZnO–30 wt.% Bi2O3 LGBS are comparable with that of the perovskite-type membrane materials (Table 3). However, the high oxygen permeability is just one of many material properties that are important for the ITM. The membrane material must combine good permeability with other properties such as high strength, low (or linear) thermal expansion, high resistance to reaction with CO2, etc.[Reference Bose, Stiegel, Armstrong, Halper, Foster and Bose1, Reference Pena and Fierro77–Reference Sunarso, Baumannb, Serrac, Meulenbergb, Liua, Lind and Diniz da Costaa79]
The oxygen permeability (j*O2) of same membrane materials.
Plastic LGBS materials are developing as an alternative to the brittle ceramic membrane materials. In order to assess the potential of LGBS as ITM, it is necessary to understand their ionic and electronic conductivities and how these, and their mechanical properties, are related to their composition and microstructure.
The development of materials with dimensions in the nanoscale range is a highly active area of research, because they often have different properties from the bulk materials. Restructuring simple ionic crystals at the nanoscale can alter their electrical properties.[Reference Chadwick80] In this connection, it is interesting to study the transport properties of liquid-channel grain-boundary nanostructures[Reference Belousov81] where the solid/liquid interfaces can contribute significantly in ionic conduction.[Reference Belousov40]
Acknowledgment
We thank RFBR and Presidium of the RAS for financial support.