Introduction
There has been intense research over the past several decades on developing materials and processes for organic electronics.[Reference Ward, Lamport and Jurchescu1–Reference Gao and Zhao3] While significant advances have been made in the synthesis of new materials, methods which can reliably deposit organic material at specific locations on a substrate and with controlled orientation are needed for practical development of organic electronic devices. Processes that make use of the flow during coating and drying have been shown to be effective at this, and are also attractive since they can be adapted to roll-to-roll coating methods.[Reference Patel and Diao4]
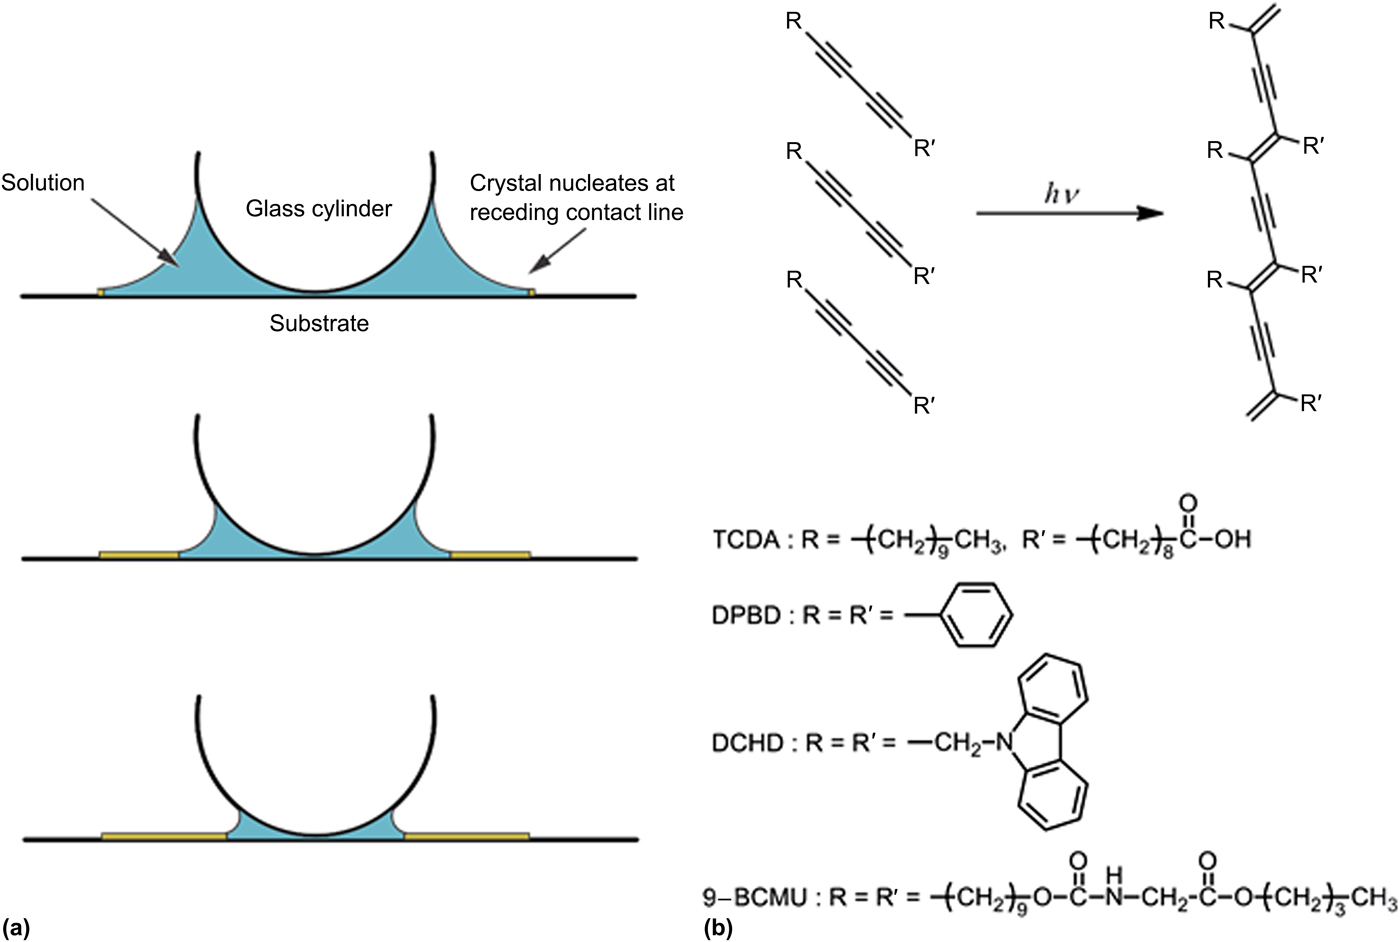
One such method, controlled evaporative self-assembly (CESA),[Reference Bi, He, Chen and Li5, Reference Han, Byun, Zhao, Rzayev and Lin6] has been shown to be effective for obtaining well-aligned nano- and micro-wires of organic crystals and polymers [see Fig. 1(a)]. In this method, the crystal or polymer aligns during solvent evaporation in the presence of capillary forces. These forces arise from the meniscus of the solvent made by a glass cylinder placed on top of the drying solution, similar to the conditions that occur during dip coating.[Reference Liu, Zhou, Wang, Peng, Wang, Pei and Cao7] CESA is similar to other methods in relying on the Marangoni flow to carry solute to a receding contact line, where it is deposited as a solid.[Reference Patel and Diao4]
(a) Schematic diagram of the CESA method, (b) schematic diagram of the polymerization of polydiacetylene and chemical structure of the monomers.

Polydiacetylene (PDA) [Fig. 1(b)] is a well-known semiconducting polymer that has been extensively studied for its interesting optical properties, in particular its strong optical non-linearity.[Reference Nakanishi and Kasai8, Reference Oikawa9] It has been used to create all-optical switches[Reference Camacho, Kar, Wherrett, Bakarezos, Rangel-Rojo, Yamada, Matsuda, Kasai and Nakanishi10] as well as organic field effect transistors.[Reference Lee, Aleshin, Kim, Lee, Kim, Wegner, Enkelmann, Roth and Park11–Reference Koyanagi, Muratsubaki, Hosoi, Shibata, Tsutsui, Wada and Furukawa14] PDA has the distinction of being able to be polymerized in the solid state after crystallization of the monomer.[Reference Wegner15] Here, we make use of this property in using CESA to create ordered and oriented ribbons of diacetylene (DA) monomer followed by photopolymerization. We show that polymers synthesized from the monomer 1,6-di(N-carbazolyl)-2,4-hexadiyne (DCHD) can easily form ribbons, while monomers with other side groups do not. In addition, we found that the method is highly dependent on the solvent, with samples prepared from acetone solution yielding regular arrays of ribbons, while samples prepared with other solvents yielded a variety of morphologies.
Materials and methods
The chemical structures of all monomers are shown in Fig. 1(b). 10,12-Tricosadiynoic acid (TCDA) and 1,4-diphenylbutadiyne (DPBD) were purchased from TCI. DCHD was purchased from Wako Chemicals. 9-BCMU (a (butoxycarbonylmethyl)urethane derivative, 10,12-docosadiyn-1,22-diyl bis(N-butoxycarbonylmethyl)carbamate) was synthesized from 10-undecyn-1-ol by the following two-step procedure found in the literature.[Reference Sandman, Samuelson and Velazquez16]
To 10-undecyn-1-ol (2.00 g, 11.9 mmol) and butyl isocyanateacetate (2.25 g, 14.3 mmol) in toluene (20 mL), three drops of dibutyltin dilaurate were added, and the mixture was stirred for 21 h at ambient temperature. Solvent of the reaction mixture was evaporated and the residue was purified by column chromatography (silica gel, chloroform:ethyl acetate = 9:1) to give 3.60 g (93%) of 10-undecynyl N-(butoxycarbonylmethyl)carbamate as colorless viscous oil. 1H NMR (400 MHz, CDCl3, δ) 0.93 (3H, t, J = 7.3 Hz), 1.25–1.43 (12H, m), 1.52 (2H, tt, J = 7.2, 7.2 Hz), 1.57–1.67 (4H, m), 1.95 (1H, t, J = 2.6 Hz), 2.18 (2H, td, J = 7.0, 2.6 Hz), 3.95 (2H, d, J = 5.7 Hz), 4.06 (2H, t, J = 6.6 Hz), 4.15 (2H, t, J = 6.6 Hz), 5.37 (1H, broad t); 13C NMR (100 MHz, CDCl3, δ) 13.48, 18.18, 18.85, 25.59, 28.26, 28.51, 28.76, 28.82, 29.01, 29.17, 30.36, 42.49, 65.06, 65.23, 67.98, 84.49, 156.55, 170.16.
10-Undecynyl N-(butoxycarbonylmethyl)carbamate (3.12 g, 9.59 mmol) in acetone (20 mL) was added to the mixture of copper(I) chloride (112 mg, 1.13 mmol) and N,N,N ′,N ′-tetramethylethylenediamine (125 mg, 1.08 mmol) in acetone (10 mL). Oxygen was bubbled through the mixture while it was refluxed for 20 h. Solvent of the reaction mixture was evaporated and the residue was recrystallized from chloroform–methanol mixture to give 2.35 g (76%) of 9-BCMU as colorless solid: Mp. 77°C; 1H NMR (400 MHz, CDCl3, δ), 0.94 (6H, t, J = 7.6 Hz), 1.22–1.44 (24H, m), 1.51 (4H, tt, J = 7.2, 7.2 Hz), 1.56–1.69 (8H, m), 2.24 (4H, t, J = 6.9 Hz), 3.96 (4H, d, J = 5.5 Hz), 4.07 (4H, t, J = 6.6 Hz), 4.16 (4H, t, J = 6.9 Hz), 5.17 (2H, broad t); 13C NMR (100 MHz, CDCl3, δ) 13.62, 18.99, 19.14, 25.74, 28.26, 28.75, 28.89, 28.95, 29.15, 29.28, 30.49, 42.65, 65.19, 65.26, 65.42, 77.47, 156.57, 170.21; Found: C, 66.65%; H, 9.38%; N, 4.20%; Calcd for C36H60N2O8: C, 66.64%; H, 9.32%; N, 4.32%.
The solvents acetone, 1,2-dichloroethane, acetonitrile, tetrahydrofuran (THF), dichloromethane (DCM), diethyl ether, and methyl acetate were purchased from Wako Chemicals with 99% purity or greater, and used without further purification.
Ribbons were grown on glass microscope slides. While surface treatment can often have a significant effect on the growth of crystals, the DCHD ribbon growth was robust: a test in which the glass substrates were washed twice with acetone, twice with distilled water, and treated with ozone plasma for 20 min prior to the sample deposition had no effect on the growth of the ribbons.
Acetone solutions of the DA monomers were made at concentrations of 0.5 mM unless otherwise noted. The CESA method was used to create oriented ribbons of the DA monomer. In this method, a 2.0 mm glass rod was lightly clamped onto a glass substrate. Thirty microliters of the solution was deposited at the interface between the rod and the substrate. Capillary forces pulled the liquid to the edges of the rod and substrate. For the acetone solutions, the samples were allowed to dry for 5 min, while for less volatile solvents the drying time was extended to 15 min. Following the drying step, the glass rod was removed and the samples were polymerized. Polymerization was done using UV irradiation with a central wavelength of 254 nm and an irradiance of approximately 1550 W/m2.
Optical images were taken using an Olympus BX51 in transmission mode. Powder x-ray diffraction patterns were measured using a Bruker D8 Advance diffractometer using Cu Kα radiation (wavelength λ = 1.5418 Å). Scanning electron microscopy (SEM) images were taken using a JEOL JSM-6700F instrument. Samples were coated with a thin layer of Pt prior to SEM imaging. UV-Vis absorption spectra were measured with a Cary 5000 UV-Vis-NIR spectrophotometer in transmission mode. Atomic force microscopy (AFM) images were collected using an NT-MDT NTEGRA Prima AFM in tapping mode.
Results and discussion
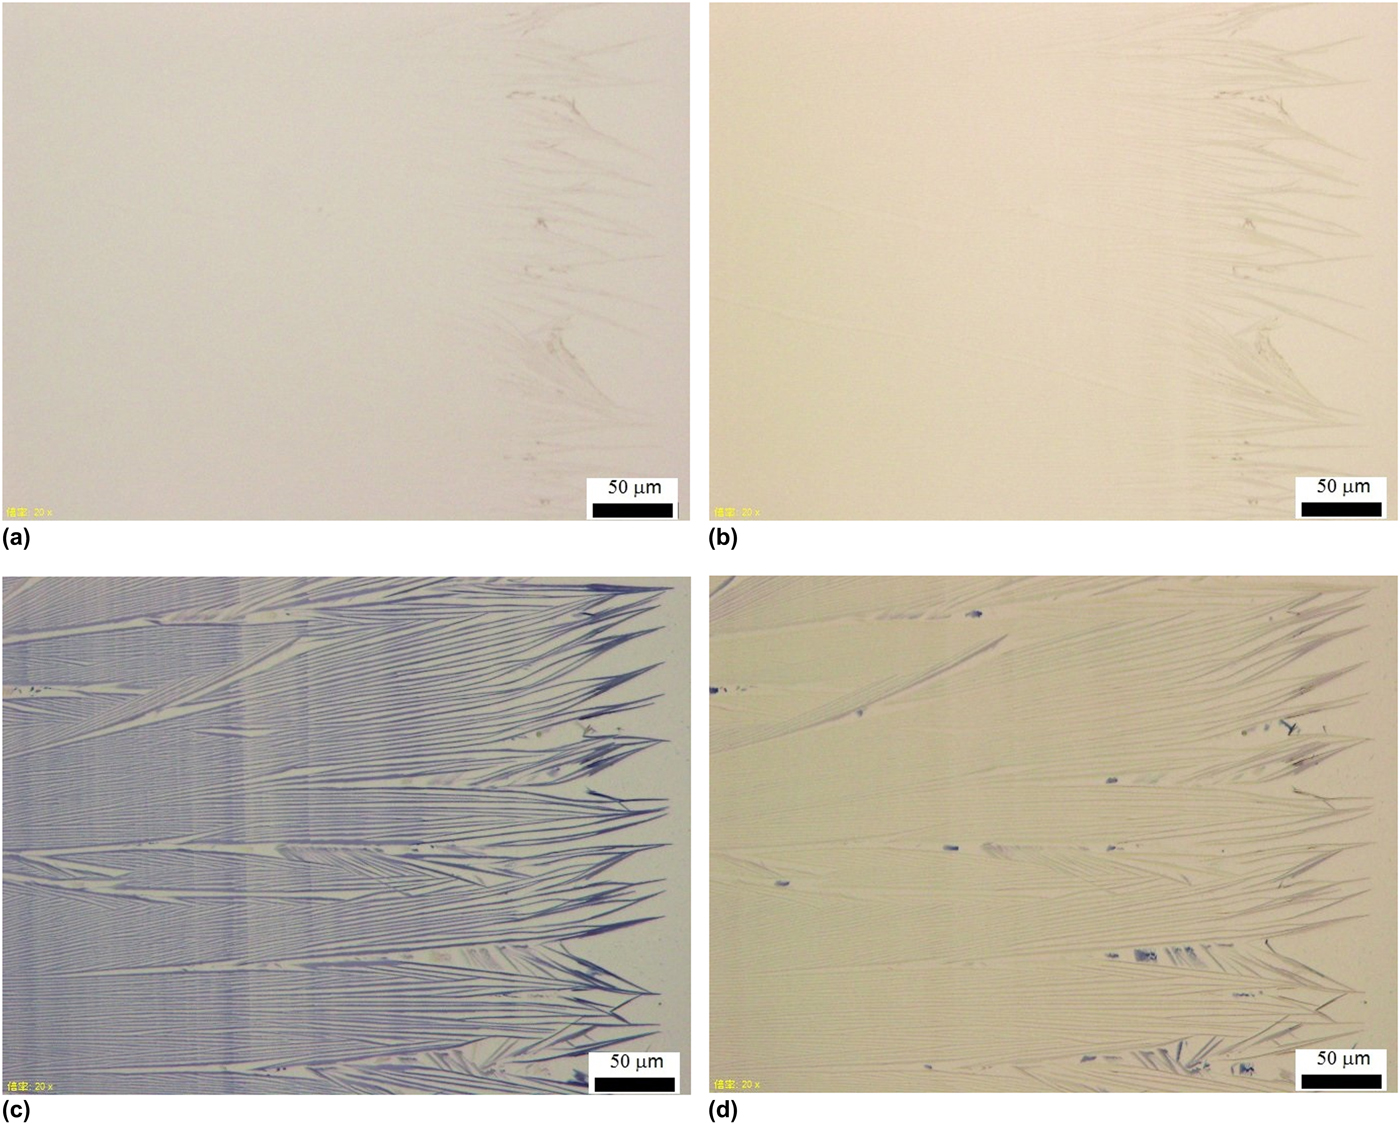
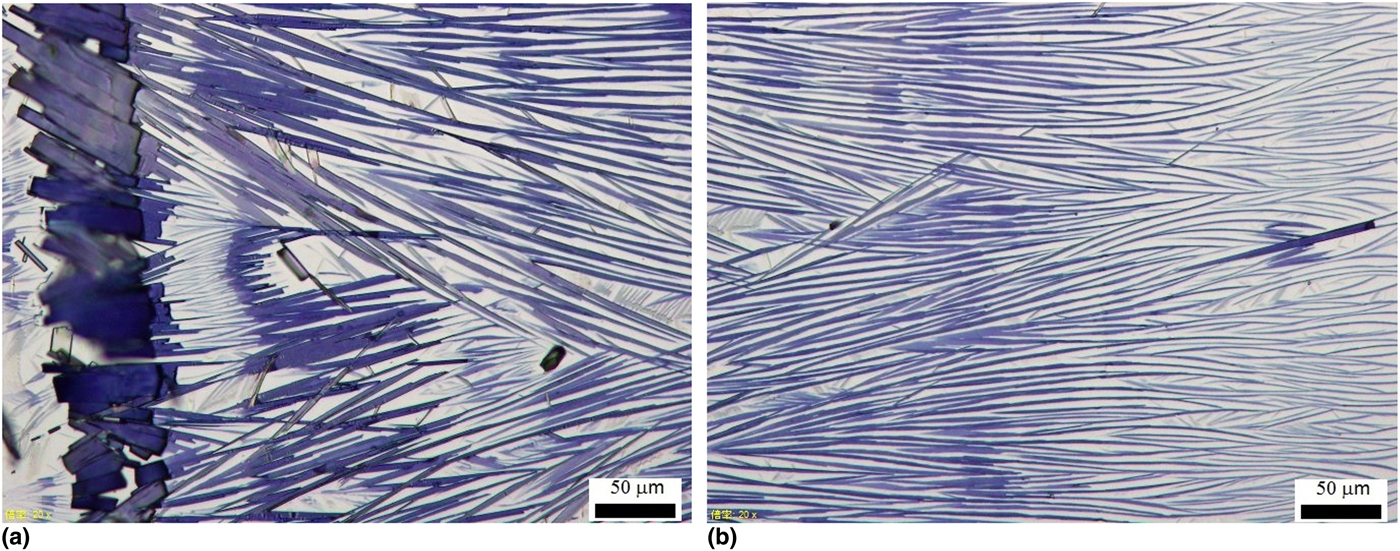
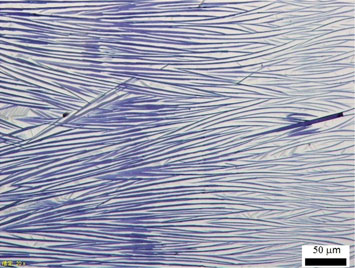
Optical images showed the formation of ribbons of the DCHD monomer, with ribbon widths between 1 and 2 µm and similar values for the distance between ribbons. This is not surprising; it has been shown that the dispersions of poly(DCHD) nanofibers (NFs) can be created using the reprecipitation method.[Reference Onodera, Oshikiri, Katagi, Kasai, Okada, Oikawa, Terauchi, Tanaka and Nakanishi17, Reference Iimori, Onodera, Kasai, Mitsuishi, Miyashita and Oikawa18] The length of the individual ribbons was on the order of 100s of micrometers, giving the aspect ratios of 50–100. After polymerization, the ribbons become much clearer in the images, but only when the polarization of the incident light was parallel to the axis of the ribbons, displaying a large amount of anisotropy, as shown in Fig. 2. The size and separation of the ribbons remained after polymerization. The ribbons were much thinner than wide: AFM scans showed thicknesses on the order of 40–70 nm (Supplementary Fig. S1). The ribbons extended over a region of approximately 1 mm. Significant branching of the ribbons was observed, similar to the case when ribbons are formed from molecular charge transfer crystals.[Reference Bi, He, Chen and Li5] Despite the branching and terminations, the ribbons display a relatively narrow range of widths and approximately regular spacing. This has been attributed to the effects of Marangoni flow in cylinders perpendicular to the receding contact line, which transports and deposits material into these regularly spaced regions.[Reference Maillard, Motte, Ngo and Pileni19, Reference Ma, Dong, Horn, Hao and Van Horn20] The DCHD monomers in this case crystallized with the b-axis coinciding with the ribbon axis, and can be easily converted to polymer through UV irradiation.[Reference Enkelmann21] SEM images (Supplementary Fig. S2) confirmed the size and structure of the poly(DCHD) ribbons.
Images of DCHD and poly(DCHD) ribbons; (a) DCHD ribbons (before polymerization) with incident polarization parallel to the long ribbon axis; (b) DCHD ribbons with incident polarization perpendicular to the long ribbon axis; (c) poly(DCHD) ribbons (after polymerization) with incident polarization parallel to the long ribbon axis; (d) poly(DCHD) ribbons with incident polarization perpendicular to the long ribbon axis. The motion of the contact line was from left to right.

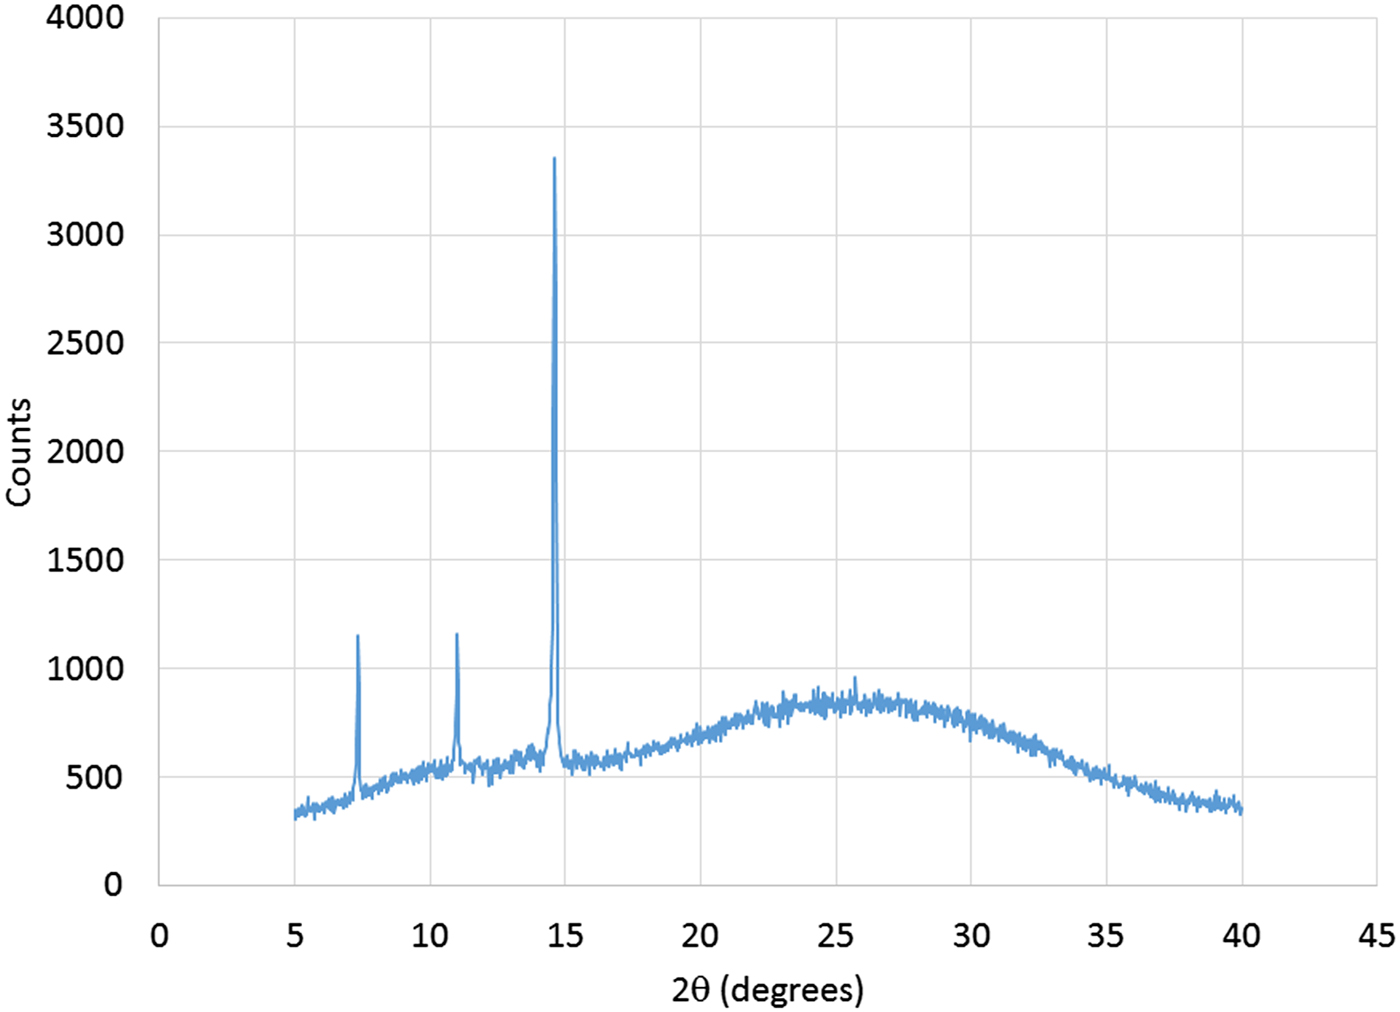
Powder x-ray diffraction measurement of the samples, shown in Fig. 3, displayed peak characteristics of poly(DCHD).[Reference Tashiro, Nishimura and Kobayashi22, Reference Chung, Kwon, Oikawa, Kasai and Nakanishi23] XRD data for PDA are given in the Supplementary material (Fig. S3) for PDA NFs, PDA bulk crystal, and DA crystals. The three diffraction peaks at 2θ = 7°, 11°, and 14° in Fig. 3 are almost the same as those of PDA NFs within experimental error. The peak at 2θ = 14° in Fig. 3 is strong, relative to others, due to the anisotropic orientation of the PDA ribbons. The broad diffraction peak from 20° to 30° is likely due to the glass substrate (Supplementary material Fig. S4). The (111) diffraction peak (not observed) may be embedded in the amorphous peak originating from the glass substrate.
Powder XRD of a poly(DCHD) ribbon film.

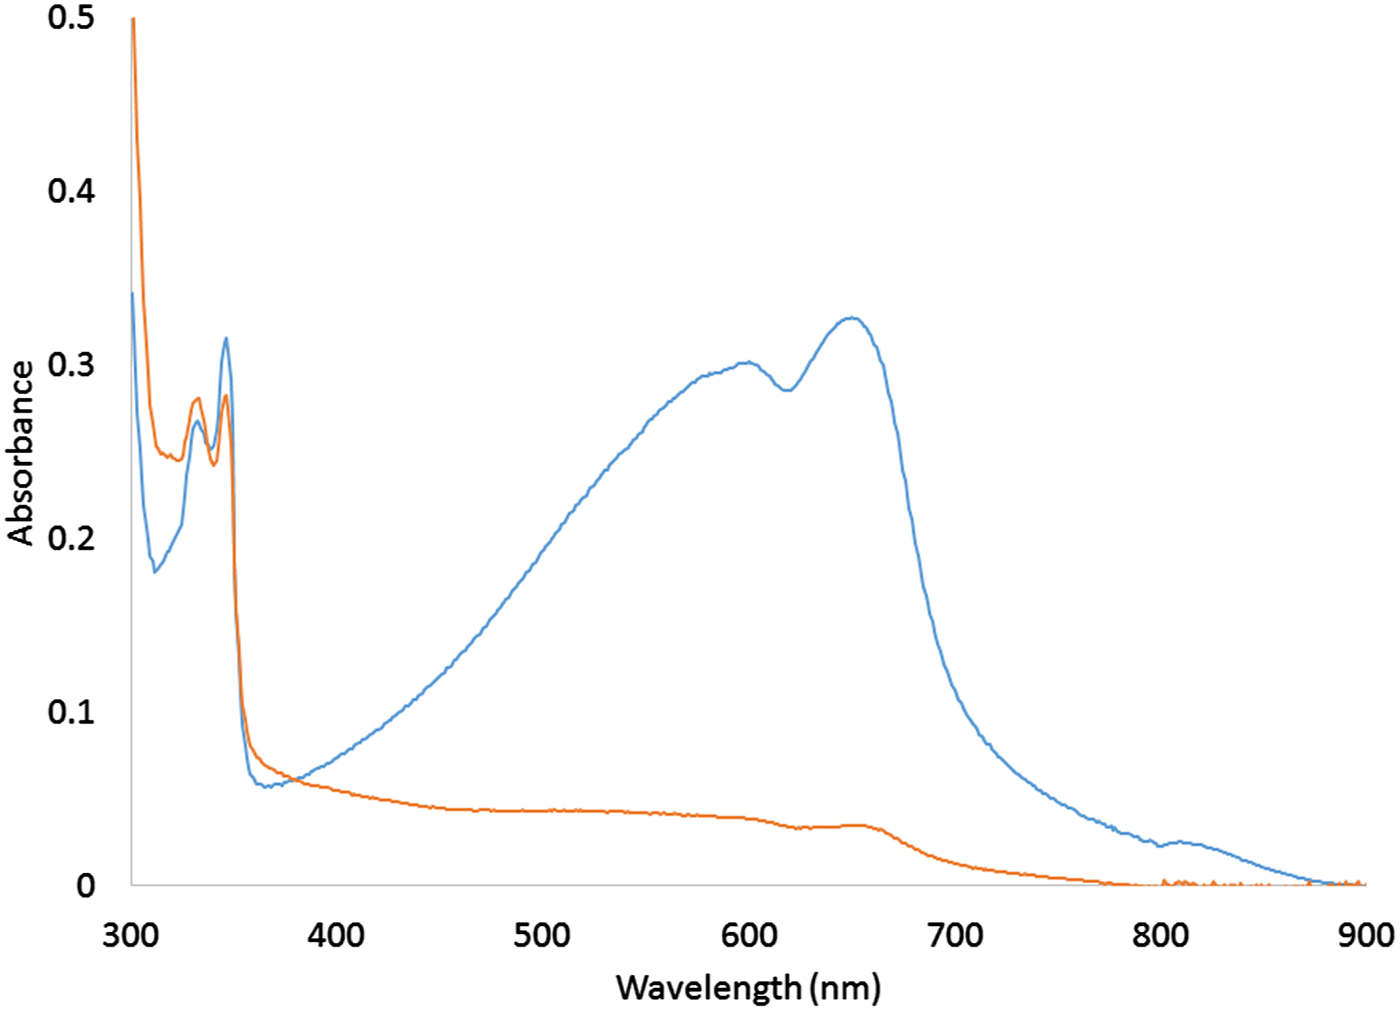
The UV-Vis absorption spectrum of the poly(DCHD) ribbons shown in Fig. 4 displays the absorption in the 500–700 nm range characteristic of PDA, including the excitonic absorption peak at 650 nm, which was somewhat smaller than in bulk, fully polymerized crystals of poly(DCHD).[Reference Hood, Muller, Eckhardt, Chance and Yee24] The ribbons also showed a large degree of orientation. This led to a strong linear dichroism, as seen in the figure, with a value for the dichroic ratio  $D = \alpha _\parallel /\alpha _\bot $ of 9.5 at the excitonic absorption peak (λ = 650 nm), giving a value for the order parameter
 $$S = \displaystyle{{D-1} \over {D + 2}}$$
Absorption spectra of poly(DCHD) ribbons. Blue curve: polarization parallel to the long ribbon axis, orange curve: polarization perpendicular to the long ribbon axis.

equal to 0.74. Some level of disorder can clearly be seen in the image in Fig. 2, which would explain the value of the order parameter. This disorder may be due to interactions of the DCHD monomer with the surface of the glass substrate.
The concentration of the DCHD monomer had a significant effect on the structure of the resulting poly(DCHD) ribbons. Increasing the concentration induces regions in the films near the initial location of the contact line that contained thick ribbons that were almost continuous, i.e., with very small spacing between the ribbons (see Fig. 5). These were followed by regions that resembled those found in the lower concentration samples. It is likely that the large deposit of solid material at the start of the process results in a drop in the solute concentration, leading to the similar structures.
Two regions of a 10.3 mM sample; (a) near the position of the initial contact line; (b) near the glass rod (end of ribbon growth). The motion of the contact line was from left to right.

Decreasing the concentration led to little changes in the widths of the ribbons, but in larger spacing between them (Supplementary Fig. S5). Decreasing concentration also led to lower orientational order, greater curvature in individual poly(DCHD) ribbons, and less regular spacing between them.
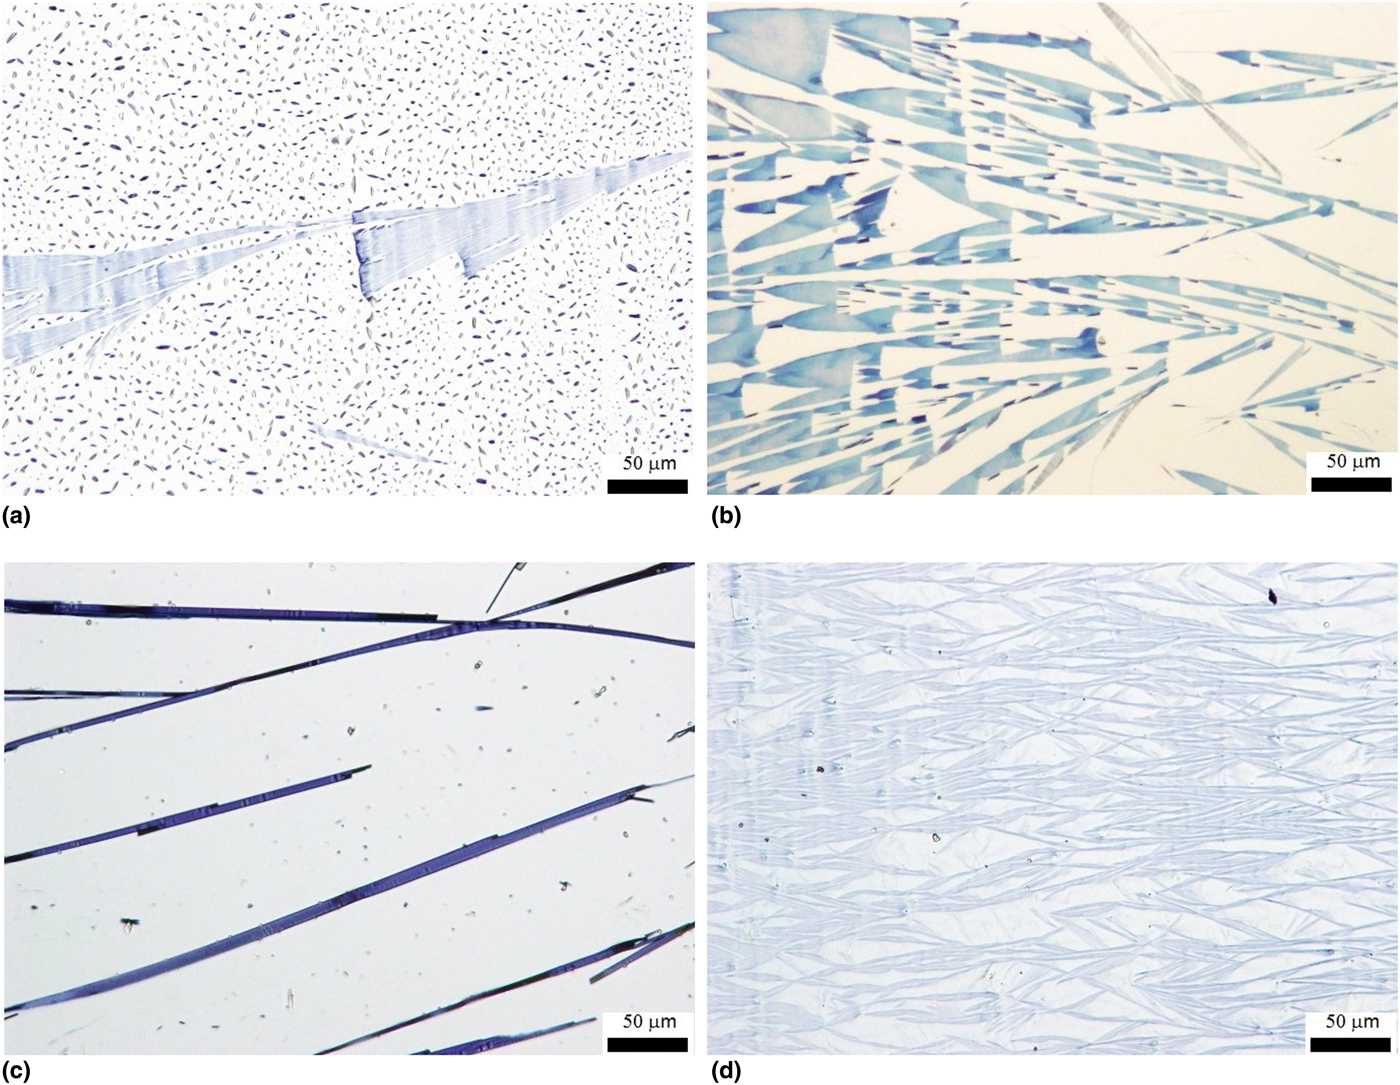
The largest effect on the formation of the poly(DCHD) ribbons was due to the solvent. Models have been developed that predict the length scales of the Marangoni flow, which dictates the pattern of deposition of the monomer.[Reference Maillard, Motte, Ngo and Pileni19, Reference Ma, Dong, Horn, Hao and Van Horn20] These length scales depend on solvent parameters such as viscosity and thermal diffusivity as well as temperature gradients across the solution. Acetone seems to be an ideal solvent for ribbon formation at room temperature; numerous other solvents showed no ribbon formation, although the monomer is crystallized and could be polymerized, as shown in Fig. 6.
Poly(DCHD) prepared from solutions in (a) DCM, (b) 1,2-dichloroethane, (c) THF, and (d) diethyl ether. The motion of the contact line was from left to right.

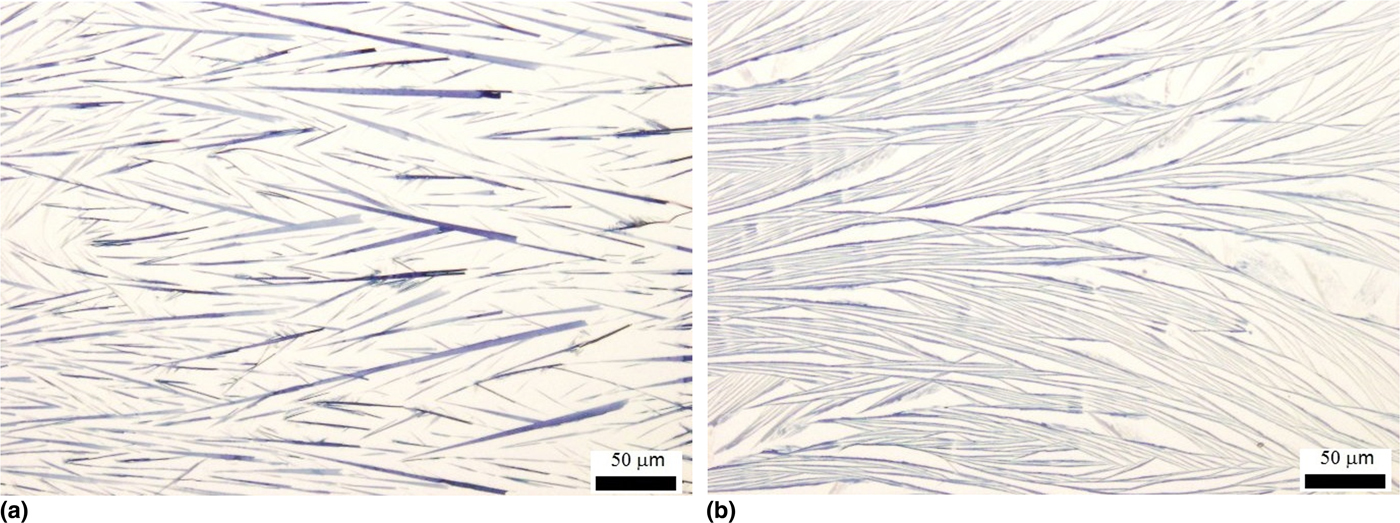
Samples prepared from acetonitrile and methyl acetate, which had viscosities and thermal diffusivities close to those of acetone, were closest in terms of ribbon morphology, as seen in Fig. 7.
Poly(DCHD) ribbons prepared from acetonitrile (a) and methyl acetate (b). The motion of the contact line was from left to right.

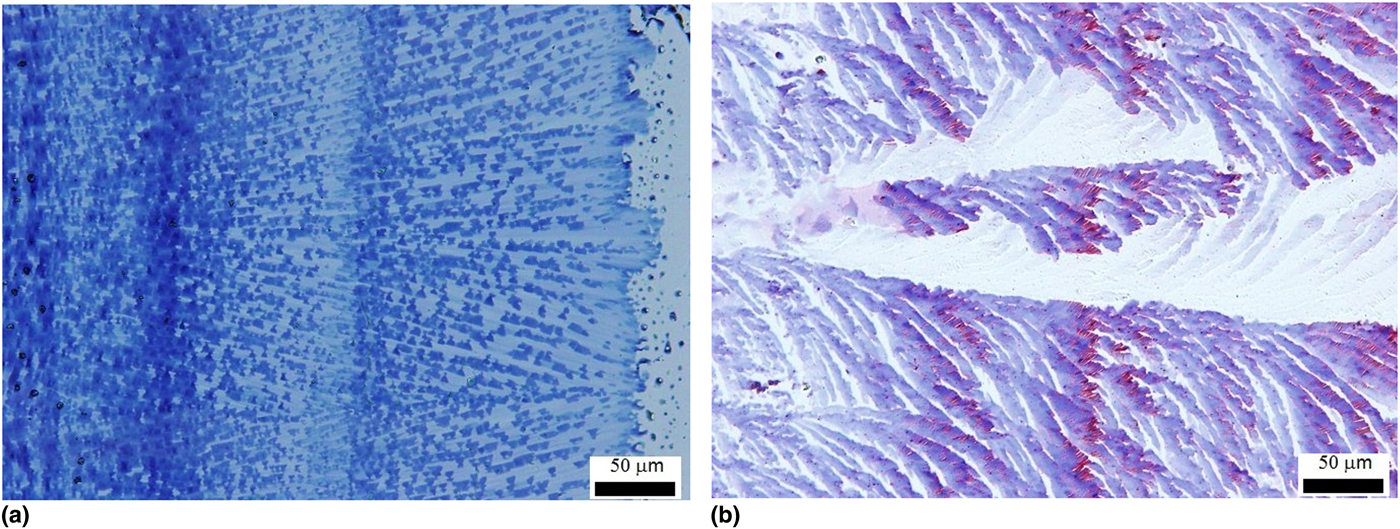
Ribbons of other types of PDAs could not be produced. Figure 8 shows the images of poly(9-BCMU) and poly(TCDA). Crystals of the 9-BCMU and TCDA monomer did form, and could be subsequently polymerized. However, while structures formed during CESA showing some effect from the receding contact line and Marangoni effect, the individual ribbons that were observed for poly(DCHD) did not form in poly(9-BCMU) or poly(TCDA). The DPBD only formed an amorphous sheet, which did not display the color changes associated with solid-state polymerization, although DPBD is known to form stable crystals.[Reference Enkelmann21, Reference Wiebanga25] The poly(TCDA) showed both the blue and red phases.[Reference Tieke, Bloor and Young26] Although ribbons were not obtained, there was a considerable degree of orientation, as characterized by optical dichroism. We surmise that the intermolecular packing interaction between DA monomers is stronger than the interaction with the substrate, so that the polymerizable-ordered crystal state is formed during the CESA process. The ability of poly(DCHD) to form good ribbons is likely due to the side group further stabilizing the monomer self-assembly.[Reference Iimori, Onodera, Kasai, Mitsuishi, Miyashita and Oikawa18]
Optical images of poly(9-BCMU) (a) and poly(TCDA) (b). The motion of the contact line was from left to right.

Conclusions
We have shown that the method of CESA can be used to create oriented ribbons of a DA monomer, which can then be polymerized in the solid state to give ribbons of the PDA, i.e., poly(DCHD). The ability to create these ribbons was sensitive to both the monomer structure and the solvent used. This method may be useful for producing structures which could easily be incorporated into devices such as organic field effect transistors.
Supplementary Material Available: AFM measurements of ribbon thickness, SEM images of polymer ribbons, PXRD spectra of bulk and nanocrystal polymers, PXRD of the substrate, optical images of ribbons formed at different concentrations.
Supplementary Material
The supplementary material for this article can be found at https://doi.org/10.1557/mrc.2018.201