Introduction
Contact angle hysteresis (CAH) is defined as the difference between the advancing and receding contact angles of a liquid droplet, which is immersed in a gas environment (normally the air), advancing or receding on a solid substrate. In general, CAH is understood to be mainly caused by the topological roughness, defects, and/or chemical heterogeneity of the substrate.[Reference Eral, ‘t Mannetje and Oh1] A specific study of water–ethanol mixtures on micro-patterned substrates reveals that at different conditions of surface tensions and micro-patterns: (i) the advancing contact angle does not change much, and however, (ii) the receding contact angle largely varies because the receding mode is greatly affected by the formation process of the micro-capillary bridges connecting the nearby micro-structures.[Reference Dufour, Harnois, Thomy, Boukherroub and Senez2] More experimental results indicate that the advancing and receding processes are not the reverse of each other, but are quite different events that correspond to totally different activation energies.[Reference Gao and McCarthy3]
Because of the topologically and chemically heterogeneous complexity involved in CAH, modeling the phenomena of CAH is a challenge. The original Young's equation can only predict the equilibrium contact angle based on force balance at the contact line:

where θ Y is the equilibrium contact angle, also called the Young's angle, and γ is the surface tension between two substances. The subscript L represents liquid, S solid, and V vapor. (In latter parts of this paper, σ is also referred to γ LV for simplicity.) Gibbs et al.[Reference Gibbs, Bumstead and Van Name4] suggested that line tension, in the same manner of surface tension, is the free energy along the contact line. Based on Gibbs' concept, Boruvka and Neumann[Reference Boruvka and Neumann5] modified the Young's equation with an additional term of line tension to compute a non-equilibrium contact angle under the influence of line tension:

where θ is the non-equilibrium contact angle, γ SLV is the line tension (in units of joules per meter), κ gs = 1/r is the geodesic curvature of the three-phase contact line, and r is the radius of the contact line.
The modified Young's equation (Eq. (2)) indicates that line tension may result in a dynamic contact angle between the receding and advancing angles. However, theoretical studies[Reference Gershfeld and Good6] revealed that the thermodynamic line tension was too small to cause CAH. To account for CAH, Good and Koo,[Reference Good and Koo7] for the first time in the literature, introduced the concept of pseudo-line tension to represent the chemically heterogeneous effect of polar sites on a polymer surface. The concept of pseudo-line tension was extended to explain CAH on topologically heterogeneous surfaces.[Reference Drelich and Miller8–Reference Drelich, Miller and Good10]
In the same modified Young's equation (Eq. (2)), using a pair of pseudo-line tensions on the advancing and receding conditions whose absolute values are more than one order of magnitude larger than the theoretical values of line tensions,[Reference Amirfazli and Neumann11] CAH can be captured at different droplet sizes and between different pairs of liquidsolid.[Reference Good and Koo7–Reference Drelich, Miller and Good10] However, the modified Young's equation cannot be used directly in computational fluid dynamics simulations, because the pseudo-line tensions represent extreme advancing or receding conditions. In other words, Eq. (2) cannot produce a transient dynamic contact angle between the advancing and receding angles in a dynamic process.
Previously, He and coworkers[Reference Azimi, He, Rohrs and Yao12] developed a dynamic slip boundary model in the continuum approach composed using the Navier–Stokes (N–S) equation and studied CAH on micro-patterned, hybrid surfaces. In this paper, the pseudo-line tension is incorporated into a formally developed slip boundary model to capture CAH dynamics on flat surfaces with nanoscale topological and/or chemical heterogeneity. The inclined plate method is used to measure the advancing and receding angles as well as the critical roll-off conditions. Continuum simulations have been tested for four droplet sizes ranging from 4 to 30 µL on a flat polytetrafluoroethylene (PTFE) substrates. Numerical results have been compared with experiments, and good agreements have been found.
Experimental setup
In this study, we examine a water droplet sitting on a horizontal or inclined flat surface at room temperature. The droplet volumes used in this study are 4, 10, 20, and 30 µL, and are deposited and measured using a manual syringe. An experimental system was built for the sliding-angle measurement, which consisted of a rotation stage sub-system and an image capturing sub-system as shown in Supplementary Fig. S1. The dynamic images of droplets were captured using a high speed camera.
The PTFE substrate was used after being cleansed in an ultrasonic bath with acetone for 5 min and rinsed with ethanol, isopropyl alcohol, and de-ionized water. The dynamic images of droplets were recorded after placing each droplet on the corresponding surface at room temperature. Then, the surface was slowly inclined until the droplet began to move. The sliding angle was determined when the droplet started to roll off the surface. The angle values were obtained by averaging 15 measurements per sample.
Numerical models and methods
N–S slip boundary model
Assuming that the substrate surface is rigid, this problem is an incompressible two-phase flow, with no-slip or slip boundary conditions on the solid surface and far-field conditions on the boundary of the air domain. The no-slip boundary condition is valid in most regions on the solid surface except for on the contact line. To model the contact line dynamics with the CAH on a flat surface, we propose adding a pseudo-line tension term in our previously developed dynamic slip boundary model

where ρ is the fluid density, u s is the slip velocity of the contact line, t is time, $\hat{ {\bi {t}}}_{{\rm CL}}$ is the tangential direction of the solid surface meanwhile normal to the contact line, $\nabla _\rm w^2$
 the 2D Laplacian operator on the solid surface, β is the friction coefficient of the contact line, τ is the regular fluid stress tensor, $\hat{{\bi {n}}}$
 is the normal direction of the solid surface, σ Y is the unbalanced Young's stress to be explained in the following section, and δ c is the delta function of the contact line. Note that the gravity is neglected because the contact line scale is small.
Equation (3) is a two-dimensional N–S equation written on the direction of $ {\hat {\bi t}}_{{\rm CL}}$ , with the pressure gradient and gravity being neglected. Although there is a sharp jump of pressure across the contact line due to surface tension, the pressure gradient on either side of the contact line is small. Equation (3) is used in the region on and near the contact line (δ c > 0), while the no-slip condition is used elsewhere (δ c = 0) on the solid surface. The details of the numerical methods used in this paper can be found in our previous paper.[Reference Azimi, He, Rohrs and Yao12]
Defining static pseudo-line tensions for CAH
The unbalanced Young's stress, σ Y, in Eq. (3) is σ Y = σ(cosθ Y − cosθ) − γ SLVκ gs, which is derived from the modified Young's equation (Eq. (2)) through moving its the left-hand side to the right-hand side

where γ LV is replaced as σ for simplicity (σ ≡ γ LV). In Eq. (4), let us call the first term the transient Young's stress, i.e., σ ts = σ(cosθ Y − cosθ), and the second term, γ SLVκ gs, the pseudo-line stress. Because the Young's angle, θ Y, is between the receding angle, θ r, and the advancing angle, θ a, i.e., 0° <θ r <θ Y <θ a <180°, we have

The transient contact angle is between θ r and θ a, i.e., θ r ≤ θ ≤ θ a, thus

Substituting Eq. (6) into Eq. (4), we have

where σ(cosθ Y−cosθ r) < 0 and σ(cosθ Y−cosθ a) > 0 based on Eq. (5). The mode of the contact line motion can then be determined based on the value of σ ts

Based on the theoretical and experimental studies of CAH and pseudo-line tensions,[Reference Good and Koo7–Reference Drelich, Miller and Good10] our hypothesis of the unbalanced Young's stress is that there exist two extreme pseudo-line tensions so that if the transient Young's stress is within the two bounds, we always have the unbalanced Young's stress to be balanced, i.e., if (γ SLVκ gs)r ≤ σ ts ≤ (γ SLVκ gs)a, then

where (γ SLVκ gs)r < 0 is the extreme receding stress and (γ SLVκ gs)a > 0 is the extreme advancing stress. The two extreme stresses are calculated using the following equations:

The unbalanced Young's stress will be nonzero only when σ ts goes beyond the two bounds in Eq. (9)

That is to say, the contact line will be driven to advance only when the transient Young's stress overcomes the maximum advancing stress and to recede only when the transient Young's stress overcomes the maximum receding stress; both motions are marked as the contact line is depinned. Otherwise, the contact line is pinned, but the contact angle can be altered between θ r and θ a. Equations (9)–(11) define the actual unbalanced Young's stress, σ Y, used in Eq. (3). Thus, the static pseudo-line tensions are defined, which enables the dynamic simulations of CAH. Note that the pseudo-line tensions defined in this study are static values in both receding and advancing modes, which correspond to the extreme pinning conditions immediately before the occurrence of a depinning event. Dynamic pseudo-line tensions, which correspond to the sliding conditions of a depinned contact line, will be investigated in our future studies.
Results and analysis
Droplets on a horizontal plate
To validate the new slip boundary model (note that modifications have been made to resolve the CAH compared with our previous work[Reference Azimi, He, Rohrs and Yao12]) and to calibrate the pseudo-line tensions, a water droplet of different sizes on a horizontal or inclined surface at room temperature has been studied in both experiments and simulations. Simulation configurations are included in Supplementary Materials. When placing a water droplet on a horizontal flat plate of PTFE as shown in Supplementary Fig. S2, the droplet forms a spherical shape, if the Bond number (Bo = ρgD 2/σ) is small (Bo < 1); and with Bo increasing over 1, the droplet is flattened by gravity. In spite of the droplet's overall shape, an equilibrium contact angle, θ Y = 101.93°, is averaged from all measurements for all of the four volumes. This averaged equilibrium angle is treated as the Young's angle of the water/air/PTFE system in this study. Note that the droplet size effect on the equilibrium contact angle is not obvious here. Simulation results match well with the experiments.
Droplets on a tilted plate
When gradually inclining the substrate, the liquid/gas interface slowly evolves to adapt the directional change of gravity. Because of the nanoscale roughness and defects of the substrate, the contact line is kept pinned on the substrate during the tilting process. Thus, the CAH occurs: the advancing contact angle, θ a, appears on the lower side of the contact line, and the receding contact angle, θ r, appears on the upper side. With the tilting angle increasing, small droplets, such as 4 and 10 µL studied in this paper, can always keep stationary even on a vertical substrate, while large droplets such as 20 and 30 µL start to slide down when a critical tilting angle is reached. (The critical tilting angle is also called the critical roll-off angle.)
Advancing and receding stresses
Based on our experimental equilibrium, advancing and receding angles at four droplet sizes, the advancing and receding stresses, (γ SLVκ gs)a and (γ SLVκ gs)r, are computed using Eq. (10) and shown in Supplementary Fig. S3. Using the same equation, the advancing and receding stresses of the same water/air/PTFE system computed from Good and Koo's experiments[Reference Good and Koo7] are also shown in Supplementary Fig. S3. The two sets of experimental data are close but not the same, because different methods have been used: (i) Good and Koo [Reference Good and Koo7] used the sessile drop method and (ii) we use the tilted plate method. The two methods are expected to yield different results.[Reference Eral, ‘t Mannetje and Oh1] Although both have different advantages and disadvantages, the tilted plate method is selected here, because it is recognized as an excellent method to distinguish the high and low hysteresis.[Reference Pierce, Carmona and Amirfazli13] The advancing and receding stresses used in our simulations as shown in Supplementary Fig. S3 are calibrated using the trial-and-error method starting from our experimental values, which will be explained in the following subsections.
Small droplets on a vertical plate
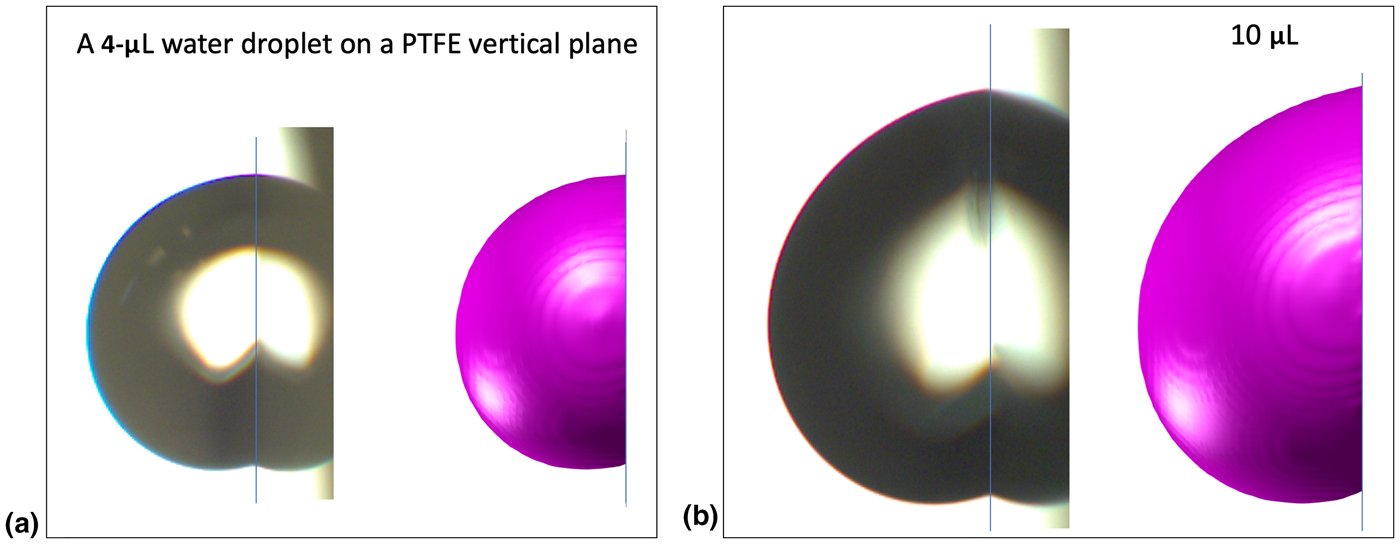
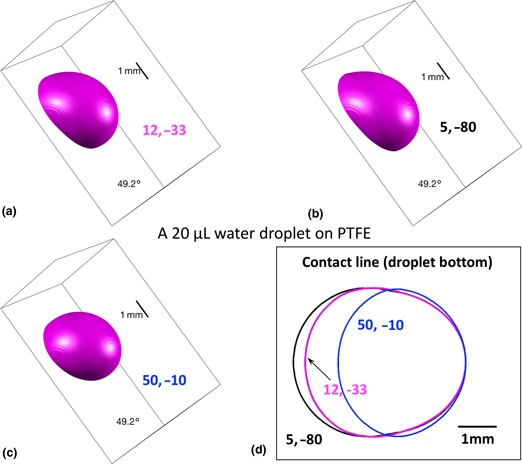
The small droplets do not roll off the plate even when the plate is tilted to the vertical position, because the critical advancing and receding stresses are not reached. It is obvious that the droplet weight plays a role in the tilted plate measurement. Since the critical stresses are not reached, sufficiently large advancing and receding stresses are used in simulations, i.e., (γ SLVκ gs)a = 12 mN/m and (γ SLVκ gs)r = −33 mN/m. Figure 1 shows the surface contours of a 4 µL droplet and a 10 µL droplet on a vertical plate. The simulation results match well with the experiments. However, the studies of small droplets cannot tell what the actual values of the advancing and receding stresses are. Larger droplets are needed to be studied.
Experimental and simulation contours of a water droplet on an inclined PTFE plate with the droplet size: (a) 4 µL and (b) 10 µL on a vertical plate.

A 20 µL droplet on a tilted plate
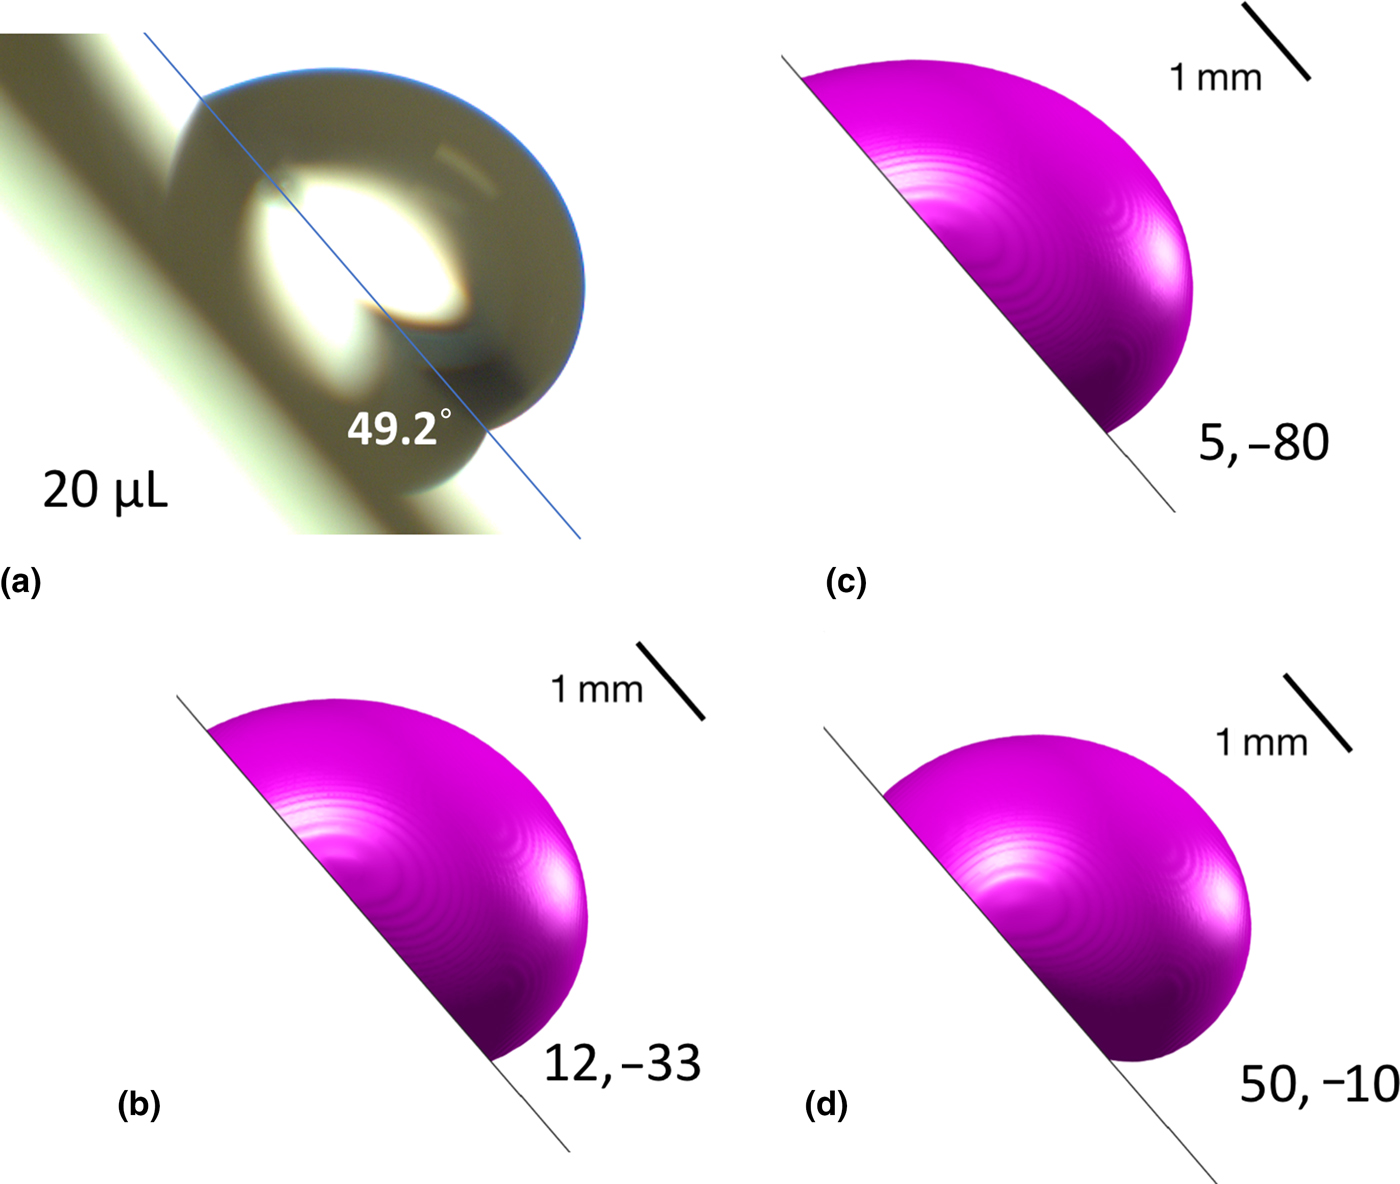
Before tilting the plate, a 20 µL droplet is in its resting shape as shown in Supplementary Fig. S2c. The tilting process goes slowly at about 1° per second, and both or one side (advancing and receding sides) of the contact line is pinned all the time before the critical roll-off moment is reached. The tri-phase system can be considered as quasi-static. A 20 µL droplet cannot stay stationary on a vertical plate, and its critical roll-off angle is 49.4° on average in our measurements. Figure 2(a) shows one of the measurements, whose critical roll-off angle is 49.2°, and which is the closest case to the average value. To find the advancing and receding stresses, different values have been tested and compared with experiments. Figure 2(b) shows the droplet contour of a simulation with (γ SLVκ gs)a = 12 mN/m and (γ SLVκ gs)r = −33 mN/m, which are not far from our experimental values as shown in Supplementary Fig. S3. (Note that the accuracy range of the advancing and receding stresses is ±0.5 mN/m for simulations of 20 and 30 µL droplets.) The computed contour, advancing and receding angles match well with the experiment, and moreover, the critical roll-off angle in the simulation are found the same as in the experiment.
A 20 µL water droplet on a 49.2° tilted PTFE plate immediately before the roll-off event: (a) the experimental image (b) a simulation with (γ SLVκ gs)a = 12 mN/m and (γ SLVκ gs)r = −33 mN/m, (c) (γ SLVκ gs)a = 5 mN/m and (γ SLVκ gs)r = −80 mN/m, and (d) (γ SLVκ gs)a = 50 mN/m and (γ SLVκ gs)r = −10 mN/m.
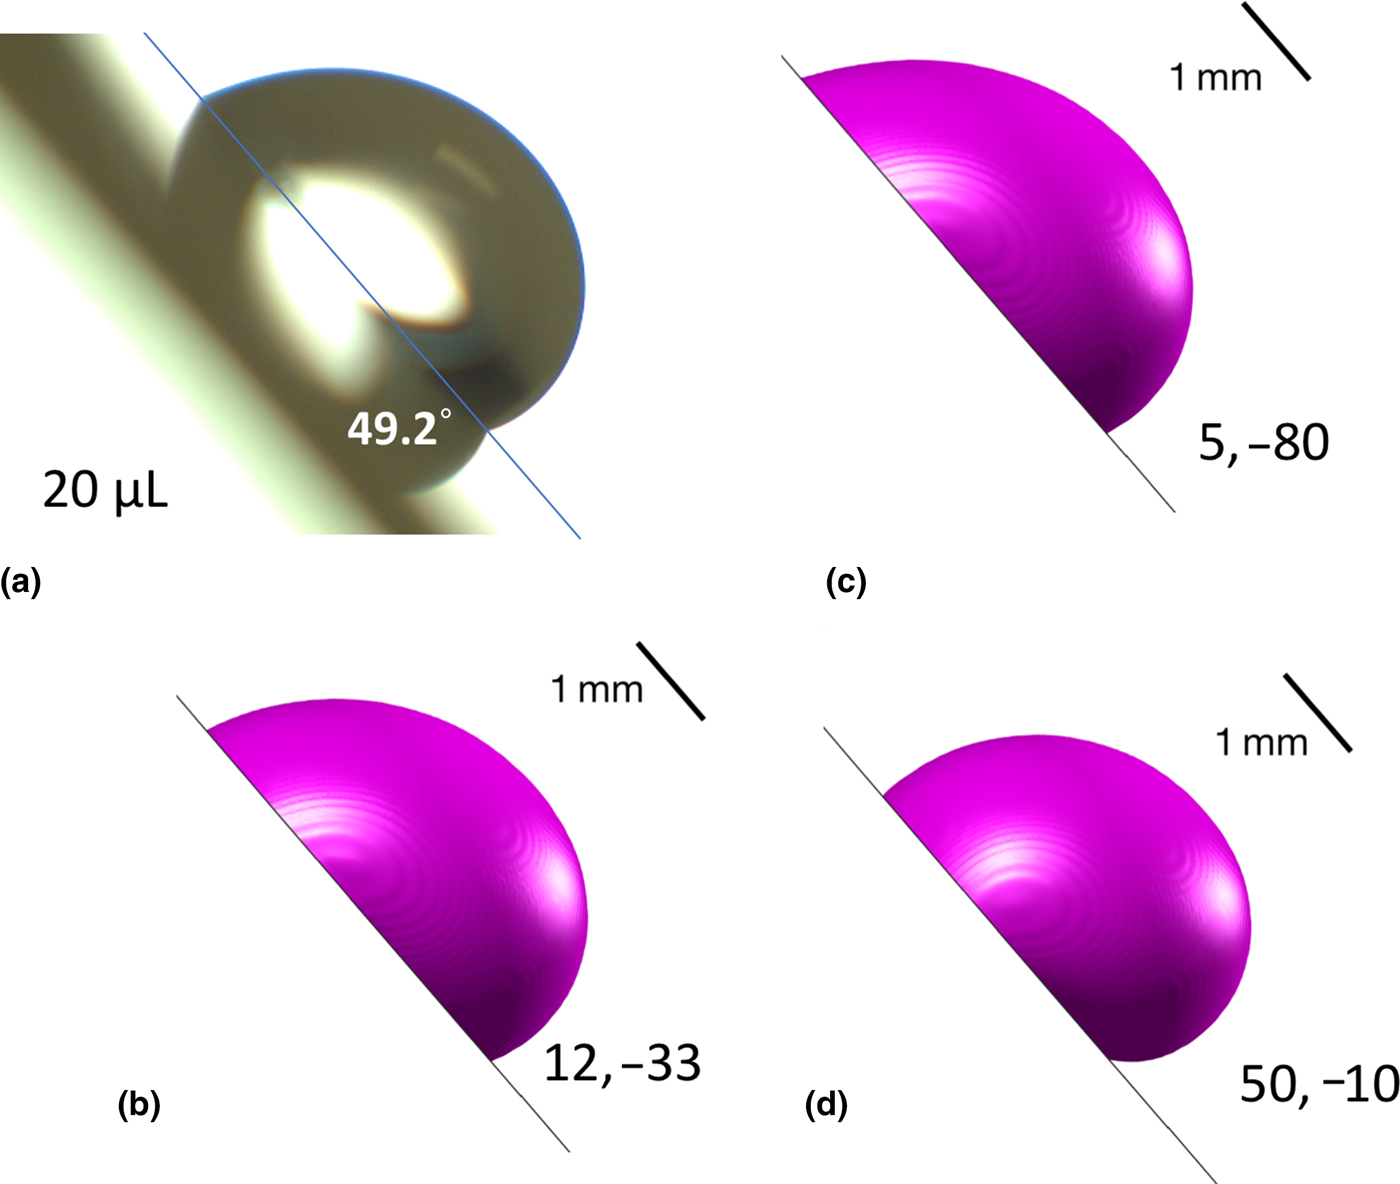
To validate whether the advancing and receding stresses in Fig. 2(b) are the unique stress pair, more stress pairs are tested in simulations, and two of them are shown in Fig. 2(c), (γ SLVκ gs)a = 5 mN/m, (γ SLVκ gs)r = −80 mN/m, and in Fig. 2(d), (γ SLVκ gs)a = 50 mN/m, (γ SLVκ gs)r = −10 mN/m. These two in Figs. 2(c) and 2(d) are two extreme conditions: (i) heterogeneity of strong adhesion on the receding site in Fig. 2(c) and (ii) heterogeneity of strong adhesion on the advancing site in Fig. 2(d). Both cases yield droplet contours far away from the experiment, and both droplets do not roll off the plate at the tilting angle of 49.2°. Especially, we note that when (γ SLVκ gs)a−(γ SLVκ gs)r < 45 mN/m, the 20 µL droplet will roll off the 49.2° tilted plate; otherwise, the droplet will keep stationary. Supplementary Figure S4 shows an enlarged view of the droplet image with three simulation contours, which vividly depicts how the advancing and receding stresses affect the droplet contour: a large receding stress will elongate the droplet, while a large advancing stress will thicken the droplet height vertical to the plate. A small change of either or both the advancing and receding stresses will alter the droplet contour and deviate it from the experimental shape. Thus, we conclude that the values of 12 and −33 mN/m are the unique pair for the case of a 20 µL water droplet on this specific PTFE plate.
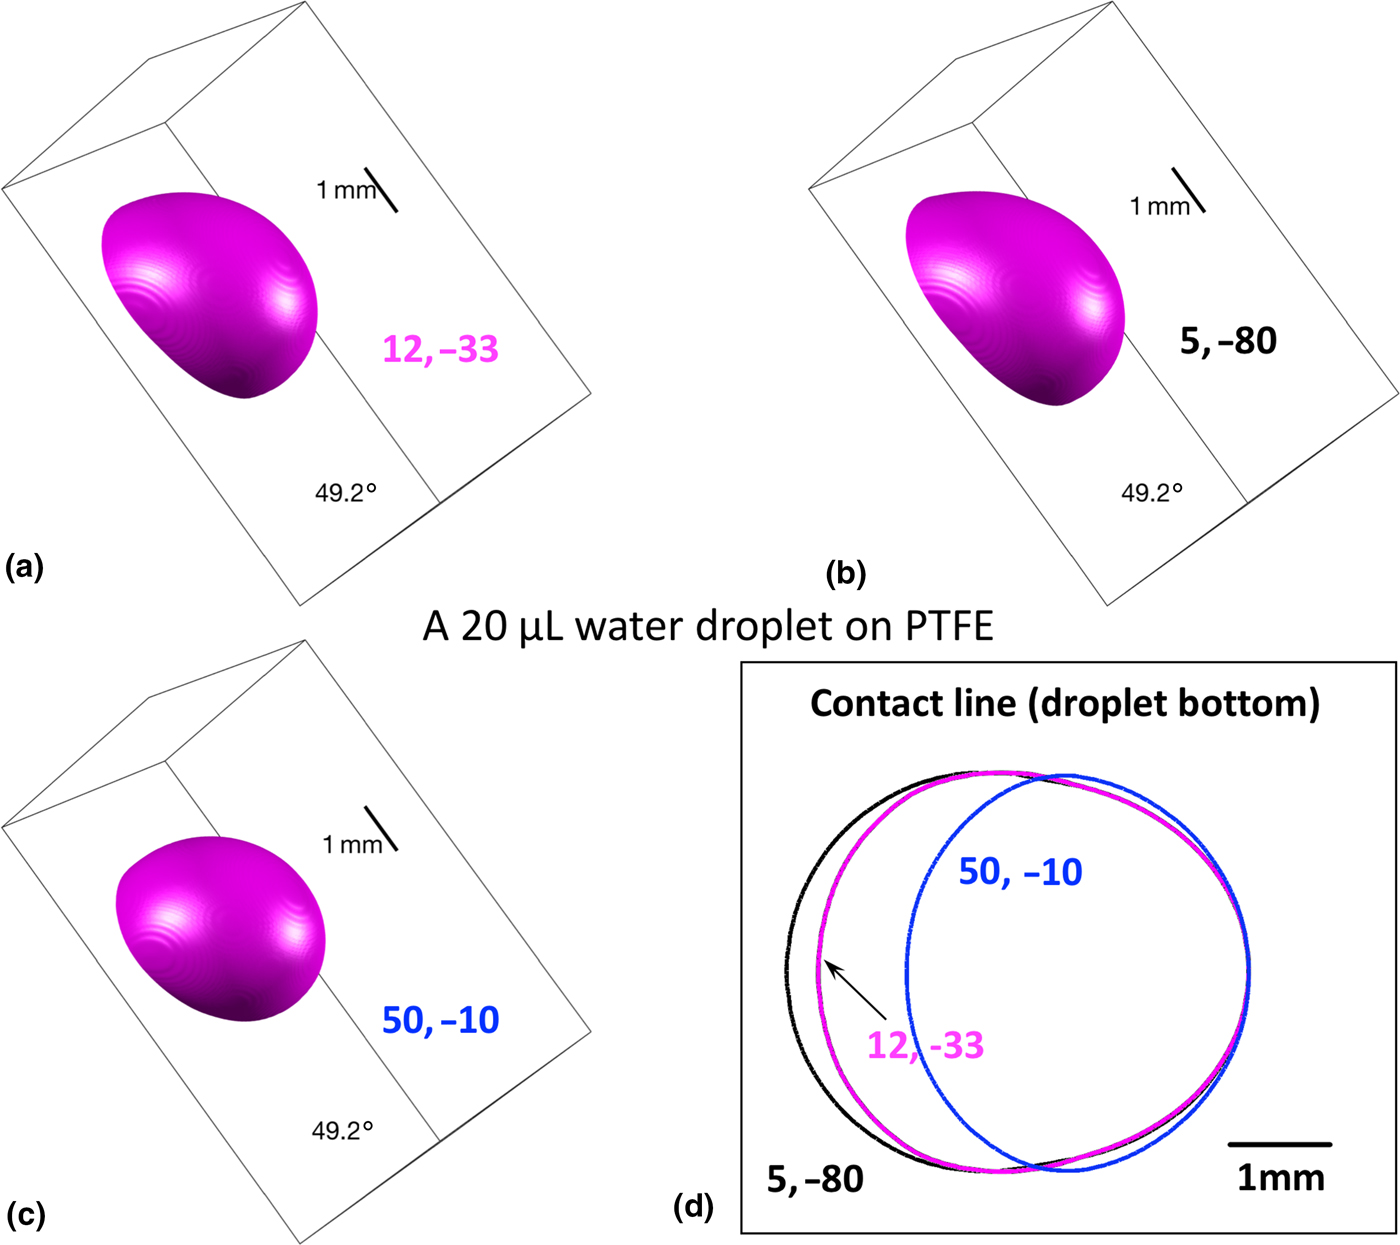
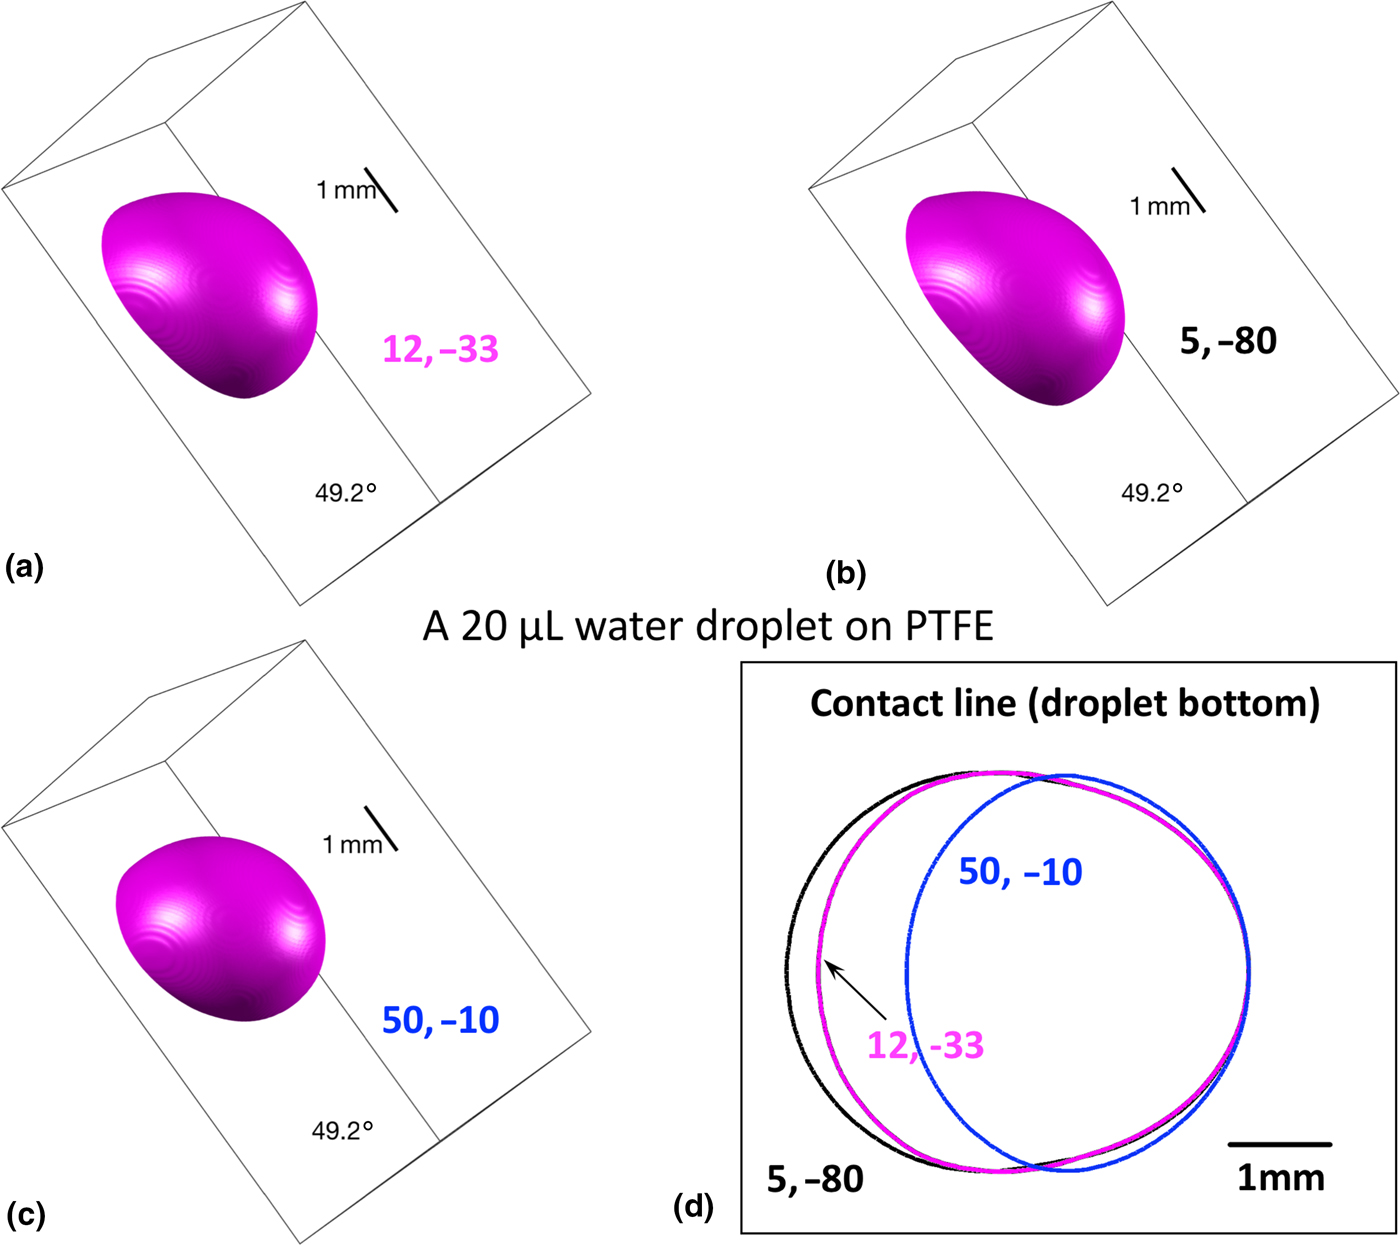
Figure 3 presents the three-dimensional contours and top view of the contact line for the same cases in Fig. 2. The results demonstrate the advantage and capability of our numerical simulations, as these details cannot be easily captured in experiments because of light scattering. Note that with different stress pairs, the contact line contour differs in length, but has almost the same width.
Three-dimensional view of the 20 µL droplets on the 49.2° tilted PTFE plate: (a) (γ SLVκ gs)a = 12 mN/m and (γ SLVκ gs)r = −33 mN/m, (b) (γ SLVκ gs)a = 5 mN/m and (γ SLVκ gs)r = −80 mN/m, (c)(γ SLVκ gs)a = 50 mN/m and (γ SLVκ gs)r = −10 mN/m; and (d) the top view of the droplet/plate contact lines in (a–c).
A 30 µL droplet on a tilted plate
A 30 µL droplet has a much smaller critical roll-off angle than the 20 µL droplet presented in the previous subsection, because the droplet weight increases. The average critical roll-off angle is 22.6° for 30 µL, and thus, the experimental case, whose critical roll-off angle is 22.4°, is employed in simulations. Supplementary Figure S5 shows the droplet contours of the experiment and simulations of three stress pairs. The unique stress pair for the 30 µL droplet case is (γ SLVκ gs)a = 10 mN/m and (γ SLVκ gs)r = −14 mN/m, which matches the experimental contour and critical roll-off angle at the same time. The same trend is observed for the 30 µL droplet as for the 20 µL one, that is a larger receding stress elongates the droplet (see Supplementary Fig. S5c) and a larger advancing stress thickens its height (see Supplementary Fig. S5d). The critical roll-off stress is (γ SLVκ gs)a−(γ SLVκ gs)r < 24 mN/m, which is less than a half of that in the 20 µL case. The critical roll-off stress is possibly proportional to the lateral component of the droplet weight parallel to the plate. If we assume so, that is

where m = ρV is the droplet mass, g = 9.81 m/s2, θ cr the critical roll-off angle, and V the droplet volume. Since g and ρ are constant, we have (γ SLVκ gs)a − (γ SLVκ gs)r ∝ V sinθ cr. For the 20 µL case, Vsinθ cr = 15.1 μL; and for the 30 µL case, Vsinθ cr = 11.4 μL. The deviation of the two cases is slightly above 30%, which is not small but reasonable, because the assumption of Eq. (12) is a simple addition of the advancing and receding stresses, while in reality, the advancing or receding stress, which is the transient stress, σ ts, defined in the subsection of defining static pseudo-line tensions for CAH, varies along the contact line. The line integration of σ ts along the contact line will be the actual value proportional to Vsinθ cr.
Supplementary Figure S6 shows an enlarged view of the experimental image of the 30 µL droplet with simulation contours of four stress pairs, i.e., (10 mN/m, −14 mN/m), (14 mN/m, −10 mN/m), (3 mN/m, −80 mN/m), and (50 mN/m, −5 mN/m). Although (14 mN/m, −10 mN/m) is not far from to the correct stress pair, its contour plotted in red clearly deviates from the experimental shape. Supplementary Figure S7 presents the three-dimensional view of the droplet contours at (10 mN/m, −14 mN/m), (3 mN/m, −80 mN/m), and (50 mN/m, −5 mN/m) and their top view of the contact lines.
Equilibrium, advancing and receding contact angles
The experimental and simulation results of contact angles are presented in Supplementary Fig. S8. Error bars are shown for experimental data, while our simulations do not have an obvious error, since the continuum model itself is a deterministic system. The hysteresis in the experiments of 4, 10, 20, and 30 µL droplets are 16.7°, 29.3°, 32.3°, and 21.7°, respectively. Our simulation results agree well with the experiments, and most numerical contact angles fall into the experimental ranges, except for the advancing contact angle in the 20 µL case, whose value is just slightly below the lower bound. In addition, a water droplet on a copper substrate has been studied experimentally and numerically in this paper. Experimental and simulation results of 4, 10, 20, and 30 µL water droplets are presented in Sect. 8 of the Supplementary Material. Our simulation results match well with the experiments.
Discussions on pseudo-line tensions
As introduced in the subsection of defining static pseudo-line tensions for CAH, the pseudo-line tensions, γ SLV, are used to capture the CAH caused by the nanoscale topological and/or chemical heterogeneity on the solid surface. Because the interaction of the contact line on the solid surface varies at different situations—e.g., different droplet sizes, tilting angles of the plate, and receding or advancing mode—the pseudo-line tension cannot be treated as a material property but rather as a mode coefficient. It can be categorized as a liquid–solid friction coefficient, which can also be thought of as an analogy to the solid–solid friction. However, the physical model of the former is much more complicated than the latter. We do not yet have a constitutive relation established for the pseudo-line tension, neither in the literature nor in this paper. This pioneering study only explores the pseudo-line tensions at several specific fluid/solid interacting modes and conditions.
Because of unstable behaviors in computing the geodesic curvature, κ gs, the pseudo-line stress, γ SLVκ gs, is treated as one quantity, whose unit is the same as surface tension. Literature data reveal that in general, the pseudo-line stress is independent on the droplet radius, especially when the droplet is large.[Reference Good and Koo7] Our simulations also yield satisfactory results compared with experiments, although it is still unknown to us whether the two quantities should be calculated separately. Nevertheless, treating γ SLVκ gs as one is a good practice in the state-of-the–art continuum modeling.
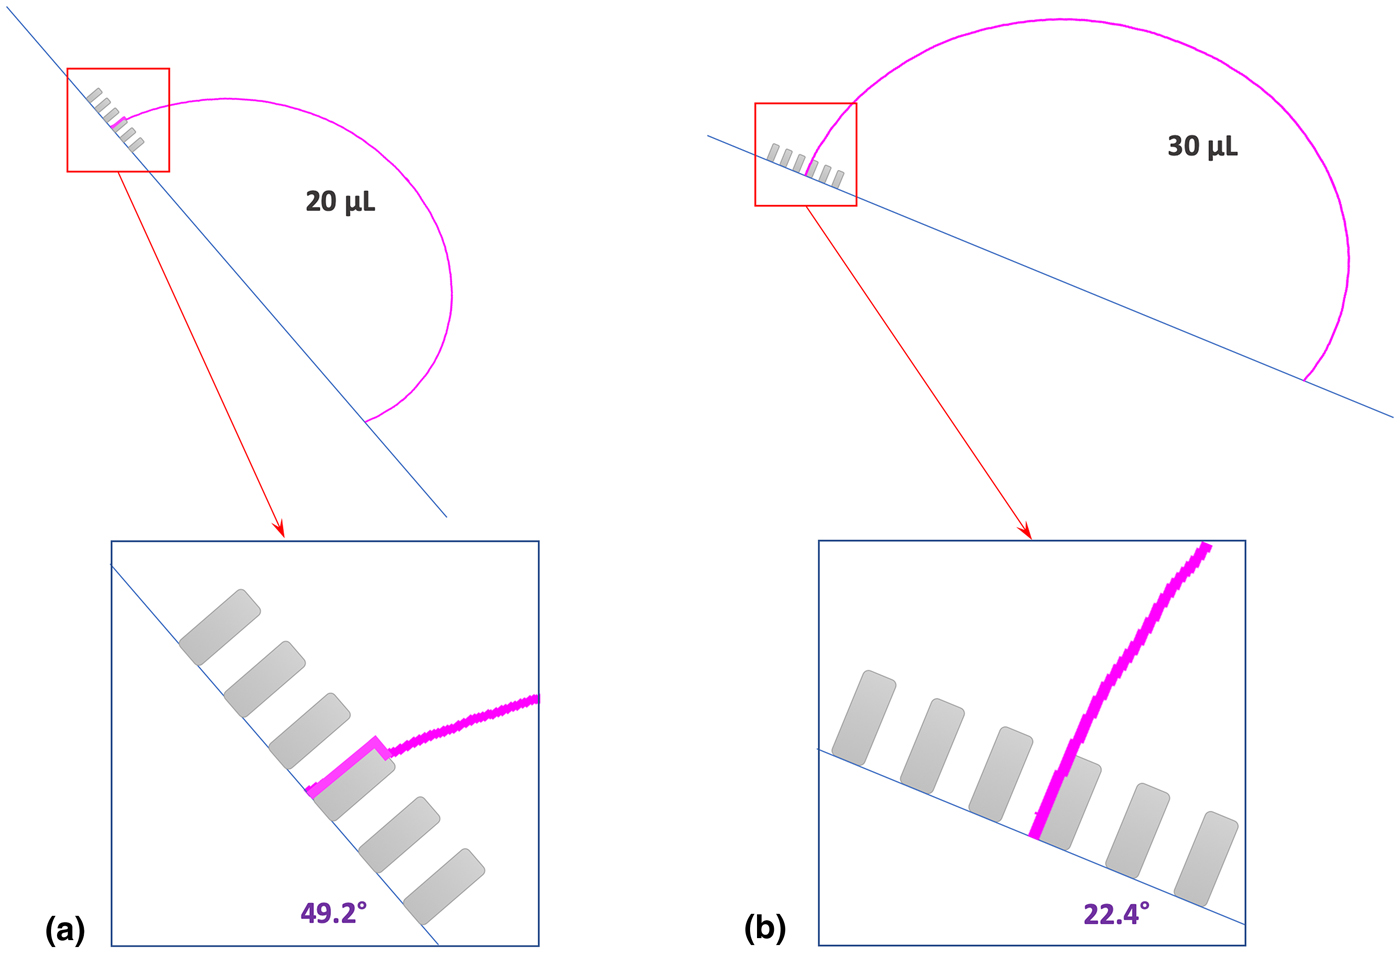
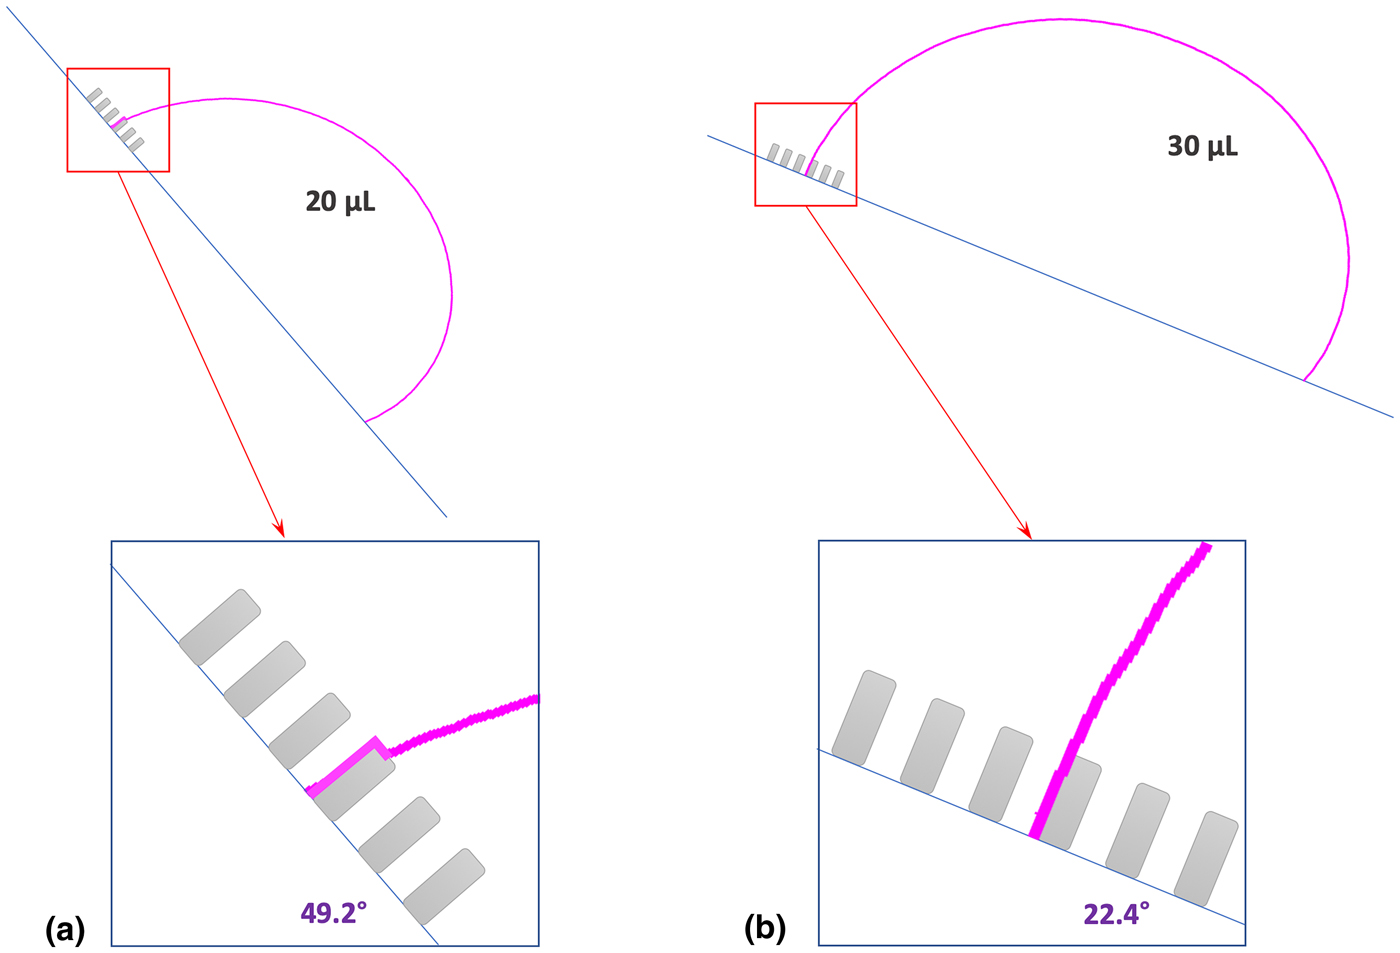
The advancing stress of the 20 µL case is close to that of 30 µL; however, the receding stress of the 20 µL case (that is −33 mN/m) is much larger than that of the 30 µL case (−14 mN/m). Why is the receding stress of the 30 µL case less than 45% of the 20 µL case? It should be related to the large tilting angle in the 20 µL case. Figure 4 illustrates possible interactions between the droplet and the plate. The pillared pattern is used only to illustrate the randomly distributed, nanoscale roughness on the PTFE plate. Because the roughness size is in the nanoscale, the wetting condition shall be in the Wenzel state. The illustration shows that the 20 µL case has more liquid–solid contact areas than the 30 µL case, and as a result, the 20 µL case will have a larger receding stress.
Illustration of possible interactions between the droplet and the plate (whose roughness is on the nanometer scale) in (a) the 20 µL case, and (b) the 30 µL case. The droplet contours are in magenta, and the pillared patterns in gray are used to represent the nanoscale roughness, which are not structured for the PTFE plate used in this study. However, the pillared pattern drawn here is only used for the illustration purpose.
Concluding remarks
A N–S-type slip boundary model for the contact line dynamics has been developed in our previous work.[Reference Azimi, He, Rohrs and Yao12] In this paper, our model is extended to capture CAH using the advancing and receding pseudo-line tensions, which represent either or both the topological and chemical heterogeneity in the nanoscale on a solid surface. Based on the pseudo-line tensions, the advancing and receding pseudo-line stresses are calibrated using the tilting plate method through comparisons between simulations and experiments. Four droplet volumes from 4 to 30 µL have been rigorously experimented and simulated. Good agreements have been found between simulations and experiments for all the contact angles and critical roll-off angles. Moreover, this study reveals that pseudo-line tension is not a material property, but a mode coefficient. The pseudo-line tension varies at the advancing and receding modes, droplet sizes, and tilting angles. Future studies are needed to develop a constitutive relation between pseudo-line tension and the interacting mode. The new model developed in this paper can be utilized to model a liquid droplet interacting with hierarchical surfaces, in which the microscale roughness is modeled as the domain boundary and nanoscale roughness is modeled using pseudo-line tensions.
Supplementary material
The supplementary material for this article can be found at https://doi.org/10.1557/mrc.2019.92.
Acknowledgments
The authors acknowledge the 2018 Research Enhancement Grant (REG) Award at LU for supporting this research. This work was also supported by the Center for Advances in Port Management (CAPM) at Lamar University. We acknowledge the Texas Advanced Computing Center (TACC) at UT Austin for funding computational hours (grant #G-819854). We thank the Center for Innovation, Commercialization and Entrepreneurship (CICE) at Lamar University. We greatly appreciate Dr. Hsing-Wei Chu and Mr. Paul Latiolais for discussions and encouragement. We thank the IT Infrastructure Department at LU for hosting our HPC cluster and especially thank Mr. Chad Smith for helping us on the HPC maintenance.