Introduction
The role of rechargeable batteries in energy conservation and storage is vital to the progression of technologic advancements. The primary requirements when constructing rechargeable batteries are reversibility, energy storage capability, and power output. These properties are majorly based on the composition of the batteries and also the reactions happening at their interfaces. Batteries, regardless of their chemistry, are composed of several electrochemical cells, each having opposing electrodes separated by an electrolyte.[Reference Dunn, Kamath and Tarascon1] Generally, an electrolyte is extensively responsible for the redox reactions that occur at the interfaces, and thus its preparation is a vital step in constructing a battery. It acts as a medium providing a path for the movement of ions between the electrodes during the charge–recharge cycles. The dependence of battery performance on the electrolyte layer has led to vast and varied research for decades. Conventional batteries utilize liquid electrolytes, most often a solution of dissociated ions, along with a separator that is cast and soaked. The presence of a separator, a component required of liquid electrolyte batteries, adversely affects the performance by adding electrical resistance and consuming more space in the system.[Reference Sun, Liu, Gong, Wilkinson and Zhang2] The use of liquid electrolytes, due to their relatively low ionic resistance, accounts for a number of performance and safety issues present in rechargeable batteries; some of which include insufficient lifetime, high cost, low power density, and dendrite formation leading to battery failure.[Reference Gray and Gray3–Reference MacCallum and Vincent6] Said hindrances associated with the liquid-based systems have propelled research in the realm of rechargeable battery technology to explore new possibilities.
Recent literature promotes the use of a solid electrolyte in place of its liquid counterpart, as it has shown to be much safer, have a higher energy density, longer life cycle, lower costs, and is easier to fabricate.[Reference Sun, Liu, Gong, Wilkinson and Zhang2,Reference Meyer7–Reference Goodenough10] Various polymers such as poly(vinyl sulfone), poly (acrylic acid) (PAA), polyethylene oxide (PEO), polyethylene glycol, polyvinyl alcohol (PVA), gelatin, polymethyl-methacrylate, poly(vinylpyrrolidone), and poly(vinylidene fluoride) were explored for preparing electrolytes.[Reference Tsuchida, Ohno and Tsunemi11–Reference Girish Kumar and Sampath30] Relatively high values of ionic conductivity (σ i) were already reported by various groups for various systems; however, most of their preparation processes are complex, and time and energy intensive (in terms of temperatures used for drying).
Our study focuses on the preparation of thin, flexible gel electrolyte primarily using nanofiber cellulose (NFC) hydrogel with minute amounts of various additives by using an energy-efficient method. As published in our earlier study of preparing gel electrolytes using NFC hydrogel with gelatin, PAA and KOH as additives,[Reference Poosapati, Jang, Madan, Jang, Hu and Lan31] the initial testing of pristine hydrogel yielded an ionic conductivity (σ i) value of 5.28 × 10⁻⁷ S/cm, which is at least an order of magnitude higher than the conventionally used polymers (PEO, PVA, etc.).[Reference Tsuchida, Ohno and Tsunemi11–Reference Girish Kumar and Sampath30] There are countless advantages for using NFC hydrogel, as it has excellent flexibility, bending without failure, safety, non-toxicity, inherent ability to be strong and lightweight, and abundant availability. The latter leads encouraged us to traverse our research into making thin, flexible electrolytes as compared to the previously reported relatively thick hydrogel-gelatin-PAA-KOH films (0.7–1.2 mm). Film thickness is vital throughout electrolyte preparation, as a lower thickness of electrolyte layers are favorable when constructing a whole cell in terms of enhancing the working efficiency by the less ion-transport distance required and volumetric efficiency by a reduction in bulkiness.[Reference Dunn, Kamath and Tarascon1,Reference Sun, Liu, Gong, Wilkinson and Zhang2,Reference Gray5,Reference Goodenough10,Reference Zhu, Fang, Preston, Li and Hu32,Reference Zhu, Luo, Ciesielski, Fang, Zhu, Henriksson and Hu33]
In our continued study to make thin films, we initially used lower volumes of our best ionically conductive sample hydrogel:gelatin:PAA:KOH (1:1:0.3:0.4) from the previous study[Reference Poosapati, Jang, Madan, Jang, Hu and Lan31] and casted into films. The resulting thinner films were flexible immediately after the drying process but turned brittle over time. Anticipating positive results, a trial and error approach was then adopted varying the parameters used for preparation and drying; but turned out to be a failure. We attribute the occurrence of this phenomenon to the presence of gelatin as an additive. Gelatin was used in previous works to make thicker, moldable electrolytes but never in thin films.[Reference Park, Park, Nam, Lee and Cho22,Reference Agrawal and Shukla34–Reference Chang, Chang, Lai and Sung36]
Henceforth our efforts directed toward making thin, stable, flexible, and highly ionic conductive NFC hydrogel electrolytes with the addition of varying amounts of additives such as PVA and KOH. PVA is chosen as an additive due to its ability to form thin films, ready solubility in water, stability, good solvent retention capability, and wide temperature window.[Reference Yang and Lin17,Reference Toyoshima37–Reference Wang, Wu, Bramnik and Mitra40] In addition, varying amounts of KOH is used as an additive due to its proven ability to enhance the ionic conductivities of the system by improving the amorphous nature as a whole and yet remain mechanically strong and stable.[Reference Yang and Lin17,Reference Gilbert18,Reference Park, Park, Nam, Lee and Cho22,Reference Lewandowski, Skorupska and Malinska29,Reference Girish Kumar and Sampath30] Structural and ionic conductivity studies were then performed on the various films obtained using the NFC hydrogel-PVA-KOH systems. Unlike most other polymer preparation processes that are complex and energy intensive, we prepare the NFC hydrogel electrolyte in much simpler stages and dry at temperatures close to room temperature. A best average σ i value of 75.012 mS/cm was obtained for relatively thin (200–350 µm) films with the hydrogel:PVA:KOH system, which is almost half the thickness of the hydrogel:gelatin:PAA:KOH films but with comparable σ i value to the previously reported.
Experimental
Material synthesis
NFC hydrogel used for this work, 0.53 wt%, was obtained from Dr. Liangbing Hu's research group. KOH (80 wt% solution) and PVA (Mowiol, Mw 130,000) were obtained from Sigma Aldrich (USA). Let it be noted that in accordance with various polymer systems, the weight ratios were calculated using the wt% of the cellulose nanofibers in the hydrogel, rather than the wt% of the hydrogel as a whole. All the materials were used as received without any additional chemical treatments for purification.
In order to achieve the flexibility and stability required for thin adequate gel electrolytes, PVA is used as an additive, and in order to improve and achieve a competitive value for ionic conductivity, KOH is used. Varying amounts of PVA and KOH were added and tested individually at different stages of experimentation to better approximate the ideal ratio for the gel electrolyte. The initial stage pertained to creating a bulk amount of PVA solution necessary for further stages of experimentation. In this first stage, PVA polymer crystals were dissolved in distilled water and magnetically stirred at 200 rpm on a hot plate at 75 °C overnight. The subsequent step involved adding varying amounts of the latter PVA: 5.3, 10.6, 15.9, 21.2, and 26.5 mg to 5 g of 0.53 wt% NFC hydrogel, respectively. These mixtures were annotated as HPx (hydrogel-PVA), where x = 0.2, 0.4, 0.6, 0.8, and 1. These varieties of samples were mixed using a vortex mixer for a few minutes to create a homogeneous solution. The resulting samples were drop cast into silicone molds individually (2 cm diameter) for ease of simplicity when extracting. The liquid polymer solutions, now in molds, were then placed in a vacuum oven for drying at 35 °C for 24–26 h. Dried gel electrolytes were then removed from the molds and measured for ionic conductivities. At least four samples of each ratio (HPx) was made and measured to minimize the error margin and to plot the error bar chart.
The latter process allowed us to identify the most ideal sample for this study, which was 1:0.8 ratio of hydrogel to PVA (HP0.8). This sample was chosen for further experimentation due to its enhanced ionic conductivity, stability, and flexibility for the desired thickness range when dried into a gel. In an effort to further improve ionic conductivity, varying amounts of 4.77, 9.54, 14.31, 19.08, and 23.85 mg of KOH were added to HP0.8, respectively, to form various samples. These various samples are denoted as HPKy, where y = 0.1, 0.2, 0.3, 0.4, and 0.5. The various additive ratios of KOH were selected and implemented during experimentation based on literature.[Reference Guinot, Salmon, Penneau and Fauvarque15–Reference Poosapati, Jang, Madan, Jang, Hu and Lan31] In the final stage, HPKy samples were drop casted into silicone molds, dried, and measured for ionic conductivity, similar to past samples.
Measurements
The setup for ionic conductivity measurements, which was created in-house, was similar to that of a swagelok cell, in that each gel sample was placed in between two blocking electrodes. AC electrochemical impedance spectroscopy was performed to obtain ionic conductivity at room temperature. Custom-built stainless steel (SS) electrode, with a geometric surface of approximately 2.5 cm2 was used to test all the samples. The configuration during measurement set up can be simplified as a SS/electrolyte/SS sandwich stacked orientation. Prior to any testing, a Vernier caliper (Mityutoyo) was used to measure the thickness of the sample, which was calculated by using the difference between the lengths of the electrodes with and without the polymer electrolyte sandwich configuration. The measurement of the thickness of samples was also performed with a micrometer (Mityutoyo). Later, these two measurements were compared against each other to minimize the error. A versastat from Princeton applied research was used for performing the AC impedance characterization with a frequency range of 0.1–106 Hz, and 10 mV voltage amplitude. X-ray diffraction (XRD) was performed using a Rigaku Miniflex apparatus, in which the polymer samples were hit with CuKα X-radiation. A Frontier Optica spectroscope from Pelkin Elmer with parameters of 2/cm resolution, 400–4000/cm measuring wave number range, and 64 scans was used to measure the Fourier transform infrared (FTIR) absorption spectra of the various gel electrolyte films.
Results and discussion
Ionic conductivity
SS cylindrical bars are used as blocking electrodes for impedance characterizations. When ideal the spectra are expected to be vertical since the electrode–electrolyte interface acts as capacitance.
Unlike the ideal, perfect alignment of the electrode–electrolyte interface is not practically feasible. This results the spectra to be usually at an angle <90°. These inclined spectra obtained when plotting the real and imaginary impedances are generally called the Nyquist plots and the bulk resistance (R b) of the gel sample can be extracted as the intercept of the real axis at higher frequencies when analyzing them. Using this R b, the ionic conductivity of various samples can be calculated using the equation, σ i = t/A × R b; where, t is the thickness of the electrolyte and A is the area of blocking electrodes. Using this relation, the σ i of the pristine NFC hydrogel was measured and it was 5.28 × 10⁻⁷ S/cm.
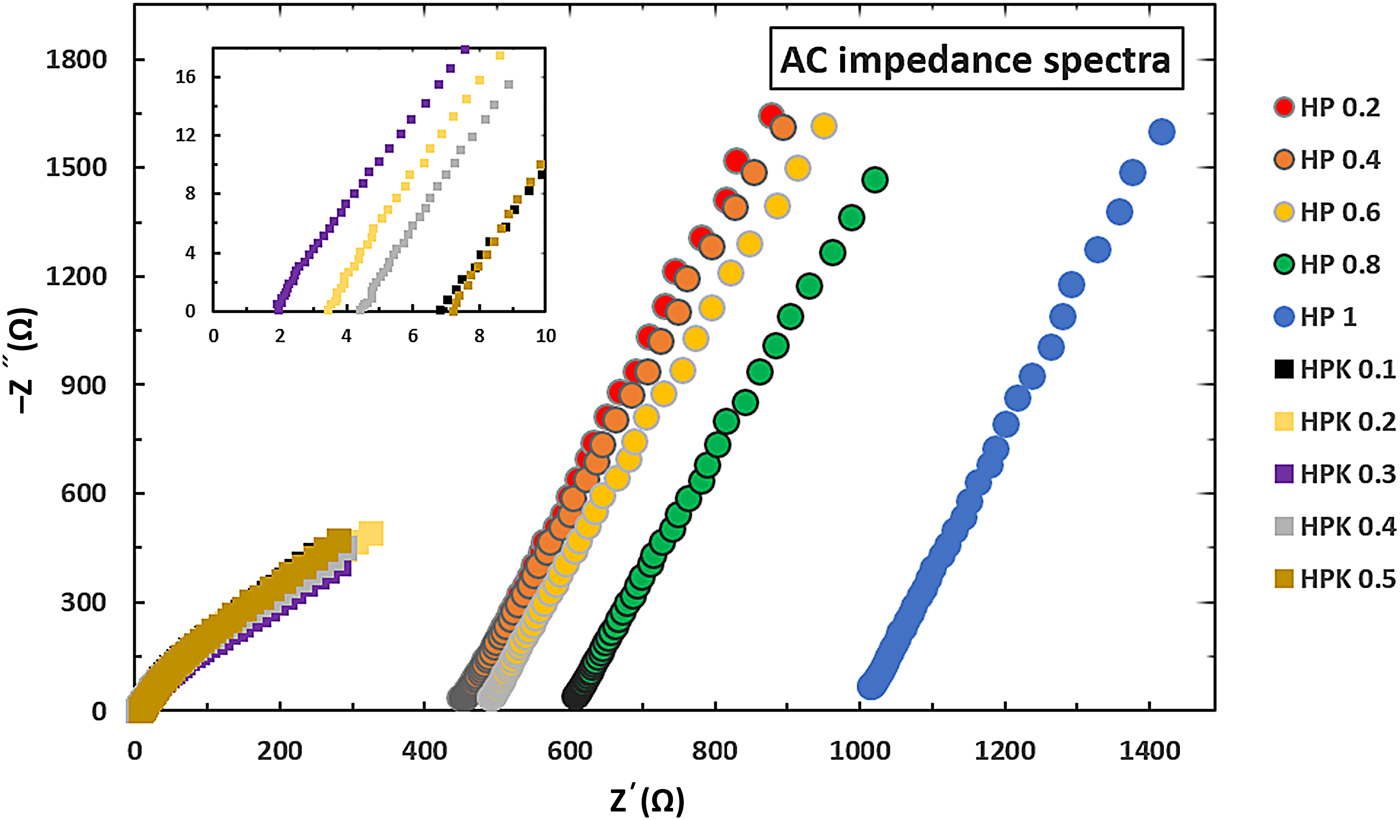
Before performing the impedance characterizations, thickness measurements were performed for each of the samples as mentioned earlier and were found to be in the range of 200–350 µm. These thickness values were found to be relatively consistent for the same sample ratios. Then the sample is placed in the in-house created setup and connected to the versastat. The ac impedance spectra of NFC hydrogel-based electrolytes obtained with varying ratios of PVA (HPx) and KOH (HPKy) at room temperature are recorded and shown in Fig. 1. From analyzing Nyquist plots for intercepts on the x-axis, the R b value ranges obtained for HPx and HPKy samples were 448.15–1008.2 and 1.97–7.21 Ω, respectively. Using the R b and thickness values obtained, the ionic conductivities of each of the samples were calculated. To minimize the error in data, four samples of HPx and HPKy were measured for ionic conductivity.
AC impedance spectra for NFC hydrogel electrolytes with varying ratios of various additives such as PVA (HPx) and KOH (HPKy).

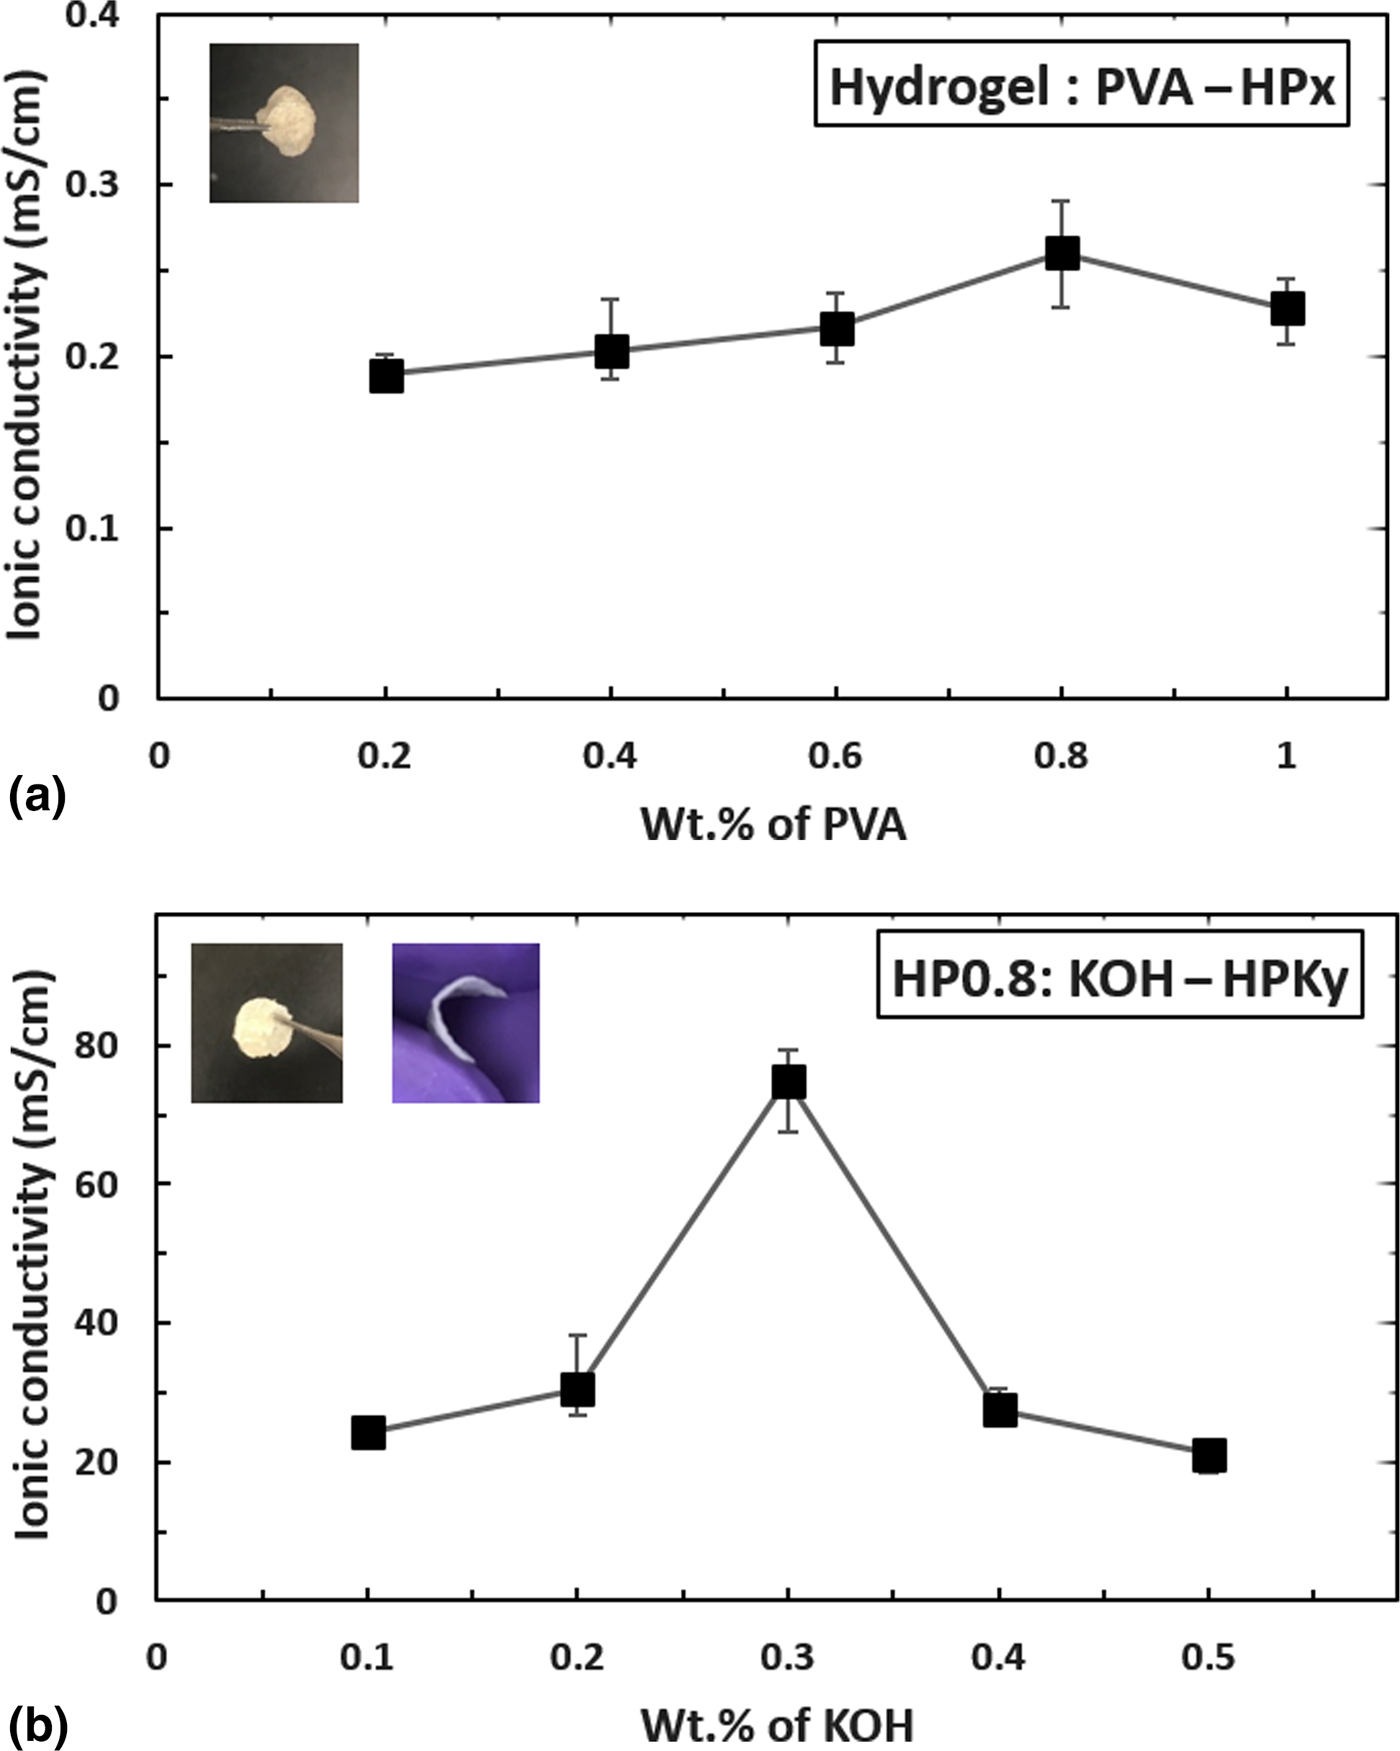
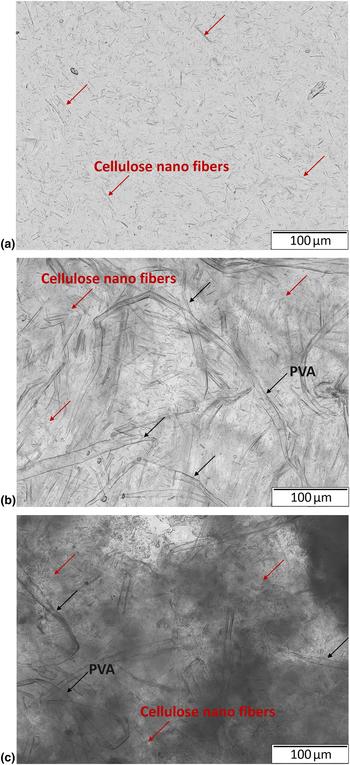
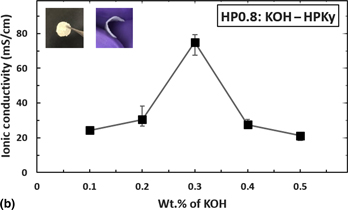
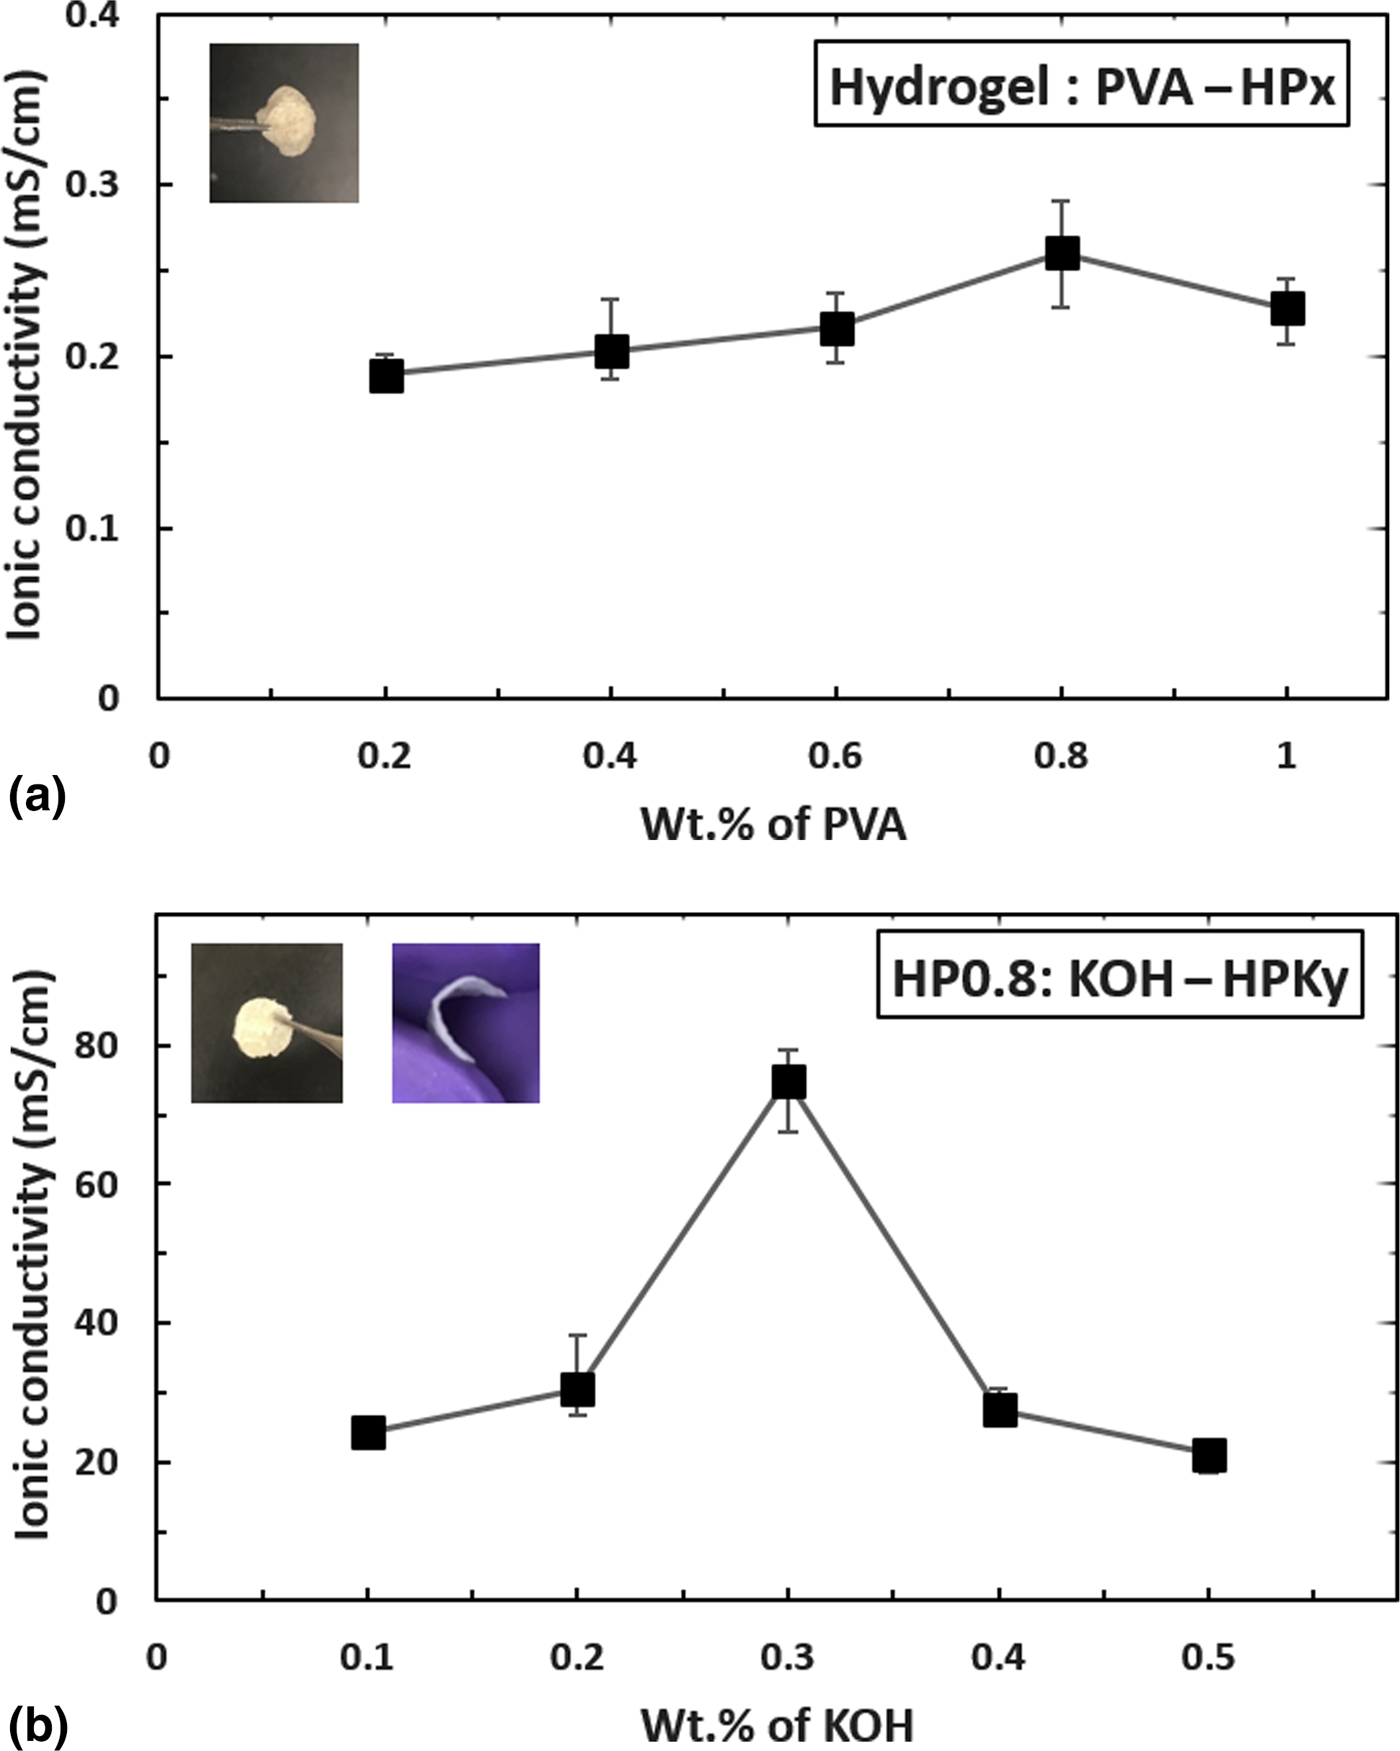
Figure 2 shows the trend in the variation of ionic conductivity values for various electrolytes prepared based on the amounts of additives used. Figure 2(a) shows the four orders of magnitude increase in σ i values on a whole irrespective to the amount of PVA added in comparison to pristine hydrogel. This can be attributed to the good retention capacity of PVA even during crystallization.[Reference Agrawal and Shukla34,Reference Toyoshima37] This allows a flexible stable gel film to be formed and at the same time help the gel sample remain amorphous to a certain extent because of NFC hydrogel allowing it to transport ions through itself while being mechanically stable at room temperatures.[Reference Yang and Lin17,Reference Park, Park, Nam, Lee and Cho22,Reference Agrawal and Shukla34,Reference Toyoshima37] Now, with varying amounts of PVA, it can be observed that there is a small continuous increase in σ i values from 0.2 (HP0.2) to 0.8 (HP0.8) wt% PVA in NFC hydrogel and then slightly reduces beyond. The weight ratio 1:0.8 hydrogel:PVA (HP0.8) is chosen among the other PVA samples, due to its higher ionic conductivity value of 0.26 mS/cm in comparison to other samples. This best sample HP0.8 is used for further experimentation. The free-standing flexible and stable gel electrolyte films are shown in Figs. 2(a) and 2(b) on the upper left corner. Interpenetration of PVA into NFC hydrogel can be clearly observed on comparing Figs. 3(a) and 3(b), the optical microscopic images of pristine hydrogel and HP0.8 sample. It also shows the formation of flexible and stable gel electrolyte films by means of using PVA. The formation of a gel by means of changing bonds (cross-linking) when adding PVA to hydrogel is further confirmed by FTIR and is discussed in detail later.
Ionic conductivity as a function of the amount of (a) PVA, and (b) KOH in the 0.53 wt% NFC hydrogel sample and HP0.8 sample, respectively.
Optical microscopic images of (a) pristine hydrogel, (b) hydrogel with PVA (HP0.8), and (c) hydrogel-PVA with KOH (HPK0.3).
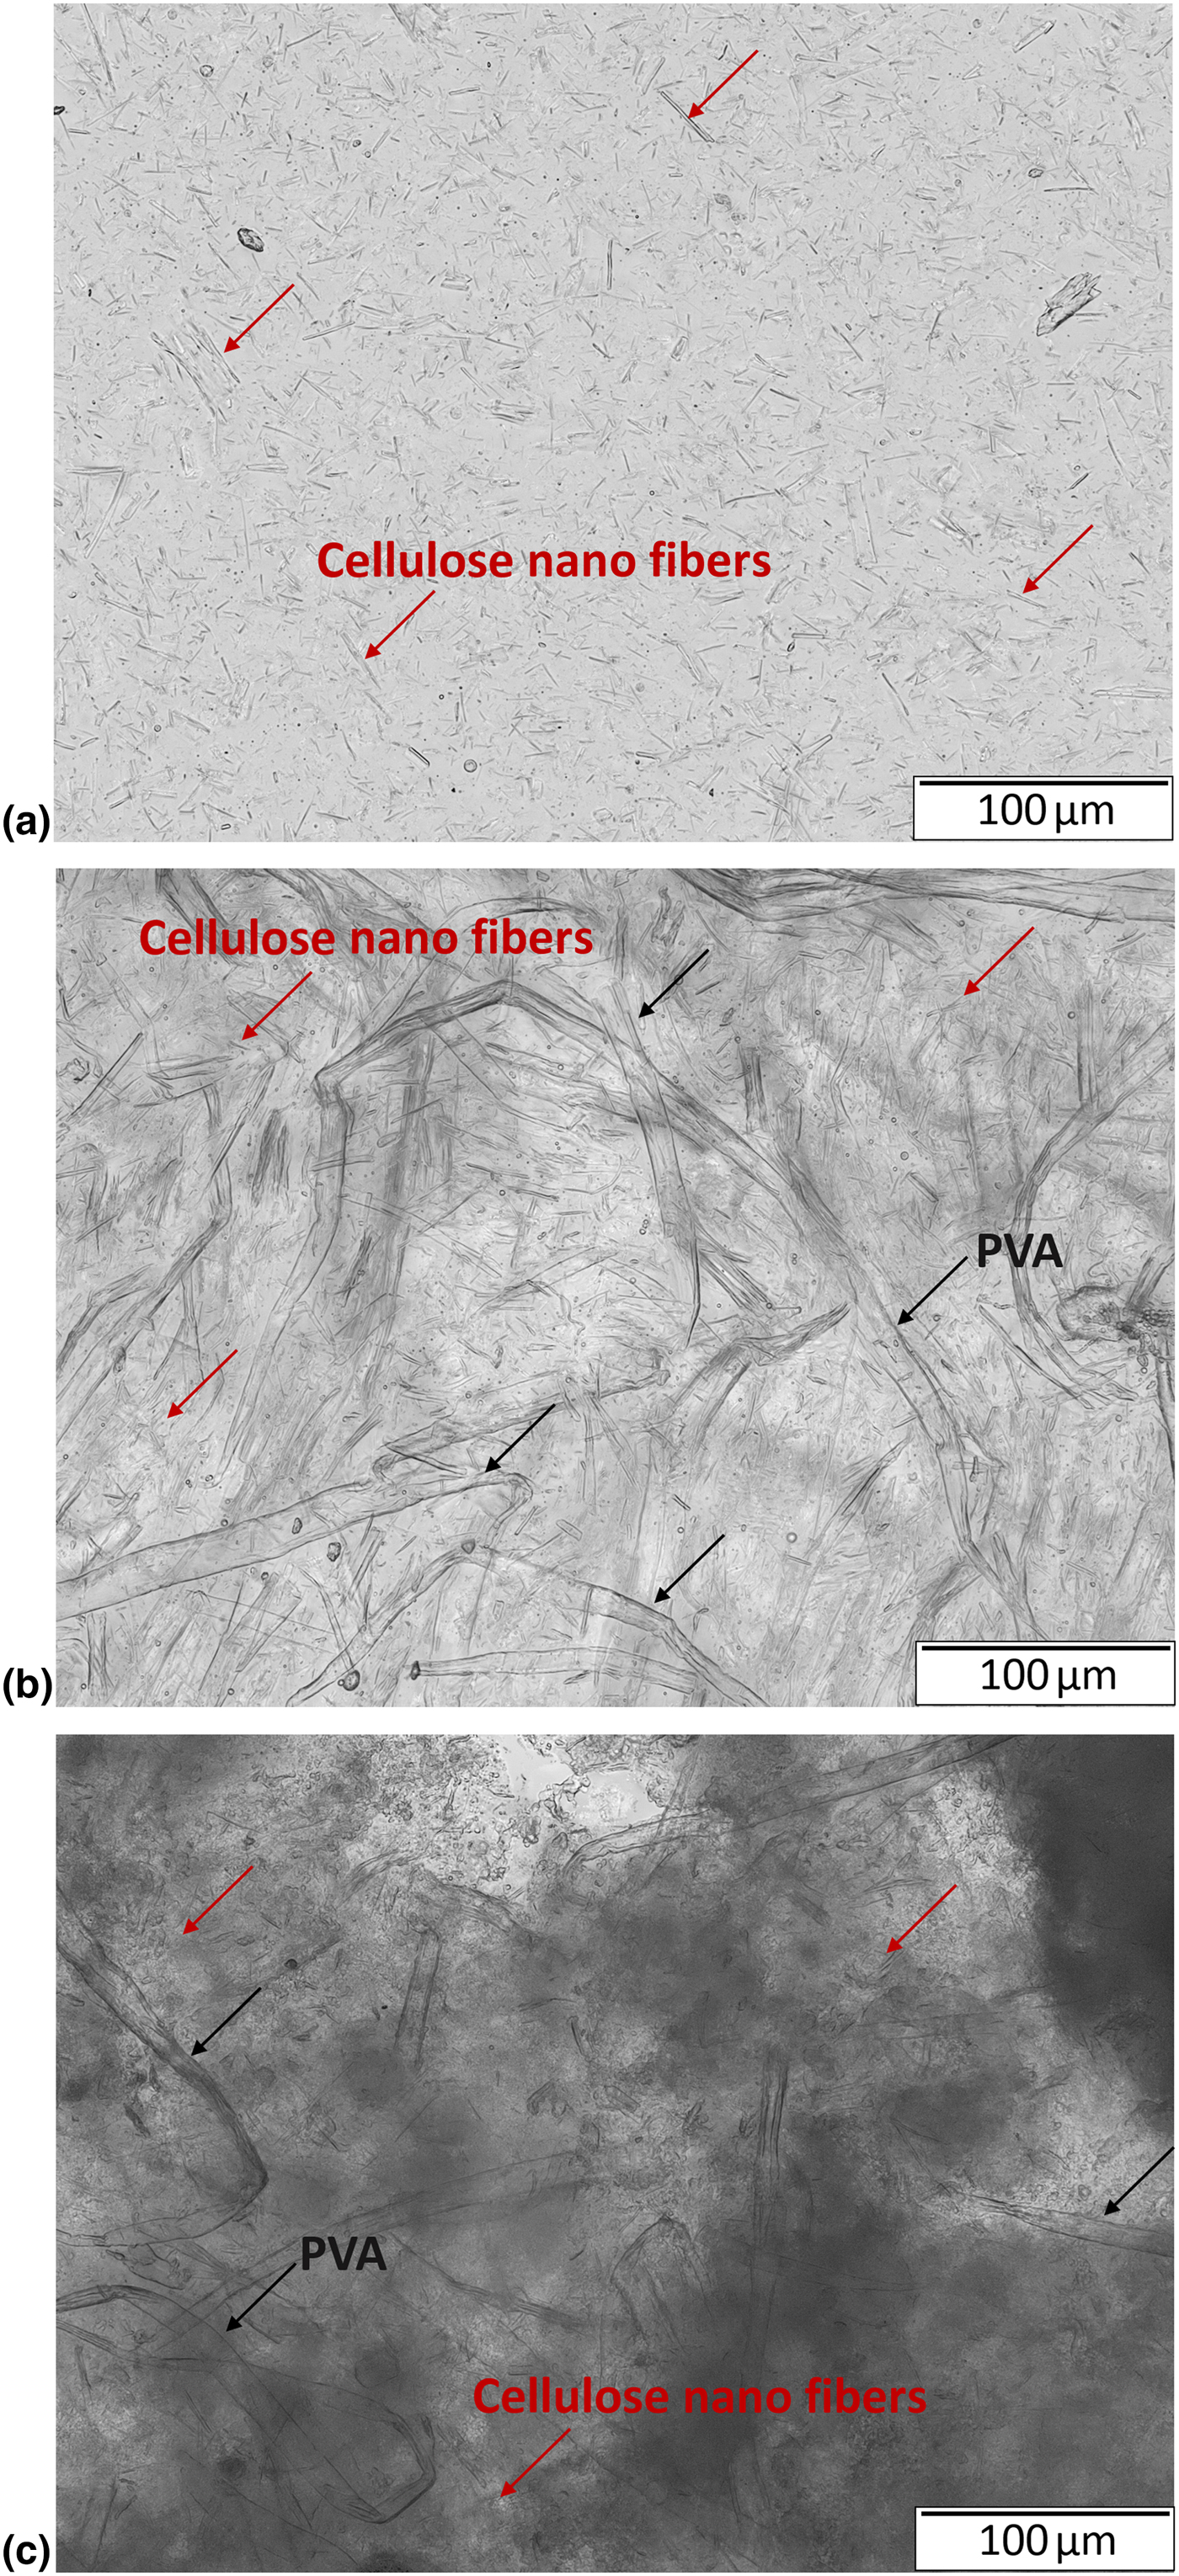
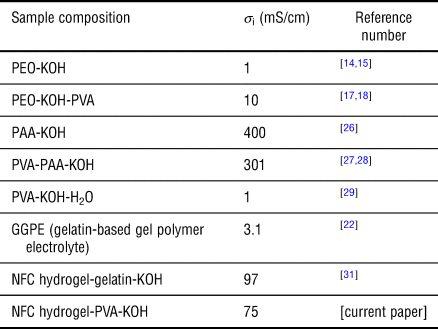
Now to further improve the ionic conductivity values, various amounts of KOH are used as an additive to the HP0.8 sample to make HPKy (y = 0.1, 0.2, 0.3, 0.4, 0.5) samples. The varying amounts of KOH were chosen based on literature.[Reference Yang and Lin17,Reference Gilbert18,Reference Park, Park, Nam, Lee and Cho22,Reference Lewandowski, Skorupska and Malinska29,Reference Girish Kumar and Sampath30] Figure 2(b) indicates the variation of σ i with KOH. It can be noted that with the addition of varying amounts of KOH, there is a significant increase in σ i values until 0.3 wt% KOH and then a sharp fall. A highest average σ i of 75.012 mS/cm was achieved for HPK0.3 system (hydrogel:PVA:KOH = 1:0.8:0.3) and is comparable to the other previously recorded values as can be seen in Table I. Improvement in the amorphous nature of the electrolyte is observed by the addition of KOH and can be explicitly seen on comparing Figs. 3(b) and 3(c). Addition of KOH caused the swelling of polymer by retaining the KOH within the polymer complex. This phenomenon resulted in an increase in amorphicity along with an increase in ionic concentration in the gel electrolyte, which resulted in better ionic conductivity values. This is later confirmed by XRD studies. On further addition of KOH beyond 0.3 wt%, the σ i values reduce due to crystallization from salt saturation, causing aggregation of free ions in gel electrolyte film and thus decreasing the ionic conductivity of the film.[Reference Wu, Lin and Yang28,Reference Lewandowski, Skorupska and Malinska29,Reference Agrawal and Shukla34,Reference Pal, Banthia and Majumdar38,Reference Wang, Wu, Bramnik and Mitra40]
Ionic conductivities of various polymer composition systems.

XRD and FTIR characterizations
The corresponding sections provide a detailed description of understanding the science responsible for a stable thin gel electrolyte layer formation due to the restructuring of bonds (cross-linking) and enhancement of ionic conductivity due to an overall increase in amorphicity in the gel layer. To confirm the changes occurring either in the form of restructuring of bonds, or in the form of amorphicity when additives (PVA and KOH) were added, XRD and FTIR analyses were performed, respectively.
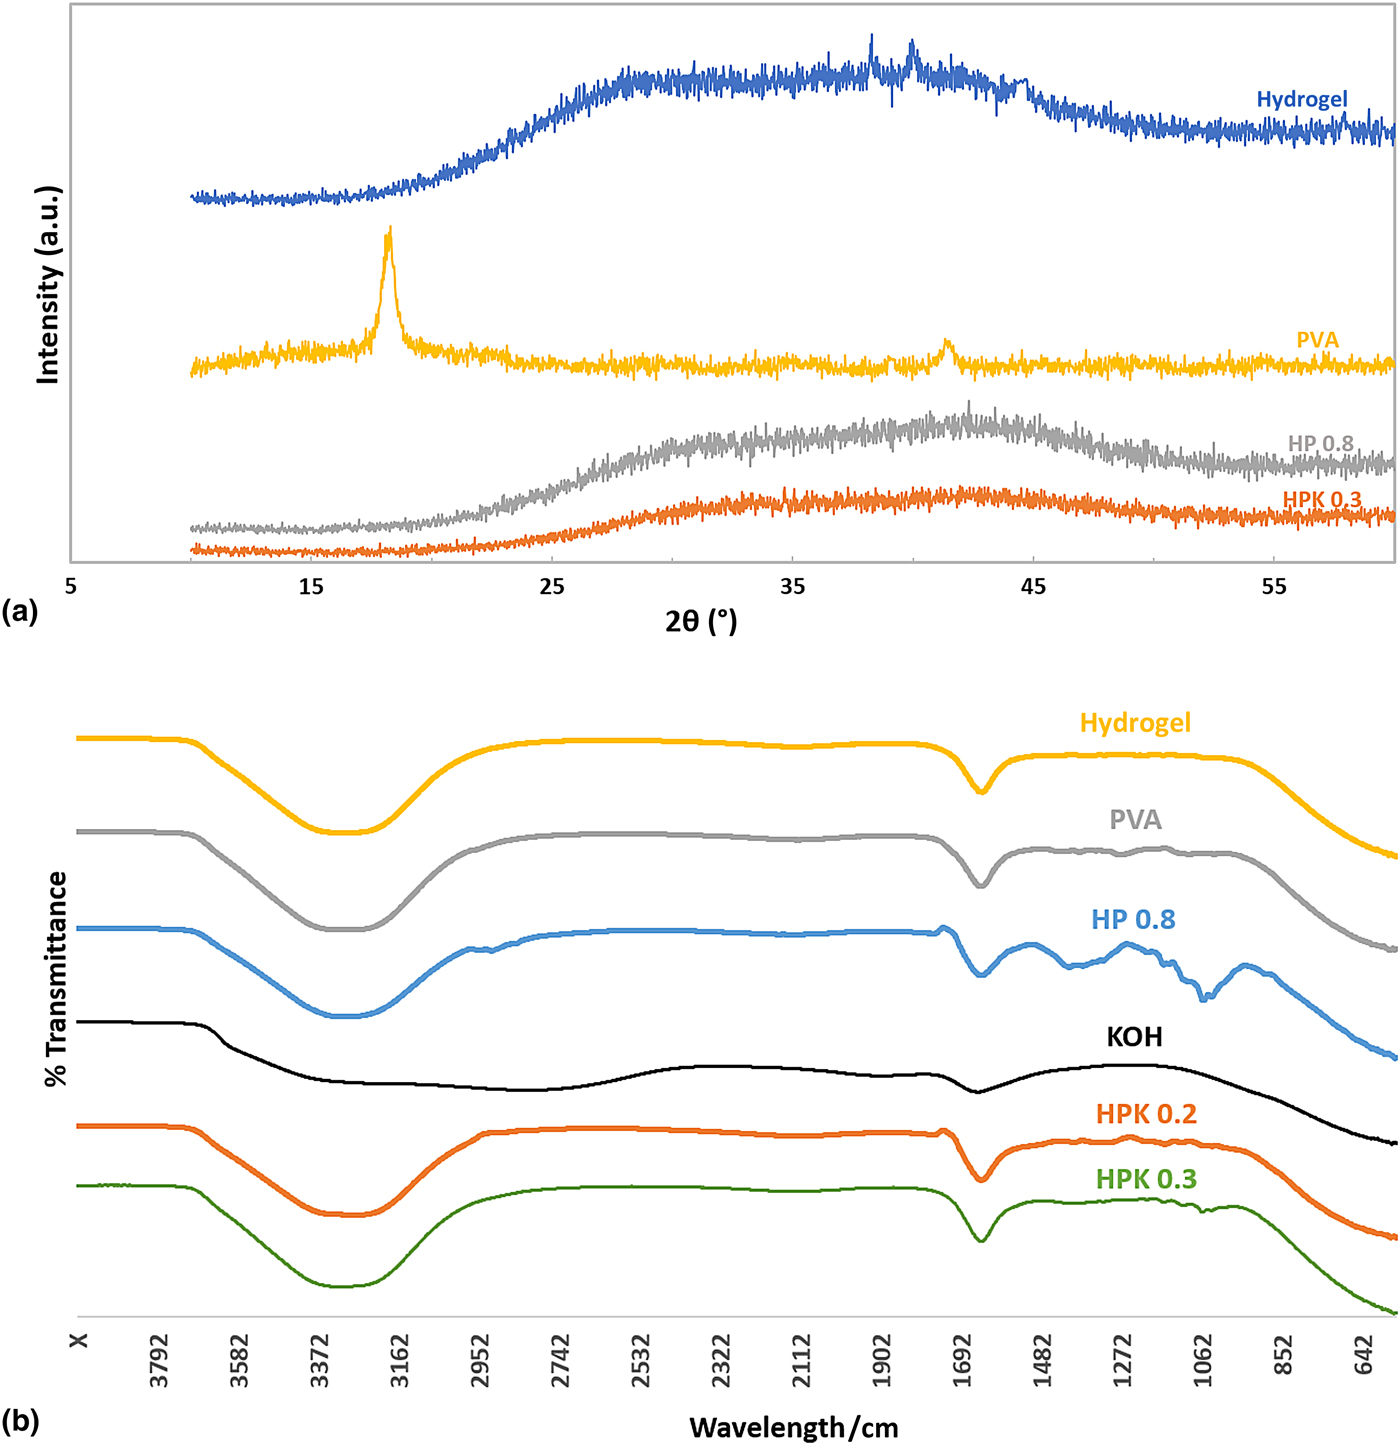
XRD analysis is used to confirm the structural morphology of the gel polymer electrolyte samples and to figure out the degree of crystallinity/amorphicity and its effect on the gel electrolyte layer in terms of ionic conductivity. Figure 4(a) shows the XRD patterns for pristine hydrogel, PVA, and for the best samples of the various additives, that is HP0.8 for HPx and HPK0.3 for HPKy, respectively. As observed in Fig. 4(a), the XRD pattern for PVA shows intensity peaks at 2θ~18° and at 2θ~41°, and is in accordance with the literature.[Reference Agrawal and Shukla34,Reference Shukla and Agrawal35,Reference Toyoshima37,Reference Agrawal and Shukla41,Reference Patel, Patel, Awadhia, Chand and Agrawal42] It can be observed that when PVA is added to hydrogel, the small intensity peaks from PVA become insignificant in the mixture indicating that even during film formation much crystallinity is not induced. Also, the broadness of peaks is enhanced when compared to pristine hydrogel, indicating the improvement of the amorphous nature of the gel electrolyte even after drying for film formation.[Reference Agrawal and Shukla41] This is due to the good retention capacity of PVA.[Reference Agrawal and Shukla34,Reference Toyoshima37–Reference Wang, Wu, Bramnik and Mitra40] On further addition of 0.3 wt% to HP0.8, the peaks are much more broadened and show no significance in the pattern obtained. This indicates the sample to be the most amorphous among all others. This induced amorphicity helps the easy motion of ions without any disturbances in its flow. Also, this amorphicity renders greater ionic diffusivity in the flexible backbone of the polymer electrolyte, which in turn will help to enhance the ionic conductivity.
(a) XRD patterns of pristine hydrogel, PVA, HP0.8, and HPK0.3 samples. (b) FTIR spectra of hydrogel, PVA, KOH, HP0.8, HPK0.2, and HPK0.3 samples.
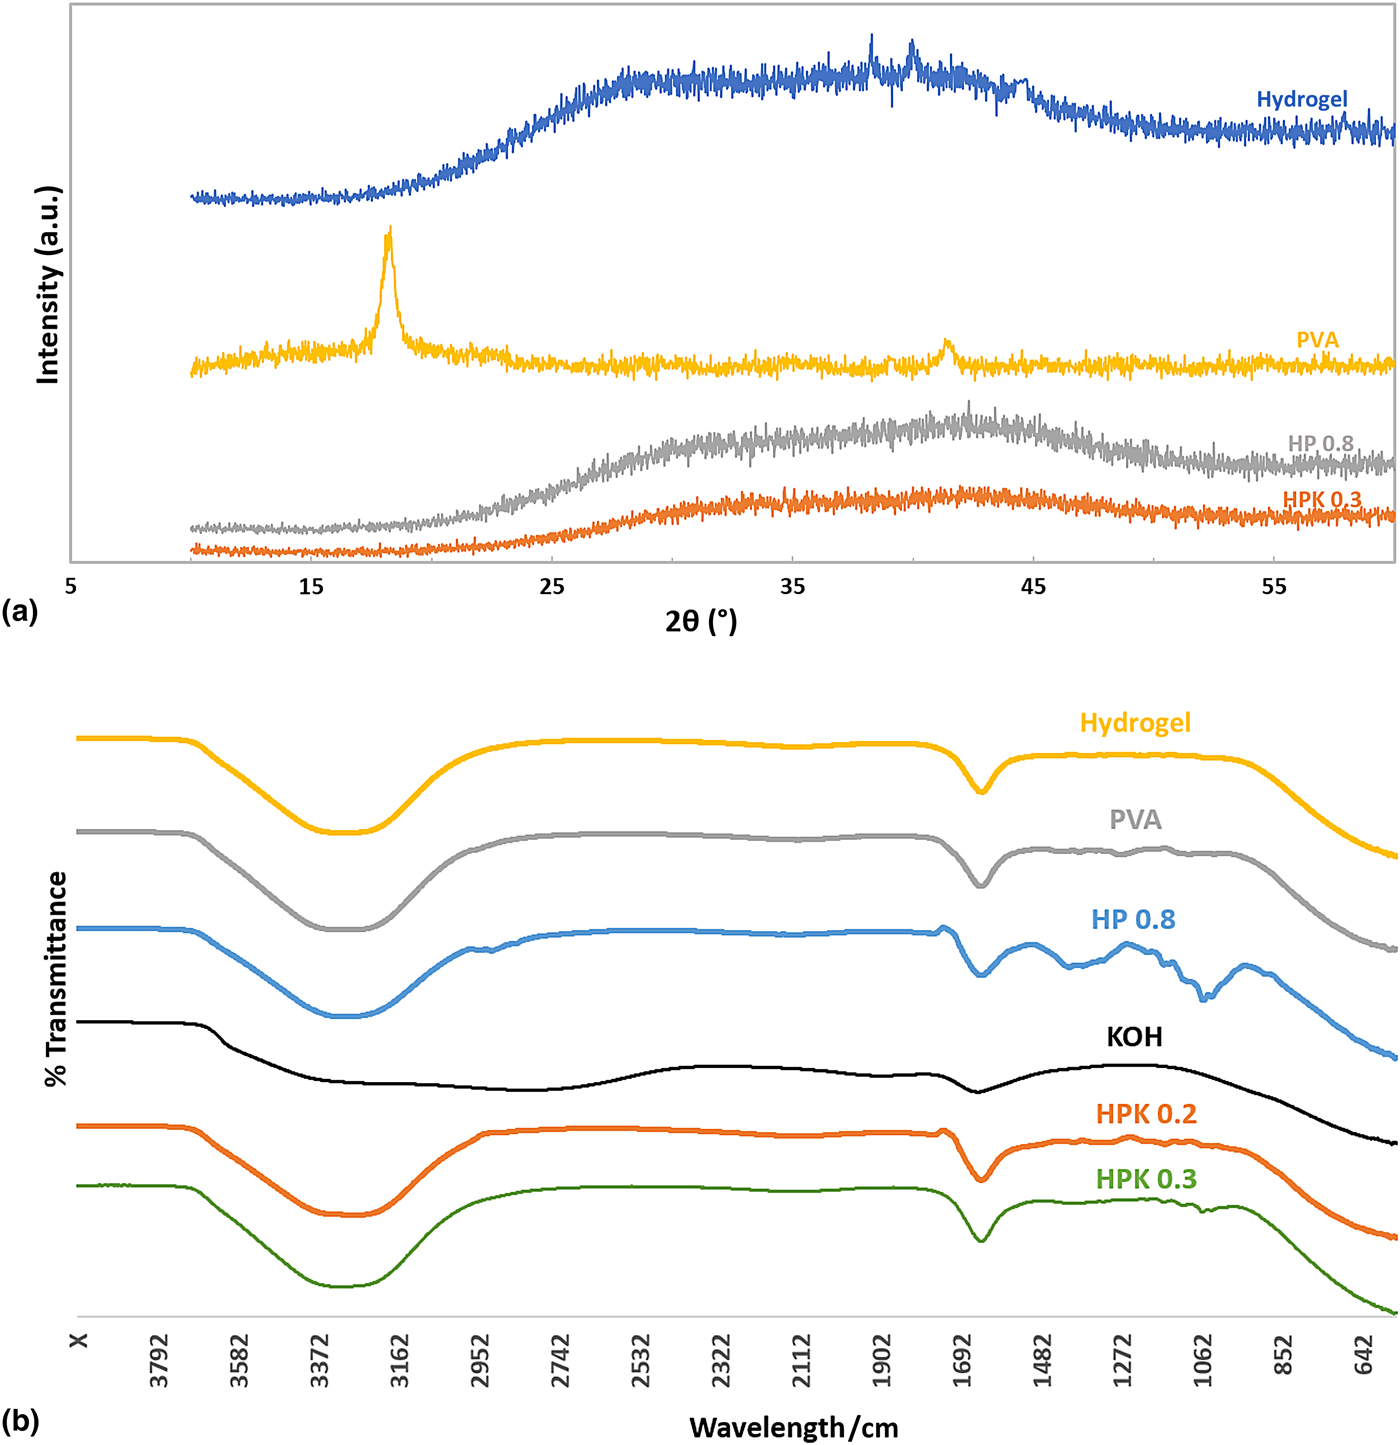
To understand the mechanism of increase in ionic conductivity of HPK0.3 samples, FTIR spectra were performed on various samples, and can be seen in Fig. 4(b). The spectra analysis for pure hydrogel was taken in the form it was received. The spectra for PVA were taken in liquid form, when PVA completely dissolved in deionized water. Further analysis on the hydrogel spectra shows a broad band at 3420/cm corresponding to the O–H vibration from water, confirming the presence of water. The spectra also show a medium peak at 1652/cm, which corresponds to the C=C stretching. The characteristic peaks of the hydrogel sample collected agree with the previously reported values.[Reference Poosapati, Jang, Madan, Jang, Hu and Lan31] The spectra for PVA exhibited characteristic peaks at 3438, 2923, 1726, and 1656/cm, indicating stretching of C–H, C=O, and C=C hydroxyl groups.[Reference Pal, Banthia and Majumdar38] The sample HP 0.8 spectra obtained by the addition of PVA to hydrogel shows a number of additional peaks to the expected combination of PVA and hydrogel, indicating the occurrence of changes in bonds (cross-linking). An additional peak at 2900/cm corresponds to stretching of C–H aldehyde bond, at 1480/cm corresponds to C–H bending, and at 1153, 1095, 1032, and 1018/cm corresponds to the combination of C–O bending and stretching. Again in this spectra, small disturbances in between the characteristic peaks indicate vibrations in the bonds within the sample.[Reference Shukla and Agrawal35,Reference Chang, Chang, Lai and Sung36,Reference Pal, Banthia and Majumdar38–Reference Dash, Marcus and Arthur43] KOH spectra showed a broad peak at ~3410/cm indicating stretched O–H bond and agrees with earlier studies.[Reference Poosapati, Jang, Madan, Jang, Hu and Lan31] We record the FTIR spectra of samples HPK0.2 and HPK0.3 obtained by the addition of KOH to HP0.8, to compare the changes and also to understand the increase in ionic conductivity values. The sample HPK0.2 spectra obtained confirms lower amounts of vibrations in bonds in comparison to HP0.8, due to the addition of KOH. This also explains that ionic conductivity of HPK0.2 sample is two-order magnitude (25 mS/cm) higher as compared to HP0.8 sample (0.26 mS/cm). When comparing this HPK0.2 spectra to HPK0.3, it can be observed that the bonds are much more relaxed with additional KOH and no longer have vibrations as seen in HP0.8. This indicates that a perfect amount of KOH was used for the interpenetration to occur and is also more stable.[Reference Shukla and Agrawal35,Reference Pal, Banthia and Majumdar38,Reference Agrawal and Shukla41] This explains that by adding 30 wt%KOH to HP0.8 sample improved the ionic conductivity significantly.
Conclusion
Thin gel electrolytes with a thickness in the range of 200–350 µm were successfully prepared by using NFC hydrogel as the main constituent along with PVA and KOH as additives in small amounts. These additives helped to enhance the stability and ionic conductivity during the film formation by varying the degree of crystallinity and the amount of ionic concentration within the hydrogel layers, respectively. Additionally, the thin electrolytes are fabricated in much simpler stages using temperatures close to room temperatures, unlike the conventional methods. The best sample HPK0.3 (hydrogel:PVA:KOH = 1:0.8:0.3) recorded an ionic average conductivity of 75.012 mS/cm, which is five orders of magnitude higher than pristine hydrogel and comparable to the best ionic conductivity values for gel electrolytes. When compared to the previously reported hydrogel:gelatin:PAA:KOH electrolytes[Reference Poosapati, Jang, Madan, Jang, Hu and Lan31]; thin gel electrolyte films with thickness almost half the value were fabricated with similar ionic conductivity values.
Acknowledgments
The authors would like to thank the University of Maryland, Baltimore County (UMBC) for supporting this research from startup fund. The authors would also like to thank Eunhwa Jang, Scott Riley, and Ryan Lorence for their contributions.