

DISCUSSION POINTS
• How can looking at the demand for and supply of infrastructure services help redefine how urban infrastructure is planned, designed, and operated?
• Two pragmatic principles for sustainable urban infrastructure system design.
• Design strategies for seven urban infrastructure systems: water, electricity, district heating and cooling and natural gas, telecommunications, transport, solid waste, and buildings.
• A four-step process to help design sustainable and resilient infrastructure systems.
Introduction
In Democracy in the Politics, Aristotle wrote: “The city-state comes into being for the sake of living, but it exists for the sake of living well.” For more than 10,000 years, humans have settled together in cities because as a society we tend to live “better” than individually. Despite the countless utopias that depict small and agrarian settlements, and despite the cycles of urban growth and decline, cities keep getting larger and more complex. This progress is not “free,” however. Tremendous amounts of energy are needed to plan, design, build, and operate cities to meet the needs of their residents. During most of the history of humanity, this energy largely came from the sun, providing the energy to grow crops for food and wood for housing, heating, and cooking, and from the wind, providing the power to transport people and goods. Thanks to the discovery and wide use of fossil fuels, incredible amounts of energy became available in the 1800s. Indeed, fossil fuels can easily be moved/shipped and they possess high energy densities. Thanks to these new sources of energy, the global population soared from 1 billion in 1800 to 7 billion in 2011 and to a forecasted 11 to 12 billion by 2100.1 Moreover, in 2008, and for the first time in the history of humanity, more than 50% of the world population lived in cities—this proportion is predicted to increase to 68% by 2050.2 At least two major problems will necessarily have to be addressed, however, to keep cities thriving. First, fossil fuels are finite resources. Even if there is much uncertainty about when they will run out, and no matter how long it will take, they will run out if we do not stop consuming them. Second, and perhaps more pressing, the burning of fossil fuels generates greenhouse gases (GHG), and as a society, we have emitted such a significant amount of GHG that we have altered the climate. In fact, many scientists agree that we have entered a new geological era, the Anthropocene, from the Greek anthro for “human” as this change was caused by human activity. The cities that have therefore provided humanity the amazing progress that we now enjoy have also been partly responsible for climate change. But there is hope, and this hope again lies in cities.
Cities are constantly evolving systems, and throughout the history, cities have been largely shaped by the challenges they had to face.Reference Derrible3 For example, from early human settlements in the Neolithic era to Amsterdam or Tokyo, many cities built networks of canals to help for the transport of goods and as a source of water. Ancient Greek towns were oriented based on the winds—to prevent the spread of diseases and to keep cool in the summer. Large aqueducts were constructed to bring freshwater to Rome and to other cities in the Roman Empire. London’s building codes were updated after the Great Fire of 1666 in favor of nonflammable materials like brick, as were the building codes of many cities that had to deal with similar events. A large part of the city of Chicago was literally raised by close to 2 meters to create a sewer system to solve its flooding and sanitary sewer problems. Starting in the 20th century, many cities have been building skyscrapers in large part to be able to accommodate an ever-increasing urban population; in seismic areas, many of these buildings are fitted with dampers to maintain their structural integrity during an earthquake. It therefore seems logical to hypothesize that cities in the 21st century will be transformed in response to the current challenges they have to face, and from an infrastructure viewpoint there are at least two major challenges that need to be addressed. First, cities will have to dramatically reduce their energy and resource consumption. From electricity generation to water distribution systems and transport, too much energy and too many resources are needed to build and operate cities, directly affecting the environmental limits that the planet can sustain.Reference Rockström, Steffen, Noone, Persson, Chapin, Lambin, Lenton, Scheffer, Folke, Schellnhuber, Nykvist, De Wit, Hughes, van der Leeuw, Rodhe, Sörlin, Snyder, Costanza, Svedin, Falkenmark, Karlberg, Corell, Fabry, Hansen, Walker, Liverman, Richardson, Crutzen and Foley4–Reference Hoornweg, Hosseini, Kennedy and Behdadi6 Second, as a direct impact of climate change, extreme weather events are becoming more frequent and more severe, and cities will therefore have to adapt and become more resilient—as most agree that it is now too late to be able to fully mitigate climate change.Reference Princiotta7
A feature of these two challenges is that they affect all urban infrastructure systems. Put differently, they are not only water challenges, transport challenges, electricity challenges, and solid waste challenges; instead they are urban challenges. As a response, the engineering profession will have to adapt accordingly and partially reinvent itself. In particular, the various fields of engineering, computer science, urban planning, and other important fields will have to work together toward a new urban engineering. Moreover, in the context of this article, both challenges are integrated within a general framework of “sustainability” (the term is defined in the next section).
The main goal of this article is twofold. First, it is to present two principles of sustainability and apply them to seven urban infrastructure systems. Second, based on these two principles, it is to offer a four-step process that can be followed before designing any new infrastructure project. The article focuses purely on urban infrastructure systems and more specifically on water, electricity, district heating and cooling and natural gas, telecommunications, transport, solid waste, and buildings. In particular, in the future, urban infrastructure will likely become much more integrated and decentralized,Reference Derrible8 and institutions that operate infrastructure systems will likely have to change dramatically as well.Reference Derrible3
In the next section, the two principles of sustainability for urban infrastructure are defined. In section “Application of the two sustainable principles to urban infrastructure,” these two principles are applied to seven urban infrastructure systems. In section “An approach to urban infrastructure design,” a new paradigm for urban infrastructure design is proposed, which is based on a four-step process. Finally, a brief conclusion is provided in the last section. Section “Application of the two sustainable principles to urban infrastructure” is disproportionally larger than the other sections as it is the core of this article and infrastructure systems are discussed individually.
Two principles of sustainability
The terms sustainability and sustainable development (used interchangeably in this article) have become mainstream, both in the scientific community and with the general public. While it is practically impossible to come up with a perfect definition, many people have a general appreciation for the concept of sustainability. In the context of this article, sustainability is taken as the literal meaning of being able to sustain an activity forever (as opposed to environmental sustainability, for instance, that looks at the impact of an activity on the environment). For example, in addition to environmental concerns, the use of fossil fuels is not sustainable simply because fossil fuels are available in finite resources; thus, it is impossible to sustain consuming them forever. More generally, the definition of sustainability adopted is from the 1987 document Our Common Future by the World Commission on Environment and Development,9 often called the Brundtland Report from the Chairman of the Commission, G.H. Brundtland. The definition is as follows:
“Sustainable development is development that meets the needs of the present without compromising the ability of future generations to meet their own needs.”
There are various elements in this definition that need to be discussed. First, we see that humans have “needs” that need to be “met.” We can view these “needs” as a demand and “meeting these needs” as a supply. Considering these elements as a demand and a supply works well with infrastructure as infrastructure is built to provide a service. Demand can also be seen as a consumption C, and supply can be seen as a production P.
The definition from the Brundtland report also adds an element of time as the future generation should also be able to meet their needs. Both consumption and production are therefore functions of time t in the form C(t) and P(t). More specifically, because both consumption and production need to be sustained over time, we should focus on the rate of change of consumption and production. Sustainability can therefore be achieved when the rate of change of production is greater than or equal to the rate of change of consumption or in the equation form:
 $${{{\rm{d}}P} \over {{\rm{d}}t}} - {{{\rm{d}}C} \over {{\rm{d}}t}} \ge 0.$$
To take a simple example, the rate at which electricity is generated should be greater than or at least equal to the rate at which it is consumed. Although this may seem obvious at first, it is not. Electricity demand on a hot summer day can overpass the total capacity of all power plants to generate electricity, resulting in power outages.
To be fair, Eq. (1) is reductive and imperfect—production and consumption functions can be highly nonlinear—but it offers a conceptual foundation to analyze whether a situation is sustainable or not. We can also recognize that production and consumption functions can change over time, and therefore, the goal here is to ensure that Eq. (1) is satisfied forever—that is, we take the limit when time t tends to infinity.
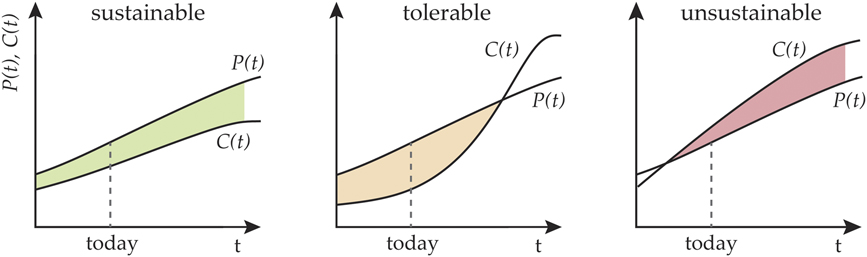
Figure 1 shows a graphical representation of Eq. (1). In the far left, the production is systematically larger than consumption, resulting in a sustainable scenario. Solar energy offers an example as we are far from consuming all the solar energy that we receive.Reference Lewis and Crabtree10 In the far right, consumption has overpassed production, resulting in an unsustainable scenario. Rockström’s planetary boundariesReference Rockström, Steffen, Noone, Persson, Chapin, Lambin, Lenton, Scheffer, Folke, Schellnhuber, Nykvist, De Wit, Hughes, van der Leeuw, Rodhe, Sörlin, Snyder, Costanza, Svedin, Falkenmark, Karlberg, Corell, Fabry, Hansen, Walker, Liverman, Richardson, Crutzen and Foley4 offer a good example, but to take a more practical example to cities, many roads experience a level of traffic congestion greater than the designed capacity.
Production and consumption in sustainability.

Finally, in the middle, production is currently larger than consumption, but we can see that the situation will soon change, resulting in a tolerable scenario that requires action to ensure that consumption does not overpass production. A good example is the use of fossil fuels for power generation as it is tolerable at the moment, but as they are finite resources, consumption will indubitably overpass production in the future if we do not stop consuming fossil fuels—this is true only from a supply perspective as we have already reached the unsustainable scenario from a GHG perspective as the climate is changing.
While Eq. (1) is conceptually appealing, we then need to recognize that it is practically impossible to measure production and consumption rates for all the energy and resources that are consumed. In fact, we often do not even know how much of something can be produced or how much of it is consumed. This problem is further exacerbated by the fact that the production and consumption of many resources depend on the production and consumption of other resources. Determining whether we are in a sustainable, tolerable, or unsustainable scenario is therefore far from trivial in most instances. What we can do instead, however, is to aim in the right direction by lowering consumption and increasing the supply in desirable ways. More formally, we can derive two sustainability principles directly from Eq. (1):
(i) Controlling the demand.
(ii) Increasing the supply within reason.
Sustainable Principle 1 (SP1) essentially states that dC/dt should be as small as possible. Sustainable Principle 2 (SP2) states that if dP/dt needs to be increased, then it should be done in a reasonable way.
Put differently, SP1 recommends energy and resource consumption to be as low as possible, regardless of the infrastructure system—for example, by lowering water consumption and solid waste generation. If demand cannot be decreased and new forms of supply must be added, then SP2 recommends that these forms be as sustainable as possible—for example, using renewable energy sources and public transportation. Although these two principles cannot ensure a sustainable consumption of energy and resources, they can at least set us in the right direction. To further explore how these two principles can work in practice, they are applied to seven urban infrastructure systems in the next section.
Application of the two sustainable principles to urban infrastructure
While the two sustainability principles can be applied to almost any energy and resources, this article focuses purely on urban infrastructure. As a result, many relevant resources are not discussed, such as food and solid waste management, to which the same two principles can be applied.
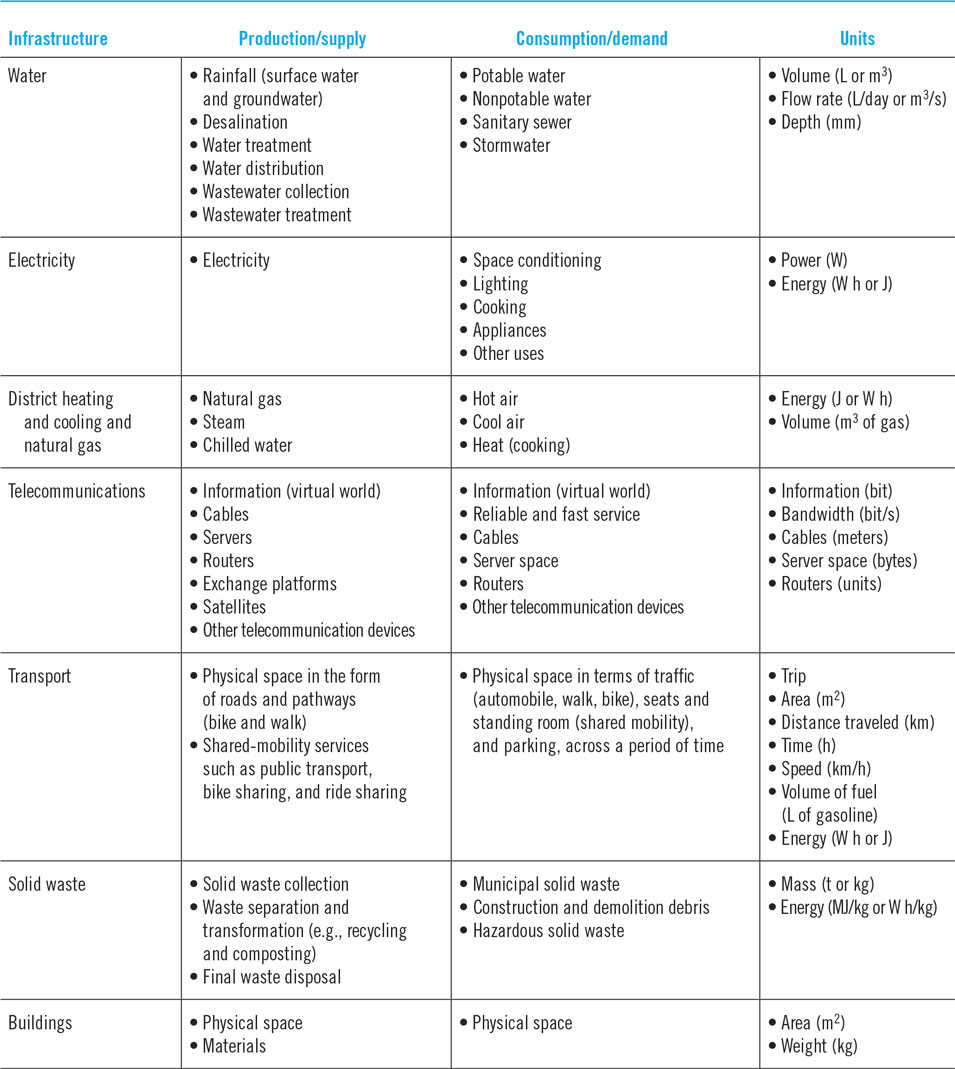
More precisely, the following infrastructure systems are included: water, electricity, district heating and cooling and natural gas, telecommunications, transport, solid waste, and buildings. District heating and cooling and natural gas are grouped together because they deal mostly with space conditioning (i.e., heating and cooling)—with the exception of natural gas that is also used for water heating and for cooking (not discussed here). Table 1 shows a nonexhaustive summary of the primary ways in which these infrastructure systems are demanded and supplied, and the primary units used. Each infrastructure system is analyzed one by one in this section, starting with water.
Urban infrastructure production and consumption.

Water
Water is often credited as the most essential infrastructure service. Not only is it essential to life, water distribution systems have also taken a central role in the effort to clean up cities and to rid cities of deadly diseases at least since the 19th century.Reference Sedlak11 It is therefore not surprising that most cities in the world are located next to water bodies—one of the largest cities not located next to a large water body is Beijing, which suffers from severe water shortage problems.Reference Zhang, Shi and Yang12 The general realm of “water” comes in various forms in cities. Table 1 lists six production/supply infrastructure services for water that can be divided into three groups: water consumption, wastewater management, and stormwater management.
In terms of demand, SP1 applies mostly to water consumption, which has a direct impact on the amount of wastewater generated (i.e., sanitary sewer). The demand for water has grown substantially since the 1700s, especially because water played such a major role to “clean” up cities. In Paris, in 1700, water demand was estimated to be 5 L per person per day.Reference Guillerme, Tarr and Dupuy13 This number then increased to 7 L and then to 10 L by 1817; until 1850, a water consumption of 20 L per person per day was generally accepted. Water consumption in the United States was around 11–19 L per person per day around 1800.Reference Tarr, Tarr and Dupuy14 In the late 1800s, with the general movement toward making cities cleaner and healthier, water distribution systems were created, and water consumption increased to about 100 L per person per day. By 2000, the commonly accepted average water consumption was 380 L (i.e., 100 gal) per person per day for household use (i.e., not accounting for commercial and industrial use) in the United States,Reference Ahmad and Derrible15 but water-scarce areas such as Israel and Singapore were closer to 150 L, mostly using low-flow, low-use, and low-flush appliances and other water conservation strategies. Water consumption can be further decreased, for example, by reusing gray water for toilet use that accounts for about one quarter of the total household water consumption in the United States.Reference DeOreo, Mayer, Dziegielewski and Kiefer16 Applying SP1 is particularly important when it comes to water as people increasingly tend to concentrate in cities (i.e., smaller distribution of population across space), while sources of water are not growing. In fact, climate change is adding significant uncertainty in future rainfall patterns, and water shortages might become even more common in the future, as was the case in Cape Town (South Africa) in spring 2018.
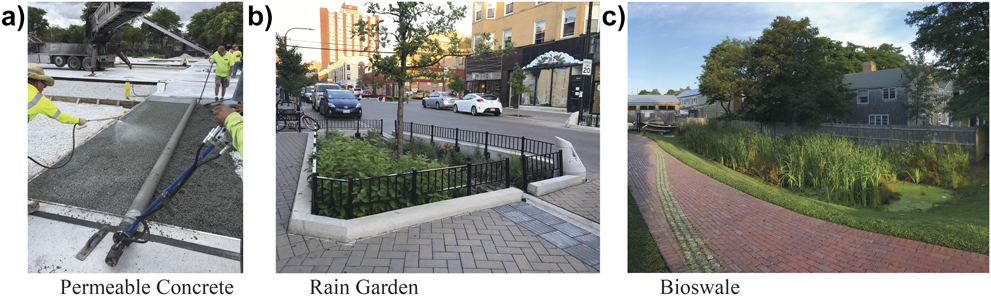
As a supply, water infrastructure can be increased in two major ways. First, the current water distribution systems can be renovated to decrease leakage rates that can be dramatic in some cities; the general assumption in the United States is around 6–16%,Reference Chin17,Reference Chini, Schreiber, Barker and Stillwell18 but some cities such as London and Mexico City (about 30%),Reference Kennedy, Cuddihy and Engel-Yan19,Reference Reader20 and Rio de Janeiro and Sao Paulo (about 50%) have much higher leakage rates.Reference Kennedy, Stewart, Facchini, Cersosimo, Mele, Chen, Uda, Kansal, Chiu, Kim, Dubeux, La Rovere, Cunha, Pincetl, Keirstead, Barles, Pusaka, Gunawan, Adegbile, Nazariha, Hoque, Marcotullio, Otharán, Genena, Ibrahim, Farooqui, Cervantes and Sahin21 More broadly, however, the general practice of water distribution should change. Currently, massive systems are built and operated, sometimes with thousands of kilometers of pipes that are constantly under pressure (around 300 kPa or 45 psi). Effort should be put into designing smaller systems—akin to electric microgrids (next section)—that could be both more sustainable and resilient, while delivering an adequate service. Second, small and large floods induced by major precipitation events have become common in many cities, primarily because surface areas have been covered by impermeable materials like asphalt and concrete. Making cities more permeable, especially with low-impact development (LID) strategies such as green infrastructure, offers great potential to reduce stormwater runoffReference Zhang and Chui22 and fits well within SP2. Small LID strategies include rain barrels, rain gardens, and small bioswales. Larger LID strategies include large bioswales and large catchment areas that limit or even prevent the flow of stormwater into the sewers; public parks and outdoor sports facilities (i.e., soccer field) can be used as retention basins during extreme rainfalls. Strategies depend on whether a sewer system is combined or separated. In combined sewer systems (i.e., combined sanitary and stormwater systems), an overflow leads to the disposal of raw wastewater into natural water bodies. Moreover, stormwater infrastructure could also be made smarter to respond in real time to precipitation events.Reference Kerkez, Gruden, Lewis, Montestruque, Quigley, Wong, Bedig, Kertesz, Braun, Cadwalader, Poresky and Pak23 Figure 2 shows three examples of low-impact development strategies: (i) permeable concrete (here being poured); (ii) rain garden integrated with permeable pavers (an elevated catchment basin is located in the middle of the rain garden to accept excess runoff); and (iii) bioswales (this one is also engineered to naturally treat stormwater).
Examples of low-impact development strategies.

When it comes to water, both SP1 and SP2 are important. In terms of water consumption, SP1 is particularly important, and most cities can implement water conservation strategies. Plus, urban water distribution systems should arguably change substantially in the future, perhaps toward a water microgrid. In terms of stormwater management, SP2 offers substantial benefits to prevent or mitigate urban floods, hence increasing the sustainability of cities.
Electricity
From its humble beginning with Thomas Edison’s 1882 Pearl Street Station in New York City, electricity has arguably become the most pervasive of all services supplied by infrastructure systems. Some even claim that the electricity grid is the largest complex system ever built by humanity.Reference Glover24 In a column published in Decision Analysis Today,Reference Derrible25 I also briefly discussed how, to some extent, the Filipino island of Bohol was less affected by a 7.2 magnitude earthquake (with its epicenter in Bohol) than by a typhoon that hit Leyte (a neighboring island of Bohol) because Leyte supplied Bohol with electricity and the typhoon had knocked out the electricity supply to Bohol for three weeks (no electricity notably meant no running water and toilet for three weeks). What is more, we often forget that the quantities of electricity as a primary energy source are negligible on the Earth. This means that raw energy, including thermal, mechanical, and chemical, has to be converted to produce electricity, and yet so much of it is consumed.
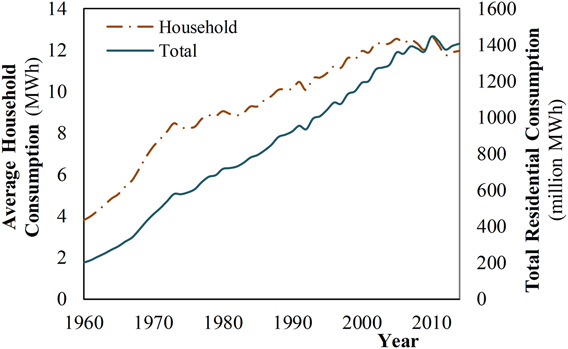
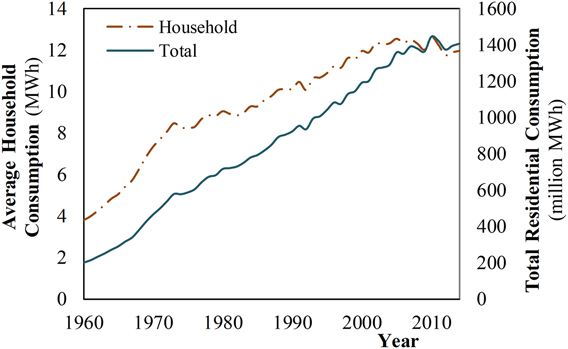
The demand for electricity has grown substantially over time. In 1950, the average yearly household consumption was around 1.6 MW h in the United States,Reference Fox-Penner26 and this number grew to 10.8 MW h by 201627—although there are significant discrepancies within and across states. Figure 3 shows the evolution of the total and per household electricity consumption in the United States from 1960 to 2014.28,29 There are several ways to apply SP1 to electricity. First of all, electricity is the primary source of power for air-conditioning systems, and better building design and insulation, and better operation of air-conditioning systems could lead to substantial electricity savings; in a previous study, we showed that overcooling commercial buildings in the United States were responsible for an additional consumption of about 100,000 GW h in 2012Reference Derrible and Reeder30 (about 8% of the total electricity consumption from commercial buildings). Moreover, when electricity is used for space heating, here again, electricity consumption can be reduced by better insulating and designing buildings and by better operating heating systems. Heat pumps are also preferable to electric radiators as they consume about five times less electricity to provide the same heat input—we will discuss them in the next section. From Fig. 3, we can see that both household level and total consumption seem to stabilize, but the overall electricity consumption is unlikely to decrease in the future as virtually everything we do requires electricity, and increasingly, it also requires some sort of telecommunications that require electricity, hence the need to apply SP2.
Evolution of total and household electricity consumption in the United States, 1960–2014.
When it comes to electricity supply, SP2 is key. First of all, effort should be put into using sustainable energy sources to generate electricity. By sustainable, again, what is meant is sources that can be used forever, and these include all renewable energy sources such as geothermal, hydroelectric, wind, tide, wave, and solar photovoltaic—although solar thermal (normally more efficientReference Bristow and Bristow31) can also be used to reduce electricity use when electricity is used for water heating, thus contributing to SP1. The burning of biomass applies to SP2 as well. Arguably, nuclear energy also applies to SP2, at least in the medium term, as there are ample sources of nuclear fuels on the Earth, and nuclear energy contributes considerably fewer GHG emissions than fossil fuel-powered electricity generation plants. Plus, as a predictable and controllable source of power, nuclear energy can be used to balance renewable energy sources that generally produce electricity intermittently, unless hydroelectricity is an option (as output is predictable and controllable akin to nuclear energy). A second consideration about electricity is not related to emissions but to size. It is uncertain at the moment how sustainable it is to maintain a large electricity grid as is the case at the time of writing. The rationale has been that larger grids offer increasing economies of scale and more stability as electric loads can be balanced more easily, but smaller and more manageable electricity grids may be preferable not only from a sustainability viewpoint but also from a resilience viewpoint. Although we will not dwell on the subject, a significant body of literature exists on energy storage,Reference Al-Hallaj, Wilk, Crabtree and Eberhard32 the smart grid, and the microgrid.Reference Farhangi33–Reference Bayod-Rújula36
For electricity, considering electricity consumption will likely increase further in the future, following SP2 is paramount to achieve sustainability.
District heating and cooling and natural gas
District heating and cooling systems, and natural gas systems, are also commonly present in cities around the world. From an engineering perspective, the two systems are vastly different. In fact, district heating and cooling systems often directly use electricity and/or natural gas. Moreover, district heating and cooling systems are mostly built for large building complexes, such as office, university, and hospital complexes, as well as in central business districts (they are less common in smaller residential and commercial buildings). They are combined here simply because they offer the same service, that is, space conditioning. In other words, what is demanded (i.e., space comfort) is similar. The only exception is that natural gas can also be used for cooking and for water heating.
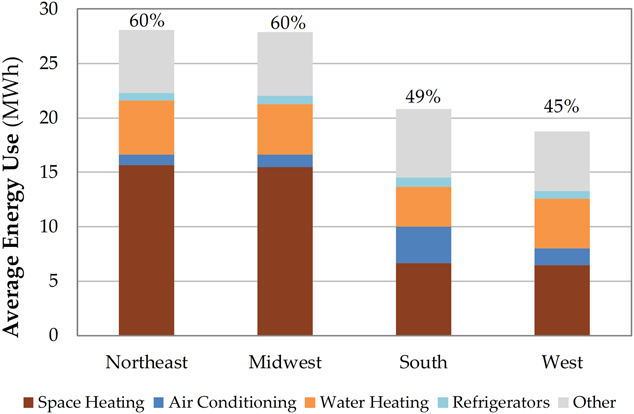
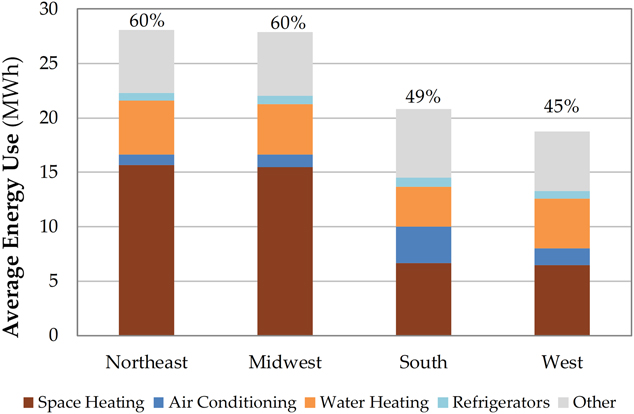
In this section, the focus is purely on space conditioning (i.e., heating and cooling) as it represents the largest consumers of energy in buildings. Figure 4 shows 2015 average residential building energy use trends by U.S. regions.37 The percentages above each bar show the contribution of space conditioning toward the total energy use. We can see that on average, space conditioning accounts for about 55% of building energy use, although climate has a large impact. Similar trends are found in the European Union as space conditioning accounts for about 51% of the total building energy use.Reference Fleiter, Steinbach and Ragwitz38 In terms of SP1, similar to electricity, the demand for space heating and cooling can be achieved by better insulating and designing buildings and by better operating heating and cooling systems. Looking more closely at Fig. 4, buildings in colder climates (i.e., Northeast and Midwest) consume a significant amount of energy for space heating. In contrast, buildings in warmer climates (i.e., South) consume a much less energy for space conditioning, although the energy use for space cooling is specifically higher. This is because heating tends to be much more energy intensive than cooling. Indeed, cooling is achieved by transferring heat from one area to another using a heat pump. One unit of energy can be used to displace three or four units of heat. In contrast, heating is often achieved by converting one type of energy to another—for example by burning gas or by passing a current through a resistance as in an electric radiator—and the maximum efficiency possible is 1. An alternative is to use a heat pump for heating as well, such as an air-source or ground-source heat pump that uses electricity and that can consume one unit of energy to displace four or five units of heat. Although they can be costly to install—with internal rates of return of around 2%Reference Bristow and Bristow31 at the time of writing—they are extremely effective and they will likely become more mainstream in the future.
2015 Average residential building energy use by the U.S. region. Percentages show the combined energy use of heating and cooling.
A combination of SP1 and SP2 possesses significant potential here to reduce the demand for energy used toward space heating and cooling. In fact, using off-the-shelf technologies, achieving 90% reductionsReference Parker39 in energy use is not difficult while being paradigm-shifting. In fact, space conditioning offers the infrastructure service that can most easily become sustainable.
Based on these elements, we can ask ourselves whether it is more “sustainable” to use electricity or natural gas for space heating. Beyond the fact that natural gas is a fossil fuel—thus unsustainable because it is only available in finite quantities—the answer depends on how electricity is generated. In general, if emissions related to regional electricity generation exceed 191 g CO2e/kW h, using natural gas can be preferable (see details hereReference Derrible40) from a GHG viewpoint. From a more general perspective of sustainability, however, natural gas systems also represent a health hazard—that is, like water distribution systems, natural gas systems are constantly under pressure and they inevitably leak, and a study in Boston found a leakage rate of about 3%.Reference McKain, Down, Raciti, Budney, Hutyra, Floerchinger, Herndon, Nehrkorn, Zahniser, Jackson, Phillips and Wofsy41 The use of natural gas therefore appears to be “tolerable” (Fig. 1), but it will have to stop.
Telecommunications
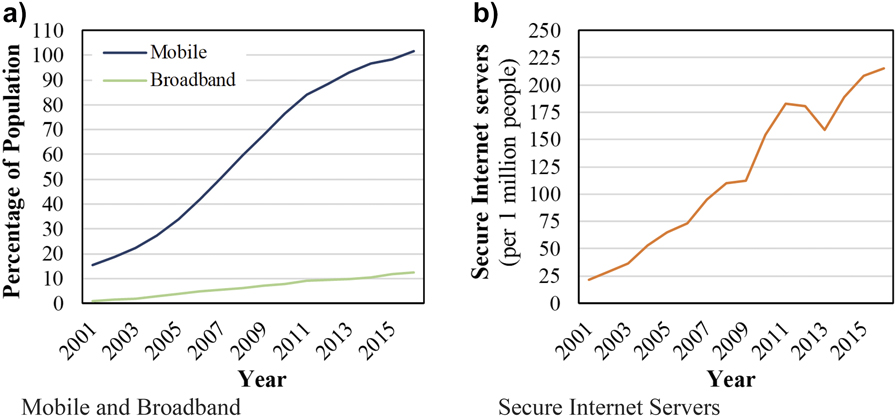
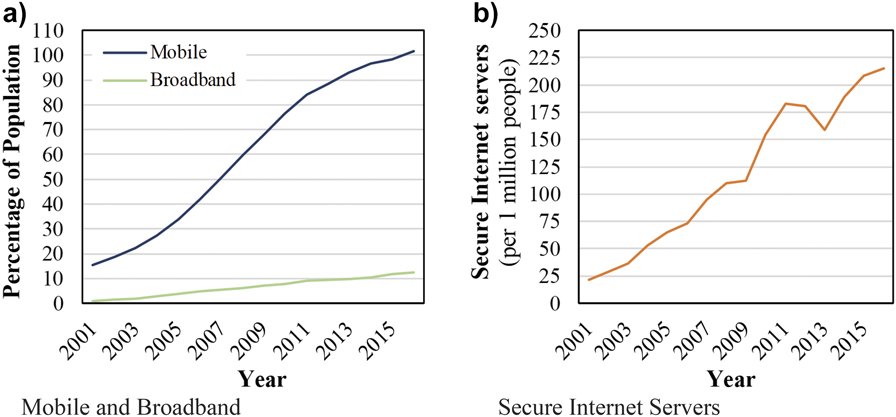
Telecommunications may be the most recent of all infrastructure services, but it is also the one that has grown most rapidly since the 2000s. In fact, although telecommunications first started in the late 18th century with the telegram, then with the telephone in the late 19th century, and then with the television in the mid-20th century, it is really the Internet, created in the 1960s, that fueled the recent growth of telecommunications. Using data from the World Bank,42 Figure 5 shows some of this growth that is perhaps best represented by mobile services (used both for telephoning and for accessing the Web). Barely existent in the 1990s, the percentage of the population in the world with a mobile subscription rose from 15% in 2001 to 102% in 2016—that is, there are more mobile subscriptions than people on the Earth. Figure 5(a) also shows the percentage of subscriptions to broadband, and we can see that it is lot more limited with a 2016 subscription rate of about 12.5%. Figure 5(b) shows the number of secure Internet servers per 1 million people. After a dip in 2012, the number of servers increased again, likely thanks to the rise of “cloud” computing.
Growth of Internet infrastructure and mobile access.
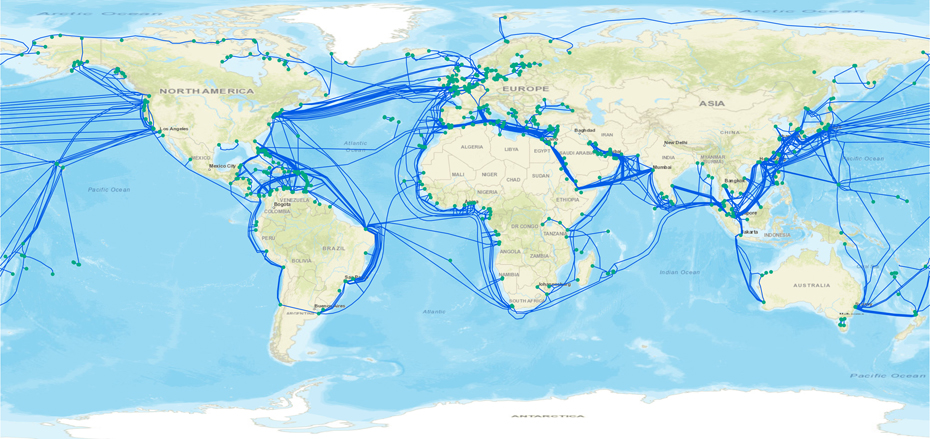
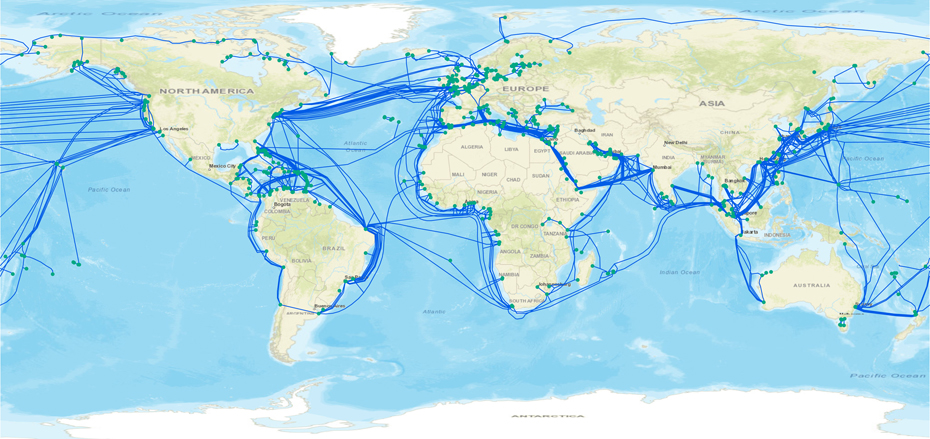
One point needs to be clarified about telecommunications. Specifically, we need to distinguish the physical world from the virtual world. The physical world includes all the cell towers, cables, routers, servers, exchange platforms, satellites, and all other physical equipment needed for telecommunicationsReference Blum43 (i.e., the Internet technically only includes the physical equipment). In contrast, the virtual world includes all the Web sites and information stored in servers and exchanged in cables and wirelessly. The distinction is important because while there is little doubt that the virtual world will continue to increase substantially, the physical world might not grow as much. Figure 6 shows a map of the submarine fiber-optic cables around the world. We can see that the network is already dense; plus, it is worth remembering that for transport, while traffic substantially increased after the 1960s, more than half of the roads had already been built by 1950 in the United States.Reference Ausubel and Herman44 The application of SP1 and SP2 therefore takes a slightly different meaning for telecommunications.
Map of submarine fiber-optic cables.
In terms of SP1, the goal is not to limit the number of services offered—a little like the trip as we will see for transport (next section). Instead, it could be to control the energy used in telecommunications, which will happen through advances in energy efficiency in information and communication technologies. Energy use is in fact an important limitation for the future growth of the physical telecommunication infrastructure.Reference Bolla, Bruschi, Davoli and Cucchietti45,Reference Aktas46
In terms of SP2, the goal is to install more energy efficiency equipment as well as to use electricity supply sources that also obey the two sustainability principles. Many Google servers, for example, are located in the Dalles (OR) and they are powered with hydroelectricity. SP2 can also take a different meaning here as well. In particular, an increasing number of existing infrastructure services rely on telecommunications—for example, supervisory control and data acquisition (SCADA) systems used in water, electricity, and natural gas systems rely on telecommunications and so do many traffic signals in transport. The use of telecommunication systems creates new dependencies that, if not well designed, can create vulnerabilities that might hinder the sustainability of infrastructure systems. In terms of SP2, the concept of resilience becomes important, although it will not be discussed here (WoodsReference Woods47 offers a great introduction to resilience).
Considering the telecommunication system had not matured at the time of writing, SP2 is more important (partly to help SP1), noting that new systems should also be resilient to be sustainable.
Transport
Compared to the supply and demand of water, electricity, natural gas, and information, transport is fundamentally different. In transport, what is “demanded” is generally the means to access a location, and what is “supplied” is physical space and sometimes motion to access this location. Trips made with private automobiles, private bikes, and walking only require physical space, while trips made with shared-mobility services (e.g., transit, bike sharing, and ride sharing) require both physical space and a service that provides motion/movement to reach a destination. Transport is therefore slightly more difficult to define in the context of this study than other infrastructure systems—Table 1 lists seven units for transport, and the list is not exhaustive—but SP1 and SP2 can be applied in a similar fashion. As a side note, as environmental problems related to the use of fossil fuels to power transport are well known, this section focuses on the sustainability of transport as a service, which deals mostly with congestion. Therefore, while electric vehicles could partly solve environmental problems related to car use, problems related to traffic congestion would remain unsustainable.
When it comes to transport demand, in transport engineering, the most important unit is most often the trip—a trip is a transport activity to go from one location to another location. The trip is not relevant for sustainability, however, as the goal is not to reduce the number of trips—more trips are in fact generally desirable for a healthy economy. Instead, the first goal is to reduce the amount of space used. This is why active transport (i.e., walking and biking), shared-mobility services (i.e., transit, bike sharing, and ride sharing), and car-pooling (i.e., multiple people in a car) are preferable to single car use. In other words, one person in one car uses much more space than one person walking, one person on a bike, one person in a train/bus, or even one person in a car that carries four people. For this reason, strategies to reduce space use are generally desirable, from implementing policies that favor transit use to controlling parking prices to deter auto use, and they fit well within SP1. Moreover, novel technologies can help as well, for example, by providing real-time location of transit services.Reference Cottrill and Derrible48 The second goal is to reduce the distance traveled. For example, a 5-km car trip is preferable to a 10-km car trip as half the space is used over time. Policies to reduce distance traveled often need to include elements of land use,Reference Levinson and Krizek49 for example, by intensifying land use (i.e., single-detached houses versus townhouses and mid-rise and high-rise buildings).
In terms of supply, most cities in high- and upper-middle-income countries already have a sufficient number of roads. Moreover, one of the biggest lessons from the 1960s and 1970s, when many cities built urban expressways, was that an increase in road supply usually leads to an increase in demand, and congestion often got worse after the opening of a new road.Reference Vuchic50 Regardless of how bad traffic is, the supply solution is most often not to build new roads, but to offer services, so people use less space, for example, by building new transit lines (i.e., new transit service removes traffic from roads, thus lessening traffic) or at least by implementing high-occupancy vehicle (HOV) lanes. This fit well within SP2. Parking is another important issue as it deals directly with space use, and increasing space dedicated to parking can have negative impacts on cities.Reference McCahill and Garrick51,Reference McCahill, Haerter-Ratchford, Garrick and Atkinson-Palombo52 In fact, parking offers a paradox,Reference Shin, Vuchic and Bruun53 because more parking may attract more car users, but if too much space is given to parking as opposed to other land uses (e.g., shops), then car users may not have any reason to travel to a location in the first place. Less space dedicated to parking or more onerous parking may provide an incentive to use an alternate mode of transport—only if an alternate mode of transport is available, hence the need to invest in transit. As for autonomous vehicles (AVs), they do not belong to SP2. Similar to building new roads, while AVs may improve traffic conditions initially,Reference Cui, Seibold, Stern and Work54 demand would inevitably catch up and traffic would get worse. In fact, single-use AVs (as opposed to shared) may simply increase the tolerance of people to spend more time in their car, leading to the consumption of more space, thus resulting in further congestion.55 Strategies that belong to SP2 further include the construction of sidewalks and bike paths and the construction of infrastructure for traffic calming and to increase walking and biking.
For transport, SP1 is key and a suite of strategies that are often grouped within the general realm of travel demand management (TDM) exists. Many of these strategies are not new. In fact, many have been known for a long time. In her seminal 1961 book The Death and Life of Great American Cities, Jane JacobsReference Jacobs56 had already pointed to many transport issues, and she exposed several solutions, which included four conditions for diversity (multiple-use buildings, short blocks, mixtures of building ages, and sufficient population density) that have a direct relationship with sustainability.Reference Mohareb, Derrible and Peiravian57
Solid waste
Akin to transport, what is demanded and supplied in solid waste must be explained. The demand for solid waste is captured by solid waste generation—that is, the amount and composition of solid waste that is produced in units of mass, for example, in metric tons. In other words, what is “demanded” is a service to handle the solid waste generated. As a response, the “supply” of solid waste are solid waste management strategies that not only include final disposal options (e.g., landfilling), but also include strategies to reduce the amount of solid waste generated (SP1) and to recycle as much solid waste as possible (SP2). In this section, the focus is on municipal solid waste (MSW) that includes most solid waste from residential, commercial, institutional, industrial, and municipal service sectors. Data were collected from the U.S. Environmental Protection Agency58 (EPA), and MSW does not include construction and demolition debris that often make up 50% of all solid waste generated.
The history of solid waste is interesting as solid waste management is a direct result of urbanization, and it is often the only infrastructure service that is completely within the purview of local governments.Reference Hoornweg, Bhada-Tata and Kennedy59 Before humans settled permanently and before those settlements grew, the management of solid waste was simply not an issue. Moreover, until the 18th century, much of the solid waste generated consisted of food wastes, sanitary sewage, and construction debris that could be handled relatively easily. The term “relatively” is used cautiously here as many of the epidemics that killed millions of people throughout the world came as a result of poor solid waste management practices (often through contaminated groundwater wells). What is meant is that the main management practice to handle solid waste in many cities was to let animals eat it, which was often sufficient. This changed in the 18th and 19th centuries as cities became larger and as more solid waste was generated. For an account on the history of solid waste management, Wilson,Reference Wilson60 Louis,Reference Louis61 and MelosiReference Melosi62 are recommended.
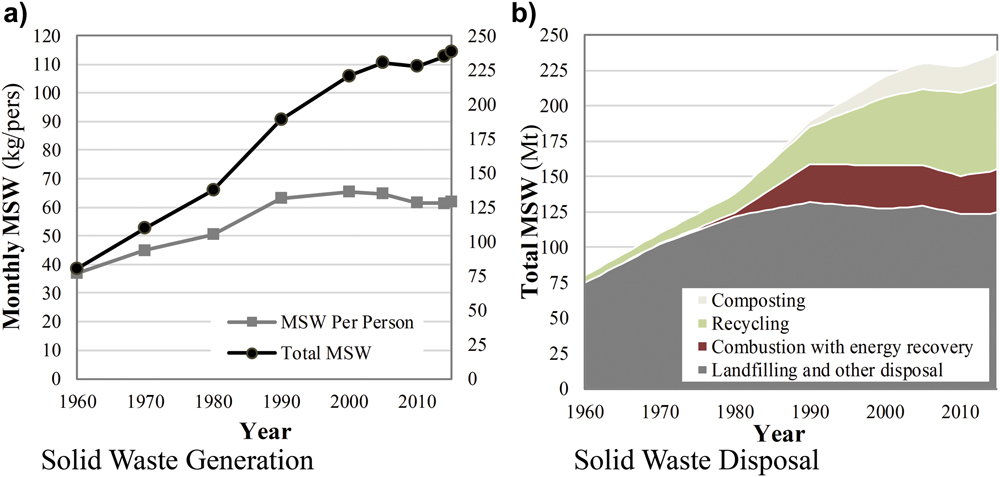
For solid waste, priority is put on SP1. In other words, the goal is to reduce how much solid waste is generated. Figure 7(a) shows the evolution of MSW generation in the United States from 1960 to 2015; the left y-axis shows monthly per person MSW values, and the right y-axis shows total MSW values. We can see that the person and total generation of MSW have increased by a factor of 1.7 and 3, respectively, between 1960 and 2015. In 2015, the average American generated 61.8 kg of solid waste per month, which is often quoted as the average American throws away their body weight in solid waste every month. Efforts made by the end of the 20th century seemed to have stabilized the amount of waste generated per person, but the total amount of waste generated has continued to increase. The case of the United States is not unique. In fact, it is shared by most high-income countries—the report World Bank What a Waste: A Global Review of Solid Waste Management Reference Hoornweg and Bhada-Tata63 contains the data for most countries of the world. In solid waste management, the reduction in solid waste has been recognized as the highest priority at least since the 1970s, and it features at the top of the U.S. EPA waste management hierarchy that includes the following: (i) source reduction and reuse, (ii) recycling and composting, (iii) energy recovery, and (iv) treatment and disposal. Moreover, reduce is also the first of the famous three R’s of solid waste management: reduce, reuse, and recycle—a fourth R exists, and it stands for recover. Most effort should therefore be put into applying SP1, but SP2 can also be applied.
Historical municipal solid waste generation and disposal in the United States, 1960–2015.
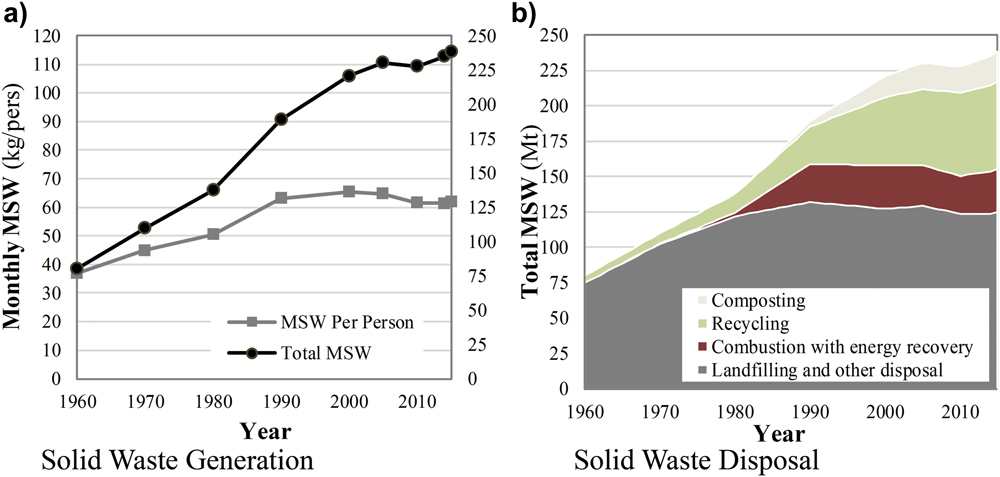
Once solid waste has been generated, there are several ways to apply SP2. First, once a product is discarded, it should be reused if possible, either to its original function (e.g., from selling/donating a piece of electronics to reusing a shopping bag) or to a different function (e.g., metal container reused for storage). If a product cannot be reused, it can then be recycled with as little transformation as possible. Many materials can be recycled such as paper and cardboard, steel and aluminum cans, and plastics. Glass can also be crushed into sand, and wood can be chipped. Food wastes can also be “recycled,” either in the form of aerobic composting (to be used as fertilizer) or in the form of anaerobic digesting (generating methane that can be used to produce electricity/heat). Material can also be recovered, for example, by recovering construction materials and metals present in buildings before they are demolished. Material recovery from the building stock is part of the emerging field of urban mining.Reference Graedel64,Reference Koutamanis, van Reijn and van Bueren65 After these initial options, organic waste can be burned and the energy produced can be used to generate electricity and/or heat. Finally, the solid waste can be landfilled, preferably in sanitary landfill that both prevent the contamination of the land around the landfill and enable the collection of methane produced (similar to anaerobic digestion). Figure 7(b) shows that landfilling has been the dominant strategy used in the United States since the 1960s. By 2015, about 50% of the solid waste generated ended up in a landfill, followed by about 35% that was recycled or composted, and finally 15% that was combusted with energy recovery.
For solid waste, the application of SP1 is a priority, although strategies to apply it are less obvious. In particular, effort can be put into encouraging people to reuse their products instead of discarding them, and manufacturers can be encouraged to use less material and packaging. Because of the difficulty in applying SP1, the application of SP2 is important as well, especially to promote recycling and composting, which often involves separating solid waste at the source (e.g., with different trash cans).
Buildings
Although buildings are naturally part of the infrastructure system, the building stock is not typically thought of as an urban infrastructure system, and yet people spend nearly 90% of their times inside buildings.Reference Klepeis, Nelson, Ott, Robinson, Tsang, Switzer, Behar, Hern and Engelmann66 Residential and commercial buildings also consume about 40% of the total energy used in the United States.67 Most of that energy is consumed in the form of electricity and natural gas, however, which have their own section in this study. For this reason, in the context of this article, the focus is on two elements of buildings not captured by other infrastructure systems: space (expressed as an area in m2) and materials (often expressed as a weight in kg).
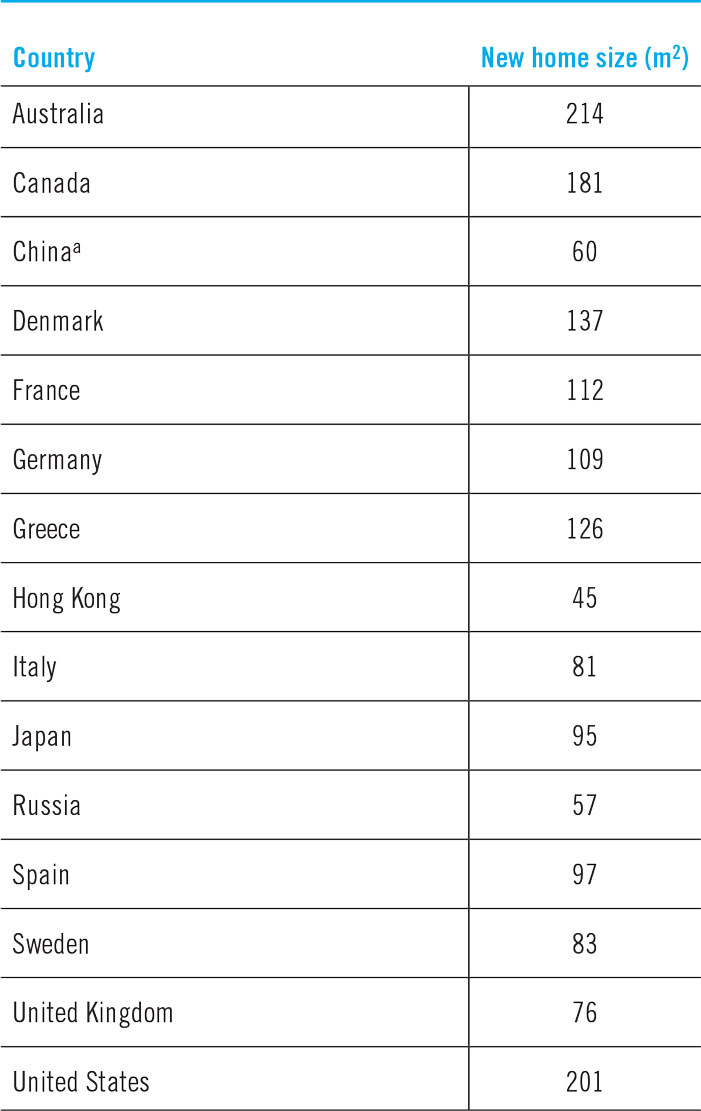
The demand for buildings can vary dramatically by country. Table 2 shows the average size of a new home (2009 data) for 15 countries in the world.Reference Wilson68 Australia, the United States, and Canada use the most space with new home sizes of about 200 m2. Denmark, Greece, France, and Germany come next with home sizes varying roughly from 110 m2 to 140 m2, and they are followed by Japan (95 m2). Other European countries come next with Spain, Sweden, Italy, and the United Kingdom having average new home sizes between 75 and 100 m2. Finally, China, Russia, and Hong Kong come last with home sizes of 60, 57, and 45 m2, respectively. New homes in Australia are therefore 4.75 times larger than those in Hong Kong. Every building also requires construction materials. In particular, concrete is the material that is most consumed in the world, before oil and coal. In 2012, about 30 billion tons of concrete were consumed,Reference Ashby69 and noting that concrete has a carbon intensity of about 0.1 kg CO2 per kg of concrete,Reference Hammond and Jones70 30 billion tons of concrete represent 3 billion tons of CO2 (in 2012 alone). Considering differences in average home size per country, we can conclude that applying SP1 in some contexts could help control the demand for space and material for buildings. This is especially the case in the sprawling suburbs of Australia, the United States, and Canada. Moreover, we need to account for the fact that larger homes can also lead to higher consumption of electricity, natural gas, water, and transport (i.e., increases in driving distances). Therefore, while better building designs and insulation are needed to help decrease the consumption of electricity and natural gas, in some contexts, effort should also be put into reducing the amount of space consumed by buildings.
New home size by country in square meters (m2) (data source: Wilson).
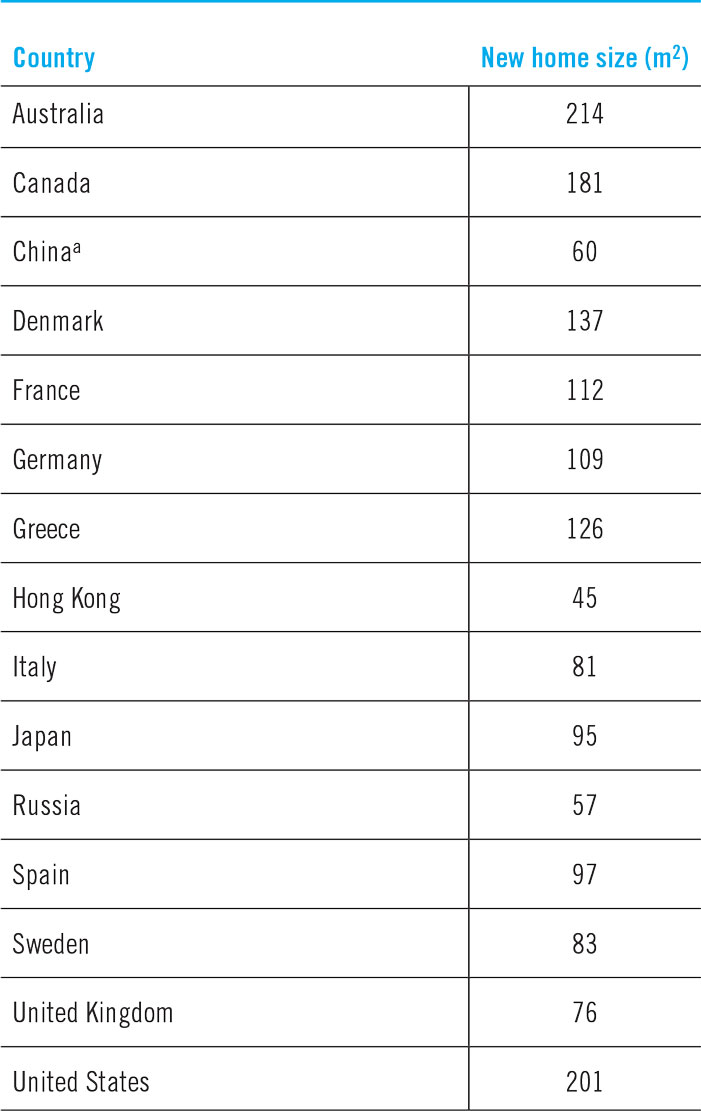
a Urban only.
In terms of supply, buildings are difficult to analyze. New buildings are needed across the world, whether they are built on empty lots or whether they replace existing buildings (from which materials can be recovered—see section Solid waste). This is especially the case as the world’s population is expected to increase to 11 or 12 billion by 2100. Whether the supply of a new building is sustainable or not partly depends on local contexts. Moreover, new buildings should be adequately sized. Nonetheless, in an era of bioinspired and metamaterials,Reference Miodownik71 new materials and a better use of current materials have the potential to completely change how buildings are designed and how much energy they consume in the first place.Reference Koebel, Wernery and Malfait72
The application of SP1 and SP2 to buildings is therefore a little more difficult. By focusing purely on space and materials, we see that both SP1 and SP2 can be applied, although their applications should be coordinated with all other infrastructure systems.
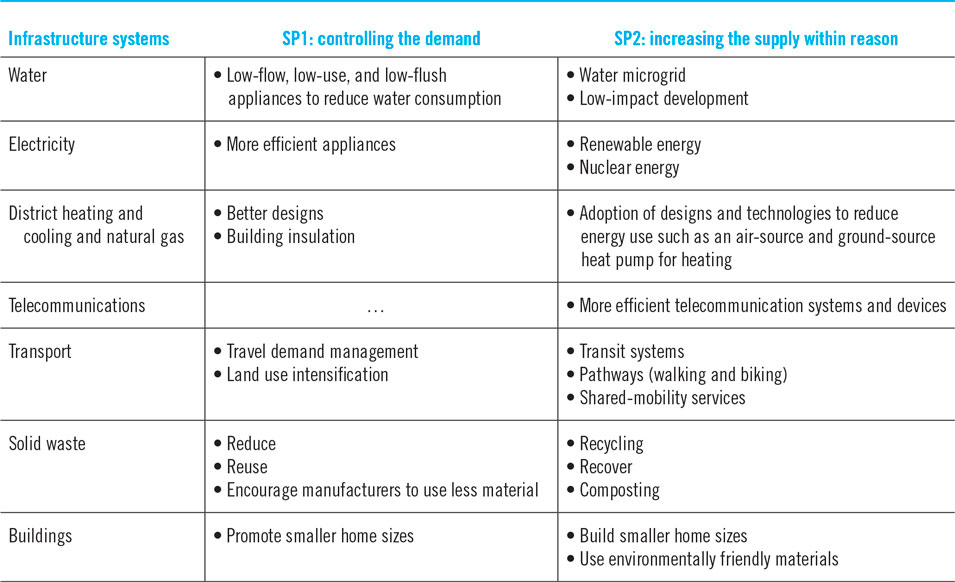
This concludes our application of the two sustainable principles to the seven urban infrastructure systems studied in this article. Table 3 summarizes some of the strategies given for SP1 and SP2. Next, an approach to sustainable urban infrastructure design is discussed.
Summary of strategies for SP1 and SP2.

An approach to urban infrastructure design
As cities will change and adapt to address their challenges, one quote comes to mind from John Reader’s book Cities: “Cities are transitory markers in the progress of civilization, not permanent fixtures.” (p. 304)Reference Reader20 As the previous section highlighted, much progress is yet to happen to design, build, and operate sustainable cities. Moreover, we need to realize that the infrastructure systems that we discussed do not work in isolation. In fact, not only do they coexist, they are often interdependent, and therefore, changes in one infrastructure system almost systematically affect all other systems. These interdependencies were ill understood at the time of writing,Reference Miodownik71,Reference Koebel, Wernery and Malfait72 but better controlling them will become essential in the future. In particular, effort should be put into designing interdependencies with specific properties that enhance sustainability and resilience.
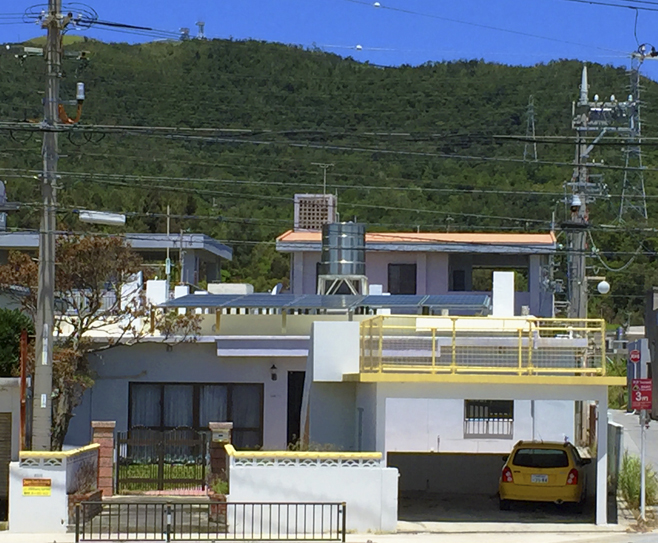
To illustrate this last point, Fig. 8 shows a house in the Japanese island of Okinawa. As a building, the house uses solar energy for water heating (i.e., steel drum on the roof) and to produce electricity (i.e., solar panel on the roof), thus potentially requiring less electricity from the power grid. Moreover, we can hypothesize that the building is relatively well insulated and that it requires less energy for space heating—that is, the average temperature in the coldest month (January) is 16.5 C (62 F)—that can be provided by an air-source heat pump (again using electricity partly produced on site with solar energy). We can also hypothesize that the building is made of recovered material and that household members use public transit and that the one vehicle in the picture is shared among household members (and that eventually it could be electric). Furthermore, we can also hypothesize that drinking water is provided by a nearby source and a reservoir storing enough water for a day or two is located on top of the hill in the background so that the system uses gravity—that is, thus still supplying water in the event of a power outage. The house may also be fitted with low-flow, low-use, and low-flush appliances, and it could even be fitted with a secondary water treatment process at the house to ensure the water is clean even if the water pipes delivering water are not constantly under pressure. Furthermore, occupants may generate little solid waste, and even then, they may have several trash cans to sort solid waste based on whether it is recyclable (e.g., aluminum cans), compostable (e.g., food wastes), or not. The solid waste that cannot be recycled or recovered could then be brought to a local waste-to-energy (WTE) processing plant so that it is burned, and the electricity produced can be supplied in the transmission lines located above the house. A number of other hypotheses can also be made, but we can see that SP1 strategies can be applied to reduce demand significantly and that the house and the neighborhood can be fitted with various features according to SP2 that would also help SP1.
House in Okinawa (Japan).

Following the discussion in this article, a four-step urban infrastructure design (UID) process is proposed and it can be followed before designing any new piece of infrastructure. These four steps should be applied sequentially:
1. Controlling the demand to reduce the need for new infrastructure,
2. Integrating a needed service within the current infrastructure,
3. Making new infrastructure multifunctional to provide for other infrastructure systems,
4. Designing for specific interdependencies and decentralizing infrastructure if possible.
Urban Infrastructure Design step 1 (UID1) essentially follows SP1. Instead of building new infrastructure, it might be possible to reduce the demand for the infrastructure in the first place using proper incentives, for example, by adopting travel demand management strategies in transport, by recommending low-flow, low-use, and low-flush appliances to reduce water consumption, by better insulating a building to reduce space-conditioning loads, and by reusing solid waste as much as possible. This is particularly important as some infrastructure systems are oversized, which may end up costing more energy and money in the long run—for example, oversized chillers in buildings can lead to overcooling that is uncomfortable while consuming more energy.
UID2 suggests the integration of any new service within an already existing infrastructure system. The rationale is essentially to leverage existing infrastructure systems. One example is to install green infrastructure (e.g., rain gardens and small retention/detention basins) in streets across a city as is done in Philadelphia, as opposed to building large underground reservoirs such as DigIndy in Indianapolis and TARP in Chicago that tend to cost billions of dollars and that are not necessarily effective.Reference Sedlak11 Moreover, UID2 is commonly followed in telecommunications as fiber-optic cables often follow railway tracks; in Chicago, the municipal government also placed fiber-optic cables in sewer pipes to provide Web access to certain areas.Reference Ouyang73
UID3 follows the premise that if new infrastructure needs to be built, it can be used to provide more than one service—this is similar to the colloquial saying “killing two birds with one stone.” For example, when a road needs to be resurfaced or upgraded, it can be fitted with green infrastructure at the same time. When a building needs to be retrofitted or built, it can be equipped with an air-source or ground-source heat pump and/or with a solar water heater and solar panels. This inherently requires better coordination between the providers of the various infrastructure services, which is not necessarily trivial, but which presents substantial benefits—and which seems to be gaining traction as municipal departments increasingly work together in many parts of the world (especially when it comes to installing low-impact development).
Finally, UID4 focuses specifically on interdependencies so that a piece of infrastructure can be more resilient if another system is affected. Conceptually, UID4 is relatively more difficult to understand, and many strategies remain to be created or discovered, but an illustrative example is to equip electric equipment such as streetlights, traffic signals, and water pressure gauges with their own sources of power and power storage (e.g., solar panels or wind turbines, and a battery), so they are less “dependent” on the power grid. In a similar fashion, building attics might be fitted with water tanks in case of failure of a water distribution system and possibly of the power grid (that is why the reservoir should be elevated to leverage gravity for water supply)—that is, in Japan, most people do not drain their bathtubs at night in the event an earthquake occurs.Reference Dueñas-Osorio, Craig, Goodno and Bostrom74
In the end, this four-step urban infrastructure design process is fairly intuitive. The main barriers to applying them are mostly institutional—from an administrative viewpoint, that is, who is responsible for a project that involves multiple service providers?—and cultural—as in the culture of an organization. Indeed, the problem is not inherently technological, although the future technologies will likely contribute to UID4 (e.g., for water microgrids and efficient electricity storage). Overall, by following the two sustainability principles, the successful implementation of this four-step UID process has the potential to significantly help cities become more sustainable.
Conclusion
While cities have evolved tremendously over the ages, the reason why human beings decide to form settlements and live together has not changed, or at least it has not changed since Aristotle wrote “The city-state comes into being for the sake of living, but it exists for the sake of living well” as cited at the beginning of this article. To be able to provide a livable environment, cities have had to evolve over time, partly to address the challenges they had to face, and this process is unlikely to change in the foreseeable future. In this article, the main argument is that cities face two major challenges that are likely to transform urban infrastructure systems. First, cities will need to consume much less energy and much fewer resources, and second, cities will need to become much more resilient. These two challenges are significant, but they also offer an opportunity to rethink how cities are planned, designed, built, and operated. By adopting a focus on sustainability, the main goal of this article was to introduce two sustainability principles and a four-step urban infrastructure design process.
To achieve this goal, the general concept of sustainable development applied to cities was defined and discussed, revealing three types of scenarios: sustainable, tolerable, and unsustainable. Realizing that this definition could not lead to practical measures, the discussion led to the development of two sustainability principles: (SP1) controlling the demand and (SP2) increasing the supply within reason. At the core of this article, the two sustainability principles were applied to seven urban infrastructure systems: water, electricity, district heating and cooling and natural gas, telecommunications, transport, solid waste, and buildings. With this exercise, we learned that some infrastructure systems should primarily focus on SP1 (district heating and cooling and natural gas, transport, solid waste, and buildings), while others should focus on SP2 (electricity and telecommunications), and finally that the urban water realm should focus on both (i.e., SP1 for water consumption and SP2 for low-impact development). Quite naturally, this analysis led to the development of a four-step urban infrastructure design process that can help design more sustainable and resilient urban infrastructure systems: (UID1) controlling the demand to reduce the need for new infrastructure, (UID2) integrating a needed service within the current infrastructure, (UID3) making new infrastructure multifunctional to provide for other infrastructure systems, and (UID4) designing for specific interdependencies and decentralizing infrastructure if possible. While many barriers exist nowadays to apply these UID guidelines, most are institutional and cultural as opposed to technological, and many successful examples exist75,Reference Chavez76 and provide hope, especially in this age of the big data and virtually limitless computing power.Reference Mulrow, Derrible, Ashton and Chopra77–Reference Lee, Derrible and Pereira84
In the end, the main message of this article is that a better design of urban infrastructure systems is key to addressing some of the challenges that cities have to face. By first recognizing that urban infrastructure systems are inherently integrated and interdependent, this article offers several strategies and guidelines to help design cities that are sustainable and resilient, thus providing a more livable environment for the generations to come.
Acknowledgments
This research is partly supported by the National Science Foundation (NSF) CAREER award #155173 and by the NSF Cyber-Physical Systems (CPS) award 1646395.