

1 Introduction
This paper describes the case study of a Statistical Machine Translation (SMT) system. The task is somewhat of a classic in the field of Machine Translation (MT): It consists in the translation of weather information between English and French. Therefore, at first it would seem to be a pretty straightforward application, but developing a production quality system proved to be a much more complex engineering task. Consequently, we thought it would be interesting to document the (numerous) steps involved in the creation of the necessary corpora, the test of different SMT engine settings, the integration of a translation memory, the finishing touches on the output and finally the human evaluation of the translations produced. These steps are almost never entirely described in the literature, even though they require a great deal of effort and have an important impact on the acceptability of the final output.
Too often, high quality training corpora are taken for granted or downloaded from a few sources on the Internet, but in our context public domain parliamentary transcripts proved not to be appropriate. Instead, we had to harvest parallel text from sometimes poorly maintained archives. To further complicate the matter, their bulk was in a form that could not be readily exploited, since properly cased letters and diacritics were missing. In contrast, our goal was to produce translations as close as possible to a properly formatted text. Although the exact processes we describe are specific to our application, we are convinced that any production quality SMT system will have to go through similar unglamorous but nevertheless essential procedures.
This paper emphasizes the need for the integration of many sources of information to produce a high quality translated text. In this project we made good use of our long experience in the area of processing weather information and were benefited greatly from our close association with the people at Environment Canada (EC). They kindly agreed to offer rich sources of meteorological information and provided continuous feedback on the state of our prototypes. Indeed, too often MT projects rely solely on automatic evaluation methods such as Bilingual Evaluation Understudy (BLEU) scores, but the real test is human evaluation. It is costly but, as we show, these statistics can bring a much better insight into the development of a production quality system.
Any ‘real’ SMT system is much more than a mere translation engine; it features modules to gather source text, to preprocess it, to keep the output in a translation memory and to produce formatted text appropriate for dissemination. This paper describes in detail the intricacies of such a system, not often described but nevertheless essential in a production setting. At each step, we will present the choices that have been made through a patient examination of the source texts, the translation models and the outputs. Even though we are well aware that we did not always consider all alternatives and sometimes had to opt for simplicity because of time and resource constraints, we are confident that the resulting system is a good language engineering use case, given our experience with these corpora.
2 Context of the application
In the early 1970s, a research group at the Université de Montréal called TAUM completed an MT project called TAUM-MÉTÉO, which has been called the most successful case for this type of technology (Mitkov Reference Mitkov2005: 439). This system was developed for translating weather forecasts issued by Environment Canada from English to French, a problem that lent itself well to automation, given the highly repetitive nature of the text and the tediousness of this specific translation task for humans. TAUM-MÉTÉO relied on dictionary lookup and syntactic analysis, followed by simple syntactic and morphological generation rules. An overview of the system can be found in Isabelle (Reference Isabelle and King1987).
TAUM-MÉTÉO and a number of successors (see Chandioux Reference Chandioux1988) were deployed at Environment Canada. From 1984 to 2004, these have continually translated English weather forecasts. Translation professionals from the Canadian Translation Bureau supervised the process and made sure that the occasional spelling error or other difficulty found in the source text did not prevent the production of a French forecast. The quality of TAUM-MÉTÉO's output is considered very high (Macklovitch Reference Macklovitch1985). In 2004, this system was rendered obsolete by an interactive expert system called SCRIBE (Verret et al. Reference Verret, Vigneux, Marcoux, Petrucci, Landry, Pelletier and Hardy1997) that meteorologists now use to create forecasts in both languages simultaneously, thus obviating the need for translation.
In 2005, Langlais et al. (Reference Langlais, Gandrabur, Leplus and Lapalme2005) rationally reconstructed TAUM-MÉTÉO, this time employing corpus-based approaches rather than a pure rule-based strategy. Environment Canada provided them with more than 300,000 forecast bulletins produced in 2002 and 2003, and the authors created a system combining a translation memory, an SMT engine and a neural network rescorer. This more modern approach produced results comparable to TAUM-MÉTÉO's.
Langlais et al. (Reference Langlais, Gandrabur, Leplus and Lapalme2005) also explored the topic central to the present paper, that is, the translation of Canadian public weather warnings. These warnings are written in a much freer style than that of the sublanguage of forecasts, and consequently cannot be fully handled by TAUM-MÉTÉO. However, their timely translation is of the utmost importance. The researchers reported good results and once again noted the utility of combining a translation memory with a statistical engine.
Our study follows in the footsteps of theirs and focuses on the swift and accurate translation of weather warnings, in order to better serve English- and French-speaking Canadians alike. It is part of a larger project, entitled Multi-Format Environmental Information Dissemination,Footnote 1 led in partnership with Environment Canada and Mprime.Footnote 2 This project is devoted to exploring new ways of customizing and translating the mass of daily information produced by Environment Canada. This information in digital format is ultimately transformed into weather and environmental forecasts, warnings and alerts that must be broadcast in real time in at least two languages, in many different formats and in a way that takes location into account. This latter aspect is not addressed in the current work, however.
3 Answering the need for timely warning translation with machine translation
3.1 Weather warnings when severe weather threatens
Weather warnings are issued by Environment Canada when severe weather threatens, allowing its clients to protect themselves and their property. Their corresponding bulletins are broadcast in a variety of formats, including e-mails (e-weather), the Internet (http://weatheroffice.gc.ca), and radio (weatherradio). When the trajectory and strength of a potentially dangerous storm system is known with certainty, a warning is issued, explaining the presence or imminence of severe weather. This information is updated regularly so that members of the public can take the necessary precautions. The Official Languages Act of Canada requires that a warning be emitted simultaneously in both official languages (French and English). Consequently, the translation can cause a delay in the emission of warnings.
Figure 1 shows an example of a strong wind warning issued on 22 November 2011, as it appeared on Environment Canada's website. A short header identifies the affected area, followed by a discussion explaining the threat. A French version of every warning is available in the same format. That version is accessed by clicking on the ‘Français’ link in the upper left corner of the page. There are different kinds of warnings, depending on the threat reported. For instance, WU bulletins describe severe thunderstorms, WF bulletins warn about the formation of tornadoes and WW bulletins are ‘omnibus’ bulletins most often compiling warnings currently in effect.
A sample weather warning as it appeared on Environment Canada's website in November 2011.

3.2 Lifecycle of warnings
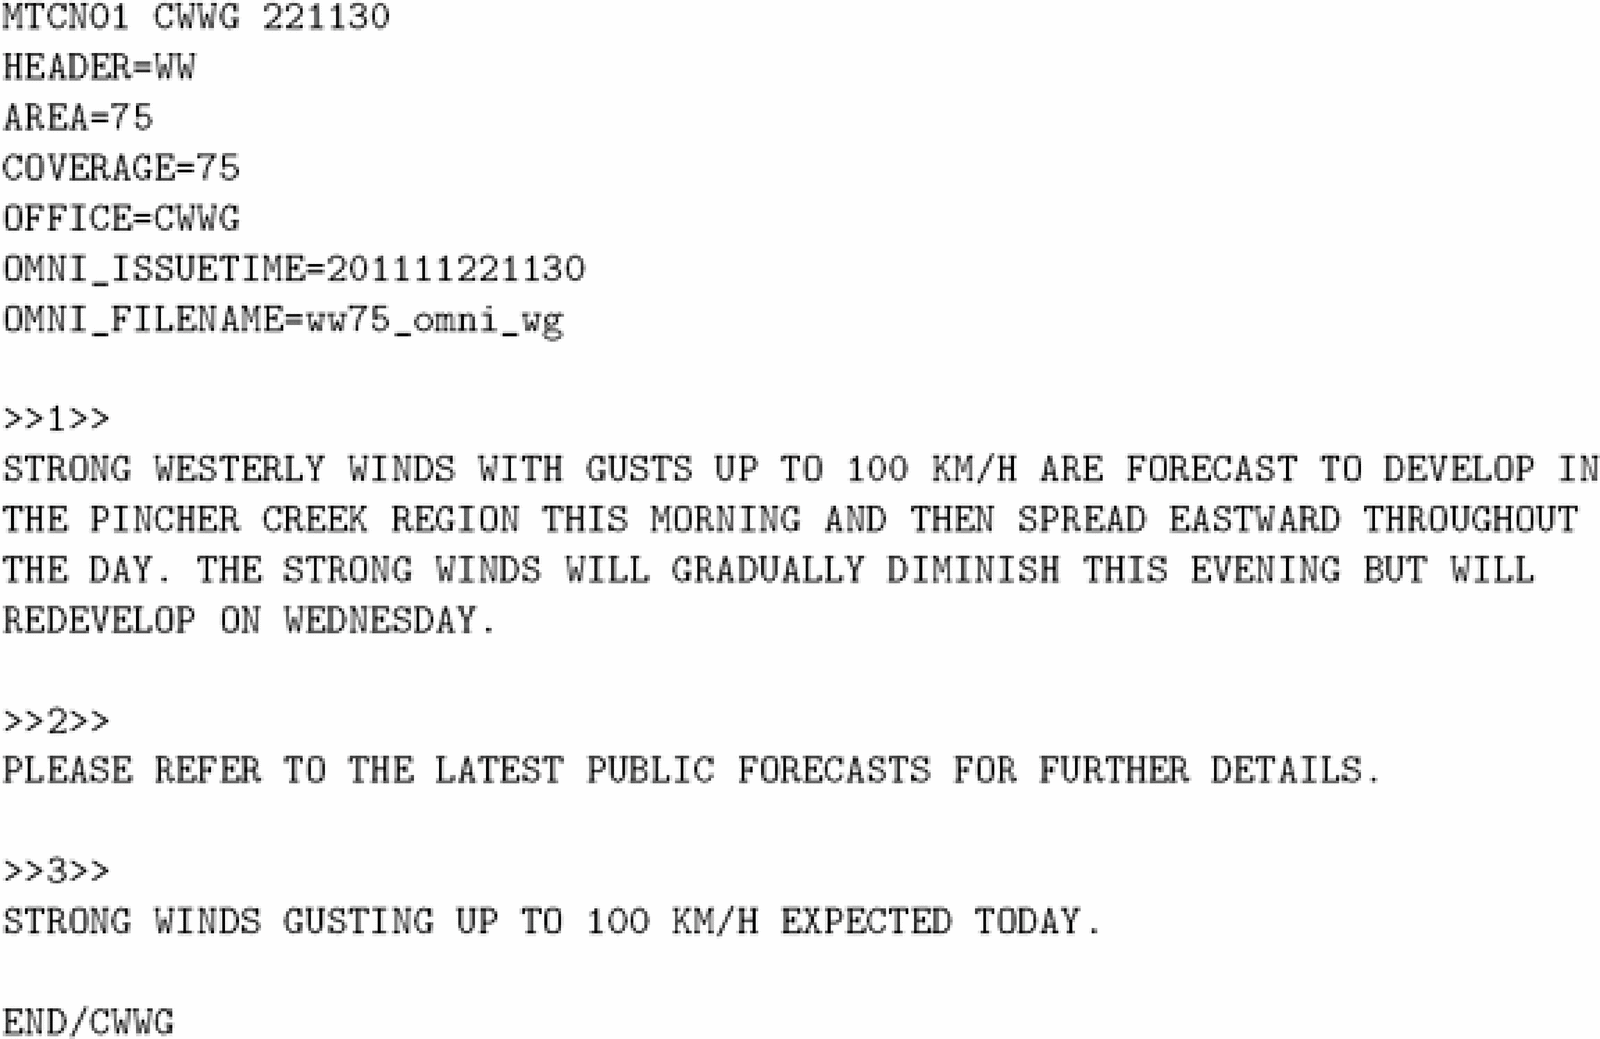
The broadcast of the warning shown in Figure 1 is in fact one of the end results of an intricate dissemination system. First, a warning is composed by a meteorologist based on the available weather data for a specific region. The warning is issued from one of the numerous emitting stations spread over Canada, and is written in English, except when it originates from the French-speaking province of Quebec. The warning is then split in two components. One part contains meta-information describing the affected area, the event identification etc., and is automatically translated using simple rules. The other part contains the text of the discussion, where the meteorologist explains the weather condition. This last file, whose format will henceforth be called MTCN, is illustrated by the example in Figure 2 for the same bulletin displayed in Figure 1. For historical and logistical reasons, the discussion is in capital letters and uses the ASCII character set, precluding the use of accented characters. Apostrophes are also often missing in MTCNs.
The MTCN bulletin corresponding to the warning seen in Figure 1.
The original MTCN is then sent to the Canadian translation bureau, where professionals produce a translation of the text. At present, they are already assisted in their work by an MT module, which we will call ECMT in this paper. They post-edit ECMT's output and return a translation in MTCN format. The average turnaround time is 3.5 minutes for a WU bulletin, and 6.5 minutes for a (usually longer) weather warning bulletin.
The two components of the bulletin are then reassembled, for each language, to form two complete bulletins: the original and the translation. Before being sent to Environment Canada's website, the case and the diacritical marks of each bulletin are restored by an automatic process. In this paper, we will employ ‘truecasing’ to mean the process of restoring case and ‘accenting’ the process of adding missing diacritical marks.
3.3 Improvements to the current system
The system currently used by Environment Canada suffers from certain shortcomings, some of which are addressed in this paper.
The delay the translation process imposes on the broadcast of warnings becomes problematic during what meteorologists call ‘short fuse convective situations', weather conditions that typically cause the emission of a large number of bulletins in a short period. The problem is threefold: (1) the volume of the discussion text increases, (2) the frequency of bulletins grows and (3) the number of high-priority translations increases as well. A translation whose priority is high may concern the imminent formation of a tornado, for instance. These problems overwhelm the translation pipeline, and result in a few bulletins without translations, or whose discussion is missing altogether. The need for swift translations is therefore particularly acute.
Another difficulty lies in the complexity of the current pipeline. Part of the problem is the fact that ECMT's output has to go through a separate case- and diacritic-restoration process further down the pipeline. This creates two distinct processing steps: one for the machine translation, and the other for truecasing and accenting, and therefore as many failure points. Furthermore, since the truecasing and accenting steps are not revised by the Translation Bureau (contrarily to the translation), typographical errors are commonly found in warnings published on Environment Canada's website. One could instead think of a single translation module whose output would be proper French or English. The translation professionals would then be post-editing not only the machine translation of the system but also the post-processing steps, ensuring a closer revision.
Finally, discussions with Environment Canada's executives suggested that the update and maintenance of ECMT is difficult in some regards, and that they would welcome a new way of incorporating feedback from meteorologists and translation professionals into the translation system.
3.4 WATT translation system
In light of these needs, the RALI started working in 2009 on an MT system specifically aimed at translating weather warning bulletins issued by Environment Canada. We call this system Watt. Its design is described in this paper. Watt is a fully automated MT component, combining a fuzzy translation memory and an SMT engine. It integrates a truecasing component for English and French and, when it outputs French text, an accenting step as well.
Watt's architecture is shown in Figure 3, along with a translation example. This paper explains in detail the system's inner workings. We outline them here from the outset.
(1) A source bulletin in MTCN format is submitted to the system. Word and sentence segmentation are performed on its discussion.
(2) A light rewriting module reformulates and corrects some elements of the input, for instance the format of dates in English.
(3) Serialization is performed, where all numbers and time expressions are folded into their respective special token, for instance __TIME__ for time expressions.
(4) A sentence-based translation memory made of past translations is queried with the source text. If it is found, the corresponding translation is retrieved; otherwise, an SMT system produces a translation.
(5) If the output text is in French, its diacritics are restored.
(6) For all bulletins, deserialization converts the specialized serialized tokens to their corresponding target language version.
(7) The case of mixed cased words is restored.
(8) Watt applies a few cosmetic rules to the output text, e.g. the restoration of apostrophes in French text.
In the end, a bulletin in ‘proper’ English or French is produced, conforming to the text format typically seen on Environment Canada's public warning website. If the client needs a file in MTCN format however, it can be trivially derived from Watt's result.
Watt's architecture, with a translation example from English to French, adapted from the example in Figure 2. Changes between each step are highlighted in the example boxes.
Watt's design started in 2009 within the Multi-Format Environmental Information Dissemination project outlined earlier. Preliminary discussions with Environment Canada allowed RALI to identify the needs of the government and to propose the principles of the solution presented in this paper. Afterward, we started gathering and preparing the corpora, which would be necessary to build Watt's first prototype. This conceptually simple task proved exceedingly complex and required 80 percent of man hours devoted to the project. The reasons for this are explained in the following section. Suffice it to say that putting together enough textual material for our needs proved challenging because of cryptic file formats and the state of some of the warning archives we had to work with. We then trained a few variants of an SMT engine with this data, and populated a sentence-based translation memory. Five prototypes were successively submitted to our client and two of those were formally tested to validate our design and their performance.
4 Data preparation
As we mentioned in the previous section, data preparation was both critical and challenging in this study. These data are used when training the SMT engine and for populating a sentence-based translation memory. The latter is an alternative to the MT engine when a source sentence has already been encountered and translated by humans. Naturally, when employing corpus-based approaches like here, gathering as much data as possible is important. In our case, we were interested in creating a bitext, i.e. an aligned corpus of corresponding sentences in French and English.
Two types of Canadian meteorological texts were made available to us by Environment Canada: weather forecasts and weather warnings.
Weather forecasts predicting meteorological conditions for a given region of Canada are written in a telegraphic style, consisting in highly repetitive turns of phrase. An example of such a forecast taken from Langlais et al. (Reference Langlais, Gandrabur, Leplus and Lapalme2005) is shown in Figure 4. Weather warnings are written in a ‘looser’ style.
An example of an English weather forecast and its French translation.
As we want to translate the discussion part of these warnings illustrated in Figure 2, our preferred raw material was MTCN files.
For both forecasts and warnings, the text is in capital letters and uses the ASCII character set, and does not include diacritics or apostrophes most of the time. The punctuation is usually very scarce, mostly limited to a full stop at the end of sentences, and sometimes to double periods (‘..’) standing either for a pause in a sentence or for a colon. Some discrepancies were found in this format (see Section 4.4.2). We observed that the content of a specific warning may often be echoed in several successive warnings, all describing the evolution of the same weather phenomenon. Moreover, some warnings summarize previous ones.
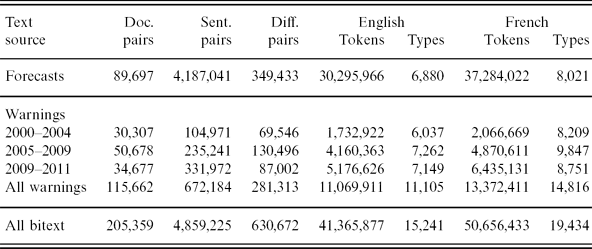
The statistics for the complete bitext are shown in Table 1. In the following sections, we describe how we have built this corpus.
Statistics for all data sources in this study. The Doc. pairs column shows the number of document pairs (forecasts or warnings) for the corresponding source of documents. See Section 4.2 (forecasts) and Section 4.3 (warnings) for a description of the corpora
4.1 Tokenization, serialization and ‘deserialization’
To create a bitext out of the material at our disposal, we wrote a sentence and word segmentation program specifically for the task, accounting for the format explained above. Particular care was taken to strip pseudo-formatting marks (e.g. horizontal rules, hard returns) from the source text, and to account for the presence of domain-specific abbreviations, urls and e-mail addresses.
We reduced the vocabulary of the texts through serialization, a form of hard clustering which folds a number of expressions into the same special token. For instance, all times in both French and English are replaced by __TIME__. We serialized times, months, days of the week and all numbers. For instance, the second sentence in Figure 4 is serialized as MONTREAL AT __TIME__ PM EST __DAY__ __NUM__ __MONTH__ __NUM__ FOR __DAY__ __NUM__ __MONTH__ __NUM__. The same serialization and tokenization process is applied to source phrases during the translation process.
Because we work with serialized text, the reverse procedure must be applied when producing a translation, i.e. the serialized tokens obtained must be replaced by the translation of their source language counterpart. For the above example if ‘MONTREAL AT __TIME__’ is translated into the French phrase ‘MONTREAL À __TIME__’, then the source text ‘4.30 PM’ for which __TIME__ stands must be translated and substituted to __TIME__ in the French version, yielding the completed translation ‘MONTREAL A 16H30’. This makes the important assumption that the count of each serialization token is the same in the source sentence and in the translation produced (but see Section 4.4.3).
When sentence alignment was not already provided in the source material, we used the Japa sentence aligner (Langlais Reference Langlais1997). If there was more than one sentence which could not find a corresponding sentence (n-0 alignment), the enclosing document pair was discarded. This proved useful in weeding out pairs of documents which were erroneously deemed a translation of one another.
4.2 Forecast text (2002–2003)
For forecast texts, we used the bitext created by Langlais et al. (Reference Langlais, Gandrabur, Leplus and Lapalme2005) that covers the years 2002 and 2003.Footnote 3 The authors' preparation of the corpus is very similar to the protocol we used here, so importing their data into our corpus was quite easy. Moreover, they chose XML as the file format, which further simplified our task. We wrote tools to make their tokenization identical to ours, and serialized the corpus.
The content of this corpus exhibits some differences from the corpus of weather warnings: its sentences are shorter and its vocabulary is simpler. Moreover, the style is more telegraphic than that of warning discussions. Nonetheless, these forecasts represent a large amount of material (87 k bulletins) due to the high frequency of their emission, so we felt their use was warranted here as preliminary tests showed their usefulness.
4.3 Weather warning text (2000–2011)
Weather warning discussions (see Figure 2) are the main interest of this study. It was therefore important to gather as many of these as possible. Thankfully, we were able to extract more than a decade's worth of text from three sources described below.
4.3.1 2000–2004: the work of Langlais et al. (Reference Langlais, Gandrabur, Leplus and Lapalme2005)
Once again, we relied on the work of our predecessors on the METEO project, by reusing the corpus they made available in the course of their study, for weather warnings. As we did for forecasts (see Section 4.2), we had to carefully retokenize the corpus to match our text preparation protocol. We imported some 30 k warnings from this study.
4.3.2 2005–2009: archives at Environment Canada
In November of 2009, Environment Canada sent to RALI an archive of all warnings issued from 2005 to November of 2009. While we were thankful to receive such valuable resources, folding them into our corpus proved very difficult because of their format. Indeed, all warnings issued during every 6-hour time span were concatenated into a single file, regardless of their language or origin. Since each warning in the archive used a very loose format resembling that of an MTCN (see Figure 2), separating the warnings from each other required the use of heuristics, patiently developed until a reasonable result was achieved. Within each isolated warning, we extracted the text under the ==DISCUSSION== header if it was present. Otherwise, the warning text was considered irretrievable automatically and ignored. Had these warnings been properly formatted (say, in XML), these costly manipulations would not have been necessary.
On top of that, we discovered to our dismay that all occurrences of the string ‘FIN’ had been replaced by ‘END’, regardless of the position where it was found, causing the presence of tokens like ‘ENDALLY’ instead of ‘FINALLY’, or ‘BAFEND BAY’ instead of ‘BAFFIN BAY’. We had to correct this manually by listing and correcting all the words containing ‘END’ which were unknown to a dictionary.
Finally, matching each warning with its translation proved trickier than we first thought. While there is indeed a unique identifier at the beginning of the warning (see first line of Figure 2), it had to be converted using ad hoc rules to find the matching warning identifier in the other language.
Out of 149 k warnings present in the archives (regardless of languages), only 110 k contained a usable discussion, 53 k in French and 57 k in English. Some 6.4 k warnings could not find the corresponding warning in the other language for various reasons. We finally obtained 51 k pairs of warning discussions, ready for alignment with Japa.
4.3.3 Since 2009: automated reception of warnings
Because gathering as many weather warnings as possible is crucial to the success of our corpus-based approaches, Environment Canada has been sending RALI warnings by e-mail as they are issued. These warnings are in MTCN format. Since June 2009, when this procedure was initiated, to November 2011, we have received 76 k MTCNs. Like the archives described in Section 4.3.2, building a bitext out of these resources was difficult.
First, about 600 warnings had a (supposedly) unique identifier that clashed with a previously issued warning with the same identifier. Manual inspection revealed that some bulletins are issued multiple times (up to four times, in rare cases) whenever a small rephrasing or formatting correction is deemed necessary by the meteorologist. Their serial numbers are the same, however. This is especially bothersome because it also means the issue time of those successive warnings is identical, an unsound practice. In any case, we ignored these duplicates and kept the first warning only. A second difficulty arose from warnings for which we could not find the corresponding translation. We found 2,000 of the latter (90 percent were written in English), possibly due to lost translations, warnings which were never translated, or simply not sent to RALI. Ultimately, these e-mails yielded 35 k bilingual pairs of warnings.
4.4 Additional hurdles when preparing the corpora
Aside from the technical problems described in the previous section, a few additional difficulties were encountered when preparing the bitext used in this study.
4.4.1 Grammatical errors
Contrary to other well-known corpora used in MT, such as the Canadian Hansards or Europarl, the warning bitext that we use contains a few more spelling, typographical and grammatical errors. We manually examined one hundred typesFootnote 4 from the English and French vocabulary and found out that 8 percent of the English types and 16 percent of the French types were misspellings. When their frequency is taken into account, they represent a negligible number of tokens (<0.05 percent). To determine the quality of the text at the sentence level, we examined 200 randomly selected English and French sentences, and determined that 0.5 percent of English sentences and 5 percent of French sentences contained at least one error. While preparing the corpus, we also found unfaithful translations, although they were extremely rare and should be considered negligible.
Therefore, it does seem that while the translations are of high quality overall, a significant proportion of sentences contain errors, a fact that should be taken into account when relying on the corpus for translating.
4.4.2 Inconsistencies in format and phrasing
There are some phrasing inconsistencies in the corpus that required manual intervention. For instance, numbers are usually written with digits, but are sometimes written using French and English numerals (e.g. ‘TEN’). In addition, negative numbers are usually prefixed with the word ‘MINUS’ but they are sometimes written with a minus sign in front. Hours presented a similar problem, where the separator between hours and minutes sometimes changed from a colon to a period for certain warnings. Units were either spelled in full (‘MILLIMETRE’) or using their corresponding symbol. Floating-point numbers were sometimes found to use the comma instead of the period to mark the fractional part.
The text format of the MTCNs also proved to be inconsistent depending on the source we use (see Section 4.3). For instance, the apostrophe may or may not appear in some words (like ‘AUJOURD'HUI’ in French or after elided words like ‘D'ORAGES’).
We attempted to normalize the text by including standardization rules in the tokenizer we wrote for this study. Multiple iterations of the code were necessary as we received more and more text over time and discovered new problems.
4.4.3 Serialization differences
When serializing the corpus using the procedure explained in Section 2, we discovered discrepancies between the serialized tokens produced by each member of a sentence pair. For instance, the phrase ‘DE LA GRELE DE LA TAILLE D UNE BALLE DE GOLF’ is associated with the English phrase ‘45 MM HAIL’. The latter will be serialized to ‘__NUM__ MM HAIL’ whereas the French version will be left untouched. This serialization disagreement becomes a problem when deserializing a translated sentence using the procedure explained in Section 4.1. We are then forced to produce a translation which cannot be deserialized because there is no corresponding source material.
We initially encountered quite a lot of these discrepancies and solved most of them by adding rules in the tokenizer. However, we did not solve all problems and 10 k sentence pairs could not be serialized and were added verbatim to the bitext to reduce out-of-vocabulary (OOV) coverage. Most of them are caused by hail sizes and sentence alignment errors. We provide further details about the problems caused by hail sizes in Section 7.1.
4.5 Bitext partition and statistics
Table 1 shows the breakdown of all the textual data we gathered into the four sources we described in Section 4.2 (forecasts) and Section 4.3 (weather warnings). The statistics are for the tokenized and serialized texts. We collected 205 k pairs of bilingual documents, corresponding to 4.9 M sentence pairs. The forecasts accounted for 83 percent of sentence pairs, but only 55 percent of the unique sentence pairs were found in the corpus, which shows their level of repetitiveness.
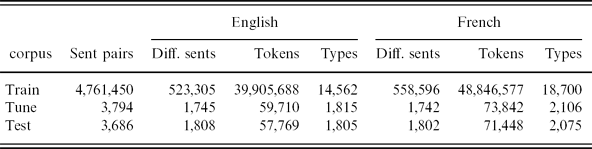
We used the bitext described in Table 1 to create three non-overlapping subcorpora: train, tune and test. The statistics for this partition are shown in Table 2. The training corpus is used to train the SMT engine; its decoding parameters are tuned with the tune corpus, and the SMT is tested on the test slice.
Main statistics for the train, tune and test subcorpora used in this study
The train, tune and test bitexts were designed to reflect as closely as possible the situation the translation engine would be confronted with, i.e. the translation of weather warning discussions. Therefore, the tune and test corpora consist exclusively of sentence pairs drawn from weather warnings. The training corpus is the only subcorpus containing text from forecasts, in addition to weather warning text.
Moreover, to avoid any overlap between, on the one hand, the training corpus, and on the other hand, the tune and test corpora, the training corpus excludes all warnings issued during the winter of 2010 and the summer/fall of 2011. From the warnings issued during these periods were drawn 400 warnings for tuning and 400 others for testing. It is noteworthy that the time periods covered by the test and tune corpora include the summer months during which most of the weather warnings are issued.
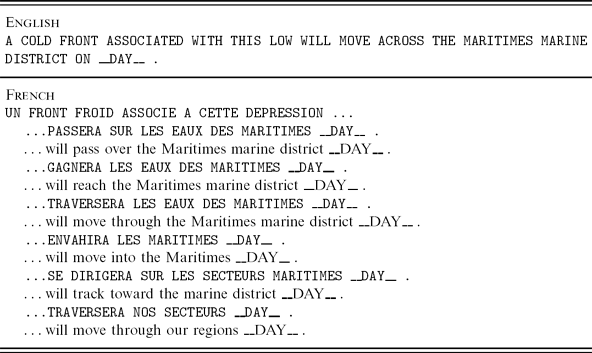
We chose to make these two corpora as ‘hard’ to translate as possible by picking warnings that contained at least one word or sentence unknown to the training corpus. We did this for two reasons. First, we wanted our test and tune corpora to reflect the appearance of new words and phrasings over time. Second, the SMT engine is destined to be augmented by a translation memory (Section 4.3), which would take care of translating previously encountered sentences. This bias that we introduced in favor of unseen words and sentences can be indirectly observed through the ratio of unique French sentences over unique English sentences in Table 2. While in the training corpus this ratio is 558,996/523,305 ≈ 1.067, it falls to approximately 1.0 for the test and tune corpora. In other words, the training corpus contains numerous English sentences for which there is more than one possible French equivalent, whereas this is significantly less important in the train and test corpora. An example of this one-to-many mapping is shown in Table 3.
Example of an English sentence associated with multiple French equivalents
The corpus's sentences are quite short: 8.4 tokens on average for English and 10.2 tokens for French. On average, a weather warning bulletin contains a discussion that is 5.8 sentences long. On average, each sentence is found for 9.1 times in the corpus, a figure that shows the highly repetitive nature of this type of text.
The vocabulary is very limited and consists for the training corpus of a mere 14.5 k types for English and 18.7 k types for the morphologically richer French version. As mentioned in Section 4.4.1, a small but non-negligible percentage of those types are typographical errors. The out-of-vocabulary tokens account for 0.2 percent of the French test corpus and 0.3 percent of the English test corpus, a very low figure.
The complete corpus, consisting of all of the forecasts and warnings at our disposal, was used to retrain the MT engine before its deployment in a production environment. This corpus (last line in Table 1) is not merely the concatenation of the train, tune and test corpora: it also includes all warnings from the winter of 2010 and the summer/fall of 2011, which were not among the 800 warnings selected for the tune and test corpora.
5 Designing an SMT module
Being in the enviable position that we had quite a lot of in-domain bilingual data, we decided to make the system as simple as possible. We thus decided to use standard tools for developing the translator and simple methods to filter out the phrase table.
We trained a phrase-based statistical translation engine for each translation direction using the Moses toolkit and decoder (Koehn et al. Reference Koehn, Hoang, Birch, Callison-Burch, Federico, Bertoldi, Cowan, Shen, Moran, Zens, Dyer, Bojar, Constantin and Herbst2007), subversion repository revision 3957. We took advantage of Moses' relatively new ‘Experiment Management System’ (EMS), which considerably simplifies the task of building, tuning and testing an SMT engine. In a nutshell, Experiment Management System prepares the data, trains the language and phrase-based translation models, tunes and tests the same. It also provides visualization tools for examining the translation produced and for debugging the processing pipeline. Moreover, it elegantly puts multicore processors to good use, a very valuable feature given the heavy computational loads needed to train statistical models.
We used the training corpus (see Section 4.5) to train the language and translation models. We built a Kneser–Ney smoothed 5-gram language model trained with the SRILM package (Stolcke Reference Stolcke2002). Decoding parameters were tweaked on the tuning corpus using the minimum error rate training (MERT) scripts provided (Och et al. Reference Och2003; Bertoldi et al. Reference Bertoldi, Haddow and Fouet2009) on the BLEU metric (Papineni et al. Reference Papineni, Roukos, Ward and Zhu2002). The test corpus provided a means to determine the BLEU score on a held-out portion of the corpus.
The maximum phrase length was set at seven words. The French to English and English to French phrase-based models have an almost identical size: both contain 7.05 M phrase pairs and both weigh in at 872 Mb. We chose to have the decoder copy unknown source words verbatim into the output.
In order to avoid serialization and deserialization problems similar to those explained in Section 4.4.3, some of the phrase pairs in the phrase-based model had to be filtered out. One filtering rule examines the agreement between the serialization tokens found in the source phrase and those found in the target phrase. A phrase pair is rejected when a target phrase contains at least one serialization token without a counterpart in the source sentence. This is often caused by a word alignment problem or rephrasing, as in the misaligned pair (‘A __NUM__ CM PAR ENDROITS’, ‘__NUM__ TO LOCALLY __NUM__ CM’). If the source phrase is a lone token, then the translation must be the same, or the pair is rejected. We also wrote rules to filter out phrase pairs like (‘DE LA GRELE DE __NUM__ CM .’, ‘__NUM__ MM HAIL .’), containing an unsafe conversion of units, a problem that would have otherwise gone undetected by the deserialization process.
5.1 Variants tested
We experimented with different parameters of the translation pipeline for both translation directions. For all the variants we always filter the phrase table first using the procedure described above. These experiments were prompted by various problems we observed in the quality of preliminary translations.
5.1.1 Reordering model
During the development of Watt, we noted that unknown words in the source resulted in quasi-gibberish in the translations often due to the seemingly haphazard way in which the target phrases were reordered around the unknown word. We therefore decided to verify how phrase reordering strategies impacted the quality of the translation, and whether their use was warranted at all. We tuned and tested three variants of the SMT's reordering model:
none Target phrases are produced in a monotone fashion, and the only possible changes in word order are within the confines of a given target phrase.
distance The model sets a cost proportional to the reordering distance, counted in phrases. The maximum ‘skip’ is set to 6.
msd An additional lexicalized reordering model is trained and used when decoding.
Three different phrase orientations are possible: monotone, swap and discontinuous, based on the previous and following phrase, and conditioned on source and target languages. Koehn et al. (Reference Koehn, Hoang, Birch, Callison-Burch, Federico, Bertoldi, Cowan, Shen, Moran, Zens, Dyer, Bojar, Constantin and Herbst2007) describe this more elaborate but nonetheless commonly used model.
5.1.2 Phrase filtering
Another apparent source of errors in translations was word misalignments, which in turn caused the presence of spurious phrase pairs in the phrase-based model used by Moses. One such phrase pair erroneously associated ‘BALAIE’ (French for ‘sweeps’) with the translation ‘CHIBOUGAMAU TOWARD LAKE ERIE WILL SWEEP’ and caused the two locations (Chibougamau and Lake Erie) to appear out of thin air in a translation. Although its associated scores are very low, the pair's target still showed up in our preliminary tests. This prompted us to attempt to sanitize the phrase-based model by filtering out all phrases for which |l src - l trg| > threshold, where l src is the number of words in the source phrase, and l trg is the number of words in the target phrase. We tried two thresholds: 4 (configuration labeled maxdelta4) and 5 (maxdelta5). More aggressive filters showed poor preliminary results. An additional configuration did no filtering (configuration labeled integral). More sophisticated filtering techniques exist (see, for instance Johnson et al. Reference Johnson, Martin, Foster and Kuhn2007) and have shown to significantly shrink the phrase-based model while leaving the translation quality unharmed, or even improved. In our case, we opt for a simpler approach, in part because our sole focus is identifying and weeding out nonsensical associations, rather than reducing the size of the translation model. However, further research is necessary to determine the impact of table pruning or smoothing (see Foster et al. Reference Foster, Kuhn and Johnson2006) on translation quality.
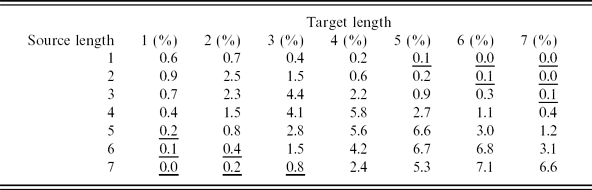
When translating from English, the integral phrase-based model contains 7.05 M pairs; configuration maxdelta5 subtracts 30 k (0.4 percent) pairs and maxdelta4, 143 k pairs (2 percent). These figures are almost identical for the other translation direction. A matrix showing the distribution of phrases based on l src and l trg is shown in Table 4, with French as the source language. Most of the pairs are concentrated along the diagonal, which is to be expected. The maxdelta configurations trim off the phrases in the upper right and lower left triangles of the matrix, which we suspect are spurious.
Phrase distribution matrix (in percentage) based on source and target length when the source language is French. The total number of phrases = 7.05 M. The underlined cells show the phrase pairs filtered out by the maxdelta4 configuration
5.2 Results for the SMT engine
Three configurations were tested for phrase reordering and three others for filtering for a total of nine different combinations of configurations. This was done for both translation directions. We greatly benefited from the multiprocessor support that the Moses toolkit offers, and were able to take full advantage of a 24-core machine. Training took 5 hours on average, and tuning needed ten MERT iterations on average, for an average time of 24 hours.
MERT tuning relies on a pseudo-random component and often finds different local minima in the parameter space for the same tuning corpus. Although the tuning scores converge for a given configuration, the test scores are different between MERT tuning results. This phenomenon is illustrated in Figure 5, showing five different tuning runs, for the configuration French-to-English, integral, msd. While tuning does converge nicely to reach an average of BLEU = 74.7 percent, the test results (legend of Figure 5) vary more significantly, with a mean BLEU score of 76.9 percent (standard deviation of 0.4 percent). Therefore, the standard deviation (in the form of an error on the measure) must be factored in when comparing configurations.
MERT tuning results for five different runs for the configuration French-to-English, integral, msd. The progression of the tune score is shown with each iteration. While the tuning converges to an average of BLEU = 74.7 percent, the BLEU test results shown in parentheses vary more significantly, average BLEU = 76.9 percent, stdev = 0.4 percent. The number of MERT iterations needed here varies between six and seventeen.
To compensate for optimizer instability when comparing experimental results, we took to heart some of the suggestions made by Clark et al. (Reference Clark, Dyer, Lavie and Smith2011) and ran each MERT optimization five times in order to obtain a mean and standard deviation on the final BLEU test results. The comparison between configurations can then be made on the basis of the BLEU score but also according to potential error represented by the standard deviation. The test results measured with BLEU are shown in Figure 6 when English is the source language and in Figure 7 for French.
Average BLEU results (n= 5) on the test corpus for nine different configurations of the Moses pipeline when translating from English. The error bars correspond to the standard deviation.
Average BLEU results (n= 5) on the test corpus for nine different configurations of the Moses pipeline when translating from French. The error bars correspond to the standard deviation.
For the English-to-French translation direction (Figure 6), the BLEU score hovers around 78.5 when not using the maxdelta4 filtering, and 75 when using it. Clearly, the latter is too heavy-handed a technique and should be discarded. That being said, a BLEU score of 78.5 is very high for an MT task. Our results are comparable to those reported by Langlais et al. (Reference Langlais, Gandrabur, Leplus and Lapalme2005) for a similar task, where they obtained a BLEU score of 77 percent when translating severe storm warnings from English to French. On a more diverse warning corpus, however, this figure dropped to 58 percent in their study.
When French is the source language (Figure 7), the BLEU score is slightly lower, which is a bit surprising given the fact that the target language, i.e. English, is morphologically poorer. The BLEU score now peaks at 77.2 percent when discarding the clearly unusable maxdelta4 configurations. This time, even when taking the error into account, all configurations are not equal. The msd-integral and msd-maxdelta5 settings improve the BLEU score by an average of 0.2 percent.
As a result, when translating from French, we will favor the msd-maxdelta5 configuration. This means that we will indeed be using a lexicalized reordering model. We prefer using the maxdelta5 configuration because the phrase model is slightly smaller as a result of the filtering phase. Moreover, it has the added merit of removing some dubious phrase associations that crept into our preliminary translations.
When translating from English, since all configurations excluding maxdelta4 perform equally well, we opt for the same configuration as the reverse translation direction, i.e. the msd-maxdelta5. Having the same configuration for both translation directions simplifies Watt's implementation without harming its performance. Table 5 shows the complete tuning and test results for this configuration. Out of the five configurations that the tuning process created using our methodology, we picked the one with the best BLEU score to produce the test results shown in Table 5. The word error rate (WER) and sentence error rate (SER) are also reported. A good translation maximizes BLEU and minimizes WER and SER scores. At around 15 percent, the WER figures are especially encouraging, although this relative success does not clearly carry over to the SER. The test BLEU scores resemble those obtained in tuning, and are quite acceptable.
Complete tuning and test results for the configuration selected, msd-maxdelta5. All measures are in percentages

It is noteworthy that for many of our experiment configurations the BLEU test score is higher than the tune score (as seen, for instance, in Table 5 when translating from English). This is unexpected, and we first thought our tune and test corpora were not of equivalent difficulty. However, after switching the test and tune corpora one for another, we observed the same tendencies.
For the sake of comparison, we submitted the same test corpus to Google Translate™. When translating from English, their engine produced a translation with WER = 43.1 percent, SER = 98.2 percent, and BLEU = 45.3 percent. When translating from French, the evaluation yields WER = 44.9 percent, SER = 99 percent and BLEU = 44.3 percent. Compared with Watt, this significantly lower translation quality is to be expected from a generic translation engine not tuned to the specificity of meteorological text.
5.3 Adding a translation memory
Given the fact that even with high BLEU scores, the SER remained quite high (see Table 5), we opted to augment the translation system with a translation memory of previous weather warnings (see Figure 3 for its place in the pipeline). Before a source sentence is submitted to the SMT, it is first looked up in the memory. If the sentence is found (memory hit), then the corresponding human-crafted text is the output. Otherwise (memory miss), the SMT is used. It is noteworthy that the memory is populated with tokenized and serialized sentences. This allows a certain degree of flexibility when matching a source sentence with the memory's content: e.g. both original sentences ‘HIGH NEAR 7.’ and ‘HIGH NEAR -10.’ match the memory's ‘HIGH NEAR __NUM__ .’.
For the purpose of this study, we populated the translation memory with all the weather warnings from 2009 to 2011 drawn from our training corpus (see Table 1). On top of these warnings, we added from the weather forecasts all the sentence pairs whose frequency was more than 5 in the complete corpus, which amounted to 30 k pairs of sentences. This minimum frequency is sensible, but admittedly arbitrary. When more than one translation exists for the same source sentence, only the most frequent is kept. The resulting memory contains 118 k unique sentence pairs. Some minor manual interventions were required to make sure that the most frequent pairs corresponded perfectly to the wording that meteorologists have been using recently so as to avoid producing valid, but ‘outdated’ sentences.
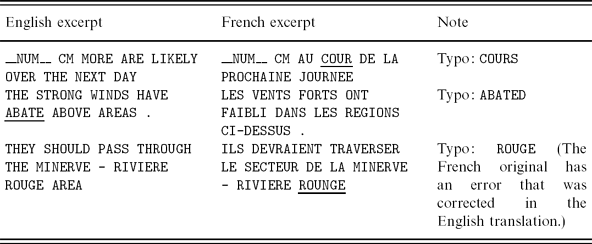
The obvious advantage of this strategy is the production of text originally written by humans, and, in our case, revised professionally. However, the memory's utility is dependent on the quality of the material it stores. We did find two sources of errors in our memory: sentence misalignments and mistakes made when the text was originally prepared. We randomly sampled one hundred sentences from the translation memory and found that 3 percent contained man-made mistakes. Sentence alignment errors were dealt with early on in the project, and none were found in this sample. The percentage of errors rises to 7 percent when considering only sentence pairs that appeared only once in the warning corpus. Table 6 shows examples of such errors, mostly minor typos. Because these singletons represent 74 percent of the memory, eliminating them would be problematic.
Examples of errors found in the translation memory. The erroneous string is underlined
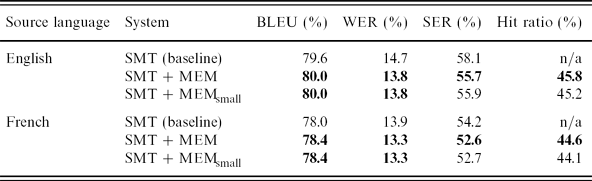
To assess the performance of the translation memory, we compared the BLEU score of the SMT engine alone (SMT), the SMT engine augmented with the translation memory (SMT + MEM) and the SMT with the translation memory stripped of sentence pairs appearing only once (SMT + MEMsmall). The complete memory contains 290 k sentence pairs and the smaller memory contains 95 k pairs. This last configuration was created to mitigate the risk of producing sentences containing typos, as mentioned above.
We used the Moses configuration recommended in Section 5.2. The test corpus is slightly different from that of Section 5.1, however. That corpus was created by gathering sentences from winter 2010 and summer/fall 2011 which were not part of the training corpus. Therefore, using it as a test corpus here would strongly bias our results against the memory, which, by definition, could not have seen these sentences. We rather chose to create a more representative corpus: We randomly drew the test sentences from winter 2010 and summer/fall 2011, but this time without systematically excluding the sentences not encountered in the training corpus. This test corpus, called here testrandom, is similar in size compared with the test corpus from Section 5.1.
The results are shown in Table 7 along with the hit ratio, i.e. the proportion of source sentences found in the translation memory, which therefore did not need to be machine-translated. The results are remarkably similar for both translation directions. The scores obtained when the SMT is augmented with a memory are 0.4 percent higher overall in BLEU, and therefore confirm our working hypothesis. There is little difference between the scores of SMT + MEM and SMT + MEMsmall, probably because the sentence pairs seen only once do not clearly contribute to the translation of a random sample of sentences. Nonetheless, the hit ratio is improved by 0.6 percent when using the full memory, and the SER benefits also. For this reason, it seems reasonable to adopt the SMT + MEM strategy.
Test BLEU scores (in percentage) obtained with the baseline (SMT) and with two variants of the translation memory for both translation directions. The best performances for each score are in boldface
The hit ratio at 45 percent on average proves the repetitiveness of the discussion sentences. It also indicates that a substantial gain in translation time is possible when relying on a memory. Based on the observation that the memory lookup time is almost instantaneous, we could expect a speedup similar to the hit ratio, which would amount to halving the translation time in our case. The overhead of loading the memory in RAM is negligible.
That being said, these results must be put into perspective. First, since both memory and test corpus contain typographical errors, it is possible that our protocol overestimates the performance of the memory. When translating, drawing from the memory may produce typographical errors that are also contained in the test corpus. Had the test corpus been manually revised to remove those errors, it would have been a more accurate evaluation tool, and the memory would have fared a little worse when evaluated.
Second, this evaluation assumes that the memory is populated only once and does not evolve over time. However, in a production environment, this would be a very unfortunate design. More realistically, the memory will receive a feedback from the end result of the translation pipeline in the form of new sentence pairs, revised by a human. Therefore, its performance when confronted with repeated occurrences of the same source sentence should improve.
5.4 Error analysis
The BLEU metric primarily used in this study to assess the translation quality is imperfect. It most notably penalizes translations that are not identical to the reference, even if the candidate conveys the same meaning. To get a clearer idea of the quality of the translations, we examined 100 translations produced by the SMT engine coupled with a translation memory. The 100 sentences were randomly selected from the corpus testrandom described in the previous section. Each translation was manually compared to the reference. We checked whether the sentence was grammatically irreproachable and also if no semantic elements were lost in translation.
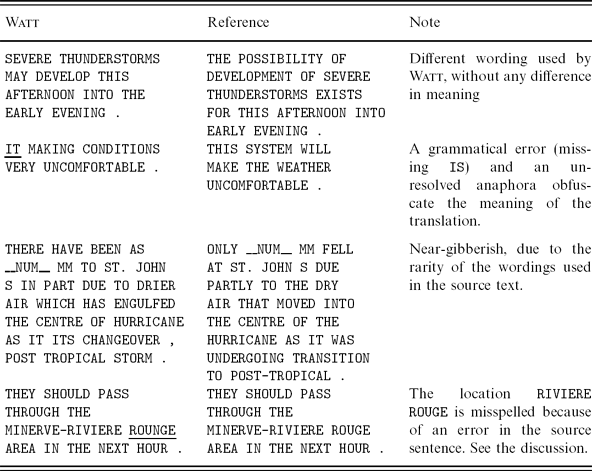
When translating from French, 8 percent of sentences had translation problems, 15 percent had grammatical issues and 16 percent had either one or the other. For English, these figures were 10 percent, 18 percent and 24 percent respectively. Most of the time, when a translation candidate was not a word-for-word match of the reference, it was because of differences in wording which did not alter the meaning of the original sentence. Table 8 shows examples of errors of varying types found when translating from French.
Examples of mismatches between Watt's output and the reference translation, illustrating different types of errors. Grammatical errors are underlined
The first example in Table 8 shows that a different wording may be produced and still conveys the same meaning as the reference. This is penalized by BLEU, but in this case we see that this is too harsh an evaluation. The other examples do show that Watt produces gibberish when confronted with very unfamiliar source sequences, which is to be expected. For instance, while the source sentence in the third example does not contain out-of-vocabulary French words, its wording is unusual. It reads ‘IL N Y A EU QUE __NUM__ MM A ST. JOHN S EN PARTIE EN RAISON DE L AIR SEC QUI S EST ENGOUFFRE DANS LE CENTRE DE L OURAGAN ALORS QU ILEFFECTUAIT SA TRANSITION EN TEMPETE POST-TROPICALE .’. The phrase ‘IL N Y A EU QUE’ (translation: a mere) is encountered only twice in the training corpus, and the words ‘ENGOUFFRE’ (translation: engulfed) and ‘EFFECTUAIT’ (translation: made) have a frequency of 2 in the training corpus.
The fourth example shows the effect of an unexpected error in the source sentence. The latter reads ‘ILS DEVRAIENT TRAVERSER LE SECTEUR DE LA MINERVE - RIVIERE ROUNGE DANS LA PROCHAINE HEURE .’, which contains an error in the location name ‘RIVIERE ROUNGE’, namely an extra ‘N’. Errors in the source confound the translation engine, and are therefore a non-negligible source of erroneous translations (see Section 4.4.1 for a description of the source material's quality).
We were very harsh during our evaluation to provide a lower bound on quality. This can prove useful when using such a subjective evaluation protocol. Further evaluations, employing more rigorous methods, are described in Section 8. At this stage, the errors we detected show no discernible recurrent pattern, and are within the bounds of the limitations expected from typical SMT output. When producing French, we did observe however some rare but systematic errors in agreement between distant words. We are still working on possible solutions.
Ultimately, with a sentence error rate of 16 percent when translating from French and 24 percent from English (at least in our random sample), the translation of a complete bulletin containing on average 5.8 sentences (Section 4.5) will contain on average about one error. This precludes the use of Watt as a fully automated translation system. Human intervention is required to post-edit the translations and make sure that the complete pipeline is up to the task.
6 Case and diacritic restoration
At this stage Watt's output is in capital letters without any diacritical marks. While this is sufficient for some of Environment Canada's products, additional processing is necessary if the text is to be published on Environment Canada's public warning website. Consequently, the final steps in the Watt pipeline involve case and diacritic restorations, which we respectively call ‘truecasing’ and (somewhat loosely) ‘accenting’ in this study. Truecasing is necessary for both languages, while accenting is only needed for French translations.
6.1 Accenting
Accenting was framed as a disambiguation problem. More precisely, given the raw stream of French tokens, our goal is to produce a stream of accented tokens according to a table, mapping each source token to one or more target tokens. When an ambiguity arises in producing a target token, a language model trained on accented text is used to eliminate the ambiguity by selecting the more probable target production. As with the translation engine, this is a corpus-driven approach, and therefore an accented text is needed to build (1) the mapping of raw tokens to accented ones, which we call disambiguation map and (2) a language model of accented text. Our two data sources are listed below.
reaccoutput on weather forecasts RALI had already developed in the past a generic accenting program called reacc (Simard and Deslauriers Reference Simard and Deslauriers2001) that we used to restore diacritics on all French weather forecasts described in Section 4.2 (see also Table 1 for statistics). reacc's output provided us with a rather large accented corpus to feed our accenting models.
MPCN weather warnings Since 2009, RALI automatically receives a copy of the most accented and truecased weather warnings produced by the current system deployed at Environment Canada. This way we were able to extract the text of 40 k French bulletins corresponding to 3.6 M words.
Both these corpora were used to create a language model using the SRILM toolkit (Stolcke Reference Stolcke2002). We were forced to clean up some systematic errors in the corpus beforehand with a set of handcrafted rules based on our observations of preliminary translations. We then created an interpolated 5-gram language model, trained using Chen and Goodman's (Reference Chen and Goodman1999) modified Kneser–Ney discounting.
The disambiguation map between raw French words and accented tokens was derived trivially from the same corpus, but was found to be lacking in terms of coverage. We therefore completed the map with a comprehensive vocabulary of French words and their flexions using an in-house resource.
The disambiguation map contains 4,139 entries. We use it with SRILM's disambig utility to perform accenting.
6.2 Truecasing
6.2.1 Principle
An example of the end result of the truecasing step is shown in Figure 1, whose text is reproduced in Figure 8 for convenience, in which the tokens with a mixed case are underlined. On the one hand, we observe that case restoration involves conceptually simple rule-based transformations, such as the capitalization of the first word of a sentence or that of a weekday or month. We readily implemented these rules. On the other hand, truecasing the numerous names of places and other named entities is trickier. It actually consists of two problems: performing named entity recognition (NER), and then properly truecasing these named entities. Named entity recognition is made difficult by the lack of case information.
An excerpt of a discussion as it appeared on Environment Canada's public weather warning website. We underlined mixed case phrases.
For these reasons, and for the sake of simplicity, we chose a gazetteer-based approach to truecasing. We started by compiling a list as exhaustive as possible of all mixed case expressions susceptible to appear in Watt's translations. We will describe this preliminary step in detail in Section 6.2.2.
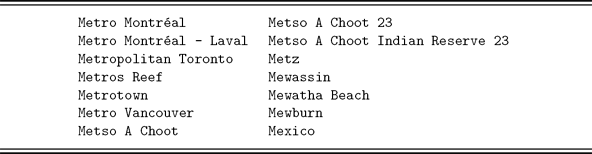
We compiled two lists, one for each output language, and made sure these lists spelled each place name with its correct case. We added to these lists other capitalized words (e.g. ‘Environment Canada’) extracted from sources described in Section 6.2.2. An excerpt of the English entries is shown in Table 9.
An excerpt of the list of mixed case expressions in English
With these lists at our disposal, it is then possible to scan the raw translations in order to find these expressions in their raw form. Whenever a match is found, the raw translation is replaced with the truecased expression. Each list is compiled into a trie to speed up the matching step. We use a greedy algorithm that scans the raw translation from left to right to find the longest matching list entry. For instance, the raw ‘AN AREA NEAR METSO A CHOOT INDIAN RESERVE 23’ will only match ‘Metso A Choot Indian Reserve 23’ entry given in Table 9, and not shorter expressions.
It is noteworthy that our lists hold entries that contain diacritical marks (e.g. ‘Metro Montréal’ in Table 9). This allows a few final additions to the accenting step of French text described earlier (see Section 6.1). As for the English text, this single step is sufficient to restore the few diacritical marks necessary and no further processing was deemed necessary.
6.2.2 Gathering mixed case expressions
To build the list of mixed case expressions typically found in weather warnings, we could not use the corpus described in Section 4.5, since it is in all capital letters. We therefore resorted to numerous alternative sources of information described below, which we mined manually. The French list contains 49 k unique entries, and the English list contains 50 k entries.
DBpedia: This database structures information extracted from Wikipedia, and allows for sophisticated queries against this data. We were able to list all Canadian cities and populated areas with a single query. Since DBpedia allows queries to be made against most of Wikipedia's supported languages, we managed to extract 853 French place names as well as 4,431 English place names.
Environment Canada's public warning website: As part of a preliminary study, we had automatically collected all public weather warnings published on Environment Canada's website (an example is shown in Figure 1) in 2008. These bulletins are truecased and accented, so it was a simple matter to extract all mixed case expressions in those. We collected roughly 1,500 expressions for both languages. This source was important in ensuring that we did not limit our collection of mixed case expressions to place names: other named entities (e.g. ‘Environment Canada’ or ‘Celsius’) require truecasing.
GeoBaseFootnote 5: This is a Canada-wide governmental project intended to provide free, high-quality geospatial data. We found 16 k place names in both official languages.
MeteocodeFootnote 6: This is an XML format utilized to hold weather information elements forecasted by Environment Canada and readily available to the public on their data servers. While we did not use the information held in these files, the format's documentation included an official list of the region names concerned with these forecasts. We collected 543 official place names from this source.
Marine region names: Because weather warnings sometimes contain references to bodies of water or streams, we manually collected from Environment Canada's marine warning websiteFootnote 7 a list of these named entities. We found 400 expressions in French and English.
Manual additions: We manually added names of important places in the United States, taking care to populate the French list with official translations (e.g. ‘Géorgie’ instead of ‘Georgia’). We added a few expressions specific to the weather jargon and apparently not found elsewhere, for instance the identifying codes for broadcasting stations (‘CWTO’ for Toronto etc.). Finally, we added mixed case expressions gathered from the MPCN corpus of weather warnings (see Section 6.1) originally built for accenting purposes.
6.2.3 Difficulties
Some difficulties were encountered when implementing the algorithm explained in Section 6.2.1 with the data described in the previous section.
Typographical errors and misspellings were detected in the mixed case expressions extracted from Environment Canada's website (e.g. ‘*Aglomération’ instead of ‘Agglomération’). Further analysis revealed that Environment Canada's current system for truecasing and accenting introduced very infrequent errors, which unfortunately all appeared in our lists. We did not want to discard the whole data source, so we kept these erroneous entries. After all, we only risk seeing misspelled words correctly recased. Moreover, we explain below how we filter some potentially spurious entries.
We also found ambiguous entries. For instance, there are two entries to recase the word ‘MATAPEDIA’, either ‘*Matapedia’ or ‘Matapédia’. The first one is erroneous; the second one should be selected. When confronted with such a choice, the algorithm selects the word containing the most capitalized and accented characters. We deemed this heuristic satisfactory, as most erroneous entries lack rather than have case and diacritic information.
When truecasing, there are instances where it is unclear if we are dealing with a common noun or a named entity. Examples of these difficult cases include ‘HIGH LEVEL’, which could either be a common expression in weather vernacular or the small Albertan town of High Level. To avoid these problems, we manually inspected all mixed case expressions consisting of only common nouns, and removed those which could cause confusions. It is an imperfect solution, since this precludes the case restoration of named entities like High Level. Thus, 319 English entries were removed, and 405 in French.
These difficulties highlight the fact that our truecasing technique could benefit from a named entity recognition module. However, it is unclear at this point how this module would fare when confronted with the peculiar style of weather warning discussions, especially considering the wealth of complex entities it would have to detect with very little case information. Further research is therefore necessary to clarify this.
7 Putting the pipeline together
7.1 A few preprocessing and post-processing touches
A small number of ad hoc rules were necessary to finalize Watt's pipeline because these rules were not easily captured by the statistical models in place. More than fifty rewriting rules were created to rephrase input sentences in some cases, and were derived when examining Watt's output for errors. Among these rewriting rules are expansions of province abbreviations (‘P.E.I.’ → ‘PRINCE EDWARD ISLAND’) and normalization of dates (‘JAN 1ST’ → ‘1 JANUARY’).
Some of these rewriting rules concern hail sizes. Hail sizes are often described using similes, e.g. ‘QUARTER SIZED HAIL’ for hail whose diameter is 24 millimeters (1 inch). Traditional hail size description charts exist, as documented for instance by the American National Oceanic and Atmospheric Administration (NOAA).Footnote 8 We chose to convert these (French and English) similes to millimeters. This simplification of the input sentences allows for the subsequent serialization process to kick in and convert hail sizes to the corresponding ‘__NUM__’ special tokens. Once converted, these sentences are more likely to be found in the translation memory or, failing that, to be faithfully translated and deserialized. This rewriting has the added benefit of removing some awkward similes that Environment Canada itself has recently been trying to avoid in the warnings to make the text more accessible. Creating these conversion rules is an ongoing process.
At the other end of the pipeline, after deserialization and truecasing (see Figure 3), a few beautification rules are applied to the translations. These include most notably the restoration of apostrophes (e.g. French ‘l arrivée’ becomes ‘l'arrivée’ – ‘the onset’), but also some fixes, such as the introduction of dashes in some places.
The end result is a bulletin in ‘proper’ English or French, ready to be revised before publication on any of Environment Canada's media outlet, including its website.
7.2 Technical details
Watt's complete pipeline is shown in Figure 3. All the modules described in the previous sections are called into action from a single Python program, which makes sure that all the different technologies involved work together. They include C++ programs (like the Moses decoder and SRILM utilities) and a few shell scripts. The complete code base of the project, including the Python modules written to prepare our training corpora and the translation script mentioned earlier, weighs in at 10,000 lines of code.
Watt runs on a 64-bit architecture machine using Linux, and requires relatively few resources: 2 Gb of RAM and 20 Gb of disk space to store the different statistical models involved. On a 3-GHz core, translating a single sentence takes 4.5 seconds on average, with Moses' translation accounting for a third of the translation time, on average. Starting the translation server involves loading in RAM the various statistical models and tools, and takes 10 seconds on average. Its design is relatively simple, and allows for simple maintenance and updates. Most of the resource files are in plain text, and can be modified readily. The statistical models however require retraining should the need arise to update them significantly.
We implemented Watt as two translation servers, one for each source language. Each server uses a simple ad hoc communication protocol. This proved very useful in providing a centralized system, capable of translating requests originating from multiple points. Translations can be sent to Watt from a demonstration websiteFootnote 9 as well as from a command-line tool (for batch processing). Moreover, the latest prototype available at any time has been translating actual weather warnings in a staging environment, which is almost identical to the one currently used by Environment Canada. Studying the translation logs from these sources was instrumental in fine-tuning the numerous heuristics and rules embedded into Watt, and in adapting them to the evolving turns of phrase and vocabularies employed by meteorologists.
8 Evaluations
In order to properly assess an MT system's performance, one cannot rely exclusively on automatic metrics such as BLEU, especially when the result is to be published by the Government of Canada for every Canadian to read, and when errors can have dire consequences. To remedy this, no less than four human evaluations were performed on WATT at different stages.
The Translation Bureau at the request of Environment Canada carried out the first evaluation in the summer of 2010. A total of 135 weather warnings were then written for the occasion by meteorologists at Environment Canada, translated by a previous version of WATT and reviewed by translators from the Translation Bureau. The study bluntly concluded that two-thirds of the warnings produced definitely required human revision before publication. As the details of this evaluation were not communicated to the authors, it was difficult to use these findings to help improve the system.
We thus performed the second evaluation at the University, this time implementing a more state-of-the-art methodology, a sore point in the first study. This time, a blind evaluation was performed by five human annotators (raters) who were asked to annotate source language sentences, as well as their respective human and machine translations, for thirty-two weather warnings (101 sentences) randomly selected from those issued during the summer of 2010. We used a clear ontology of errors, with distinct classes for meaning, form and typography. We showed that 66 percent of bulletins produced by WATT contain at least one fidelity flaw in their translation, compared to 25 percent for human translations. The human performance put WATT's in perspective. We also observed that 25 percent of source sentences (inputs) contain at least one error and that this affected the quality of their translations (machine or human). The study further identified some shortcomings in WATT, which led to direct improvement in the following months.
During the winter of 2011, a third evaluation was carried out by the Translation Bureau. The focus was the comparison of Environment Canada's current translation system (which we call ECMT here) with WATT in an experimental setting as close as possible to Environment Canada's current use of machine translation in its pipeline (see Section 3). For this purpose, the raw output (in upper case and lacking diacritics) generated by each system was submitted for revision to human translators from the Translation Bureau, and the number of changes they made was tracked.
A representative test corpus was created, comprising 122 actual weather warnings emanating from different weather offices and covering all seasons. One hundred of those bulletins were in English, twenty-two in French, totaling 10,376 words. To prevent an MT system under evaluation from simply querying and finding a translation in its translation memory, Environment Canada's staff slightly altered the source bulletins, changing an ‘EAST’ for a ‘WEST’, for instance. These test warnings were then translated by each MT system. WATT took 15 minutes for this task; ECMT could not be timed. In order to have a blind evaluation, the appearance of each system's output was made undistinguishable from the other's.
The Translation Bureau's eight translators participating in this study were divided into four pairs. Each member of a given pair received the same MS Word document, containing a random subset of test warnings, and was instructed to revise them independently. The methodology ensured that each bulletin was reviewed twice by two different translators. The Word documents also contained the source bulletins as is usually the case at the Bureau. After revision, the evaluator calculated the number of modifications made by each reviewer and we computed the average number of changes made to the translation output per bulletin. On average, reviewers working on ECMT's translations made 9.5 changes per bulletin. For WATT, this figure falls to 4.6 interventions per bulletin on average. This seems to indicate that WATT's output is of higher quality. If we accept the likely premise that the number of changes is positively highly correlated with the revision time, WATT could reduce the overall turnaround time in Environment Canada's translation pipeline.
The revisions made to WATT's translations included both obvious error corrections as well as subtler style changes, for instance the replacement of ‘A CLOUD WAS OBSERVED’ with ‘A CLOUD WAS SIGHTED’. Incidentally, this last revision was made by only one of the two translators in the group where the translation was revised. Other inconsistent revisions led us to verify inter-annotator agreement by manually examining each intervention made in the test corpus and verifying if the other translator in the same group was of the same opinion.
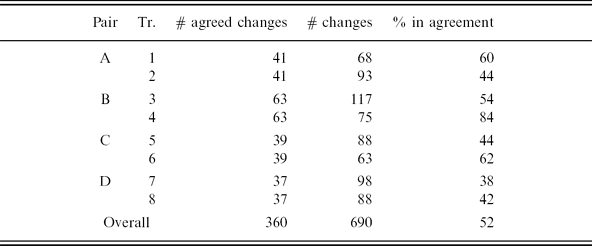
The results, given in Table 10, show that within the same pair where both translators have reviewed the same documents, the number of interventions can vary significantly (e.g. 75 versus 117 changes for pair B). On average (last row of the table), only 52 percent of revisions are agreed upon by both translators, which we feel reflects both the subjectivity of the task as well as a certain inconsistency in applying some revision rules. At any rate, one could argue that the aforementioned figure of 4.6 interventions per bulletin translated by WATT could overestimate the effort needed to bring WATT's output up to publishing standards, since these changes are only agreed upon half of the time.
Inter-translator agreement on changes (revisions) made on WATT's output. ‘Tr.’ denotes a translator within a pair, ‘# agreed changes’ is the number of changes for which both translators within the same pair agree. ‘# changes’ is the number of changes for this particular translator
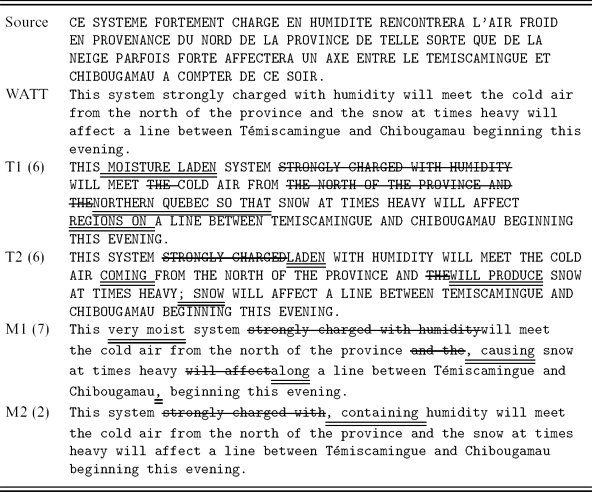
Two seasoned meteorologists at Environment Canada performed thefourth evaluation in early 2012. We submitted to them the source text of 122 bulletins used in the previous evaluation, along with their translations produced by WATT for this evaluation, but this time after the restoration of the case, the diacritics and the typographical marks. Once again using MS Word documents, they revised the translations, and we counted their interventions and computed the average number of interventions required per bulletin on average. For the first meteorologist (M1), this figure was 7.1 modifications per bulletin and for the second one (M2), this figure was 5.0. This is higher than the ratio mentioned for the previous evaluation, which is to be expected because the meteorologists this time had to review the translations as well as the accenting, case- and typography-restoring processes. A cursory examination of the revision marks shows that they tend to have their own bias regarding the expected quality of the translations, distinct from the one we perceived from the results of the third evaluation performed by translation professionals.
Along with their revisions, the meteorologists made numerous remarks concerning the quality of the source material, which they found ‘troubling’. The meteorologist M2 highlighted 106 passages she considered unsatisfactory in the source warnings, accounting for 8.8 percent of the 12,491 source words. The comments gathered from the reviewers confirmed our findings regarding the relatively high frequency of spelling and grammatical mistakes in the source material (see Section 4.4.1). Moreover, in the meteorologists' opinion, the source sentences are sometimes difficult to follow, too complex, their vocabulary overly scientific (e.g. ‘DRYLINE’) or too creative (e.g. ‘EXCITING STORM’ or ‘MONSTER STORM’). They consider that these flaws render the warnings more difficult to understand for a human, and more complex to translate for WATT.
Once again, we noticed that the reviewers did not agree most of the time on the changes necessary to bring WATT's translations up to publishing standards. Calculating an inter-annotator agreement proved too time-consuming to be performed in this case. However, the example given in Table 11 does illustrate the diversity of revision possibilities that a single sentence can offer. This example shows a sample source sentence, in French, its translation by WATT and four different human revisions of WATT's output. T1 and T2 designate two translators from the third evaluation presented earlier, and M1 and M2 refer to the two meteorologists who volunteered for this fourth evaluation. Obviously, for some sentences at least, there is a wide variety of possible revision sets. Therefore, establishing a time-efficient protocol to determine inter-annotator agreement (or to determine a consensual translation for that matter) is very challenging.
A source sentence, WATT's translation and four different revision sets, by four different reviewers. The number of changes made appears in parentheses after the reviewer's identifier. Insertions are indicated by a double underline and the deletions by struck-out text
9 Conclusions
In this study, we described as comprehensively as possible the creation of an MT tool to help in the translation of Canadian weather warnings. The results are very encouraging according to both our test results and the feedback we received from Environment Canada and the latest human evaluations. While the raw translations produced by Watt typically require a human revision, our results show that this post-edition effort is lighter than the one currently needed.
Many conclusions can be drawn from this enterprise, but one that stands out from the rest is that the proper preparation of corpora is both very time-consuming and critical to the quality of the end result. It is sometimes unclear from the scientific literature how much effort has to be invested in these steps, and we would like to emphasize this point here. We spent 80 percent of the man hours devoted to this project meticulously extracting text from various, often scarcely documented, file formats and making sure that the tokenization and normalization of this text were executed correctly. When creating bitexts, sentence alignment proved difficult. Moreover, typographical and grammatical errors in the source text further complicated the matter. This corpus preparation effort also included creating diverse resources, ranging from hail size charts (Section 7.1) to place names (Section 6.2.2), always in both official languages. More often than not, failing to carry out these steps appropriately translated into poor results.
That being said, we believe corpus preparation could be made simpler for any organization willing to acquire an SMT engine, or any corpus-driven Natural Language Processing technology for that matter. A few straightforward recommendations could be applied. First, documents circulating between computer systems should conform to a structured format, preferably one that is both human- and machine-readable. This format should be well documented and its use by all software processing the documents should be a requirement. XML-based formats could be interesting candidates for such a policy, and did prove extremely useful when parsing some of the resources used in this study.
Second, all efforts should be made to gather as much data as possible in order to create a technology such as the one we described here. Most notably, this means an archive of relevant documents should be maintained and statistics on these archives should be available. This is a problem we repeatedly encountered here when we attempted to collect historical translations.
When using example-based, statistical or other corpus-based approaches, widespread errors or numerous mistranslations in the train data risk creeping up in the machine translation. Investing a reasonable amount of effort in sanitizing this data can be very beneficial, but it is always much easier if these mistakes are avoided in the first place, when the text is written. In our case, we observed typographical errors in the source and target texts, which diminished the quality of the machine output. These typos are always expected in such a great quantity of text, but we feel that some of them could have been avoided. For instance, a spellchecker could have been used when creating the original bulletin, or when the translation was produced. However, this could prove tricky in some cases because these discussions contain many place names and terms belonging to the meteorological jargon. The various word lists, vocabularies and gazetteers that we have compiled in this study could help overcome this problem. Another potentially interesting tool to raise the quality of the bilingual warning corpus at the source could be a computer-aided bulletin creation tool, meant to help the meteorologist. Such a system would filter out misspelled or unknown words, standardize the notation and the vocabulary and would ultimately ameliorate the source text and its translations.
Evaluations both automatic and manual are also essential to provide not only the necessary tuning parameters for the translation engine but also to get new insight into the overall performance. Humans are easily badly influenced by seemingly simple errors in formatting or spelling. We thus feel that a good mix of linguistics, patience and engineering is essential for the development of a successful MT system.
Acknowledgments
We would like to thank Michel Jean, Gaétan Deaudelin and Jennifer Milton from Environment Canada for being so supportive of our machine translation efforts over the years. We also want to thank Elliott Macklovitch who managed the third evaluation at the Translation Bureau of Canada, and many other evaluators who annotated translations at various stages in our development. We would like to thank the reviewers for their thoughtful comments. This work was supported in part by a contribution from Environment Canada and by a matching grant from Mitacs/Mprime.