1 Introduction
Text summarization is a good way to condense a large amount of information into a concise form by selecting the most important and discarding the redundant information. According to (Mani Reference Mani2001), automatic text summarization takes a partially structured source text from multiple texts written about the same topic, extracts information content from it, and presents the most important content to the user in a manner sensitive to the user's needs. In contrast to summarizing one document that is termed as single document summarization, multi-document summarization deals with multiple documents as sources that are related to one main topic under consideration. A multi-document summary can be used to concisely describe the information contained in a cluster of documents and to facilitate the users to understand the document cluster (Wan, Yang and Xiao Reference Wan, Yang and Xiao2007). Although the major challenges of multi-document summarization such as completeness, readability, and conciseness are yet to be fulfilled, some web-based systems are already utilizing the potential of this technology. For example, Google NewsFootnote 1 and the NewsblasterFootnote 2 system automatically collect, cluster, categorize, and summarize news from several sites on the web, and help users find the news of their greatest interest. As compared to generic summarization that must contain the core information central to the source documents, the main goal of query-focused multi-document summarization is to create from the documents a summary that can answer the need for information expressed in the topic or explain the topic (Wan et al. Reference Wan, Yang and Xiao2007). Query-focused multi-document summarization can be useful to exhibit the practicability in document management and search systems. For example, it can provide personalized news services for different users according to the users' unique information need (Wan and Xiao Reference Wan and Xiao2009). Moreover, we can obtain the news about a single event from different sources in order to create a summary that provides multiple perspectives at the same time. In this paper, we consider the problem of producing extraction-based,Footnote 3 query-focused multi-document summaries given a collection of documents.
Supervised extractive summarization can often be regarded as a two-class classification problem that treats summary sentences as positive samples and non-summary sentences as negative samples. Given the features of a sentence, a machine-learning-based classification model can judge how likely the sentence is important to be in the summary (Wong, Wu and Li Reference Wong, Wu and Li2008). For supervised learning techniques, a huge amount of annotated or labeled data is required as a precondition. The decision as to whether a sentence is important enough to be annotated can be made either by humans or by programs. When humans are employed in the process, producing such a large labeled corpora becomes time-consuming and expensive. There comes the necessity of using automatic methods to align sentences with the intention to build extracts from abstracts.
The Document Understanding Conference (DUCFootnote 4) series is run by the National Institute of Standards and Technology (NIST) to further progress in summarization and enable researchers to participate in large-scale experiments. The recent DUCs held in 2005, 2006, and 2007 have focused on a form of query-focused multi-document summarization problem and hence, tasked their systems requiring participants to provide summaries from multiple documents as answers to complex questions. In this paper, we consider the DUC-2007 main task to run our experiments. The problem definition at DUC-2007 was as follows: Given a complex question (topic description) and a collection of relevant documents, the task is to synthesize a fluent, well-organized 250-word summary of the documents that answers the question(s) in the topic.
For example, given the topic description (from DUC-2007)

and a collection of relevant documents, the task of a summarizer is to build a summary that answers the question(s) in the topic description. We consider this task and apply different supervised approaches to generate topic-oriented 250-word extract summaries.
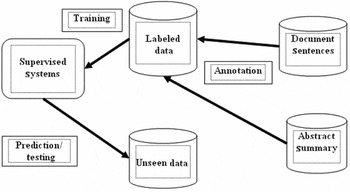
The block diagram in Figure 1 depicts the basic architecture of our work. Our query-focused multi-document summarization systems in a supervised setting subsume three major phases: annotation/labeling, training, and testing. Given the original document sentences and their abstract summary, we produce the labeled data set through annotation. This phase includes the application of different textual similarity measurement techniques that compare the abstract summary sentences with the document sentences. The most similar sentences are labeled as positive (summary) and the less similar ones as negative (non-summary). In the second phase, supervised systems are trained with a large amount of labeled data. Finally, an unseen data set is presented before the learned model that predicts the labels in order to produce system-generated extract summaries. The following is a summary of core findings and contributions of our work:
(1) We reimplement the following five different text similarity measurement techniques: ROUGE (Recall-Oriented Understudy for Gisting Evaluation) similarity measure (Lin Reference Lin2004), Basic Element (BE) overlap (Hovy et al. Reference Hovy, Lin, Zhou and Fukumoto2006), syntactic similarity measure (Moschitti and Basili Reference Moschitti and Basili2006), semantic similarity measure (Moschitti et al. Reference Moschitti, Quarteroni, Basili and Manandhar2007), and Extended String Subsequence Kernel (ESSK) (Hirao et al. Reference Hirao, Suzuki, Isozaki and Maeda2003) and apply them to solve the automatic annotation problem. In this manner, we generate five different versions of labeled data that are used to train the supervised systems. Applying text similarity measurement techniques to perform automatic annotation is unique in a sense that no other study before has accomplished it similar to our settings.
(2) We build our query-focused multi-document summarization systems applying the following four different supervised machine learning techniques: Support Vector Machines (SVMs), Hidden Markov Models (HMMs), Conditional Random Fields (CRFs), and Maximum Entropy (MaxEnt).
(3) We conduct an extensive experimental analysis to show the impact of five automatic annotation methods on the performance of the above-mentioned four chosen supervised machine learning techniques (Chali, Hasan and Joty Reference Chali, Hasan and Joty2009a). To the best of our knowledge, no other study has deeply investigated and compared the effects of using different automatic annotation techniques on different supervised learning approaches in the domain of query-focused multi-document summarization. We evaluate our systems automatically using ROUGE and report the significance of our results through 95% confidence intervals. Experimental results show that Sem annotation is the best for SVM whereas ESSK works well for HMM, CRF, and MaxEnt systems. We also present manual evaluation results to compare our systems meaningfully.
(4) We also assess system performance by feeding balanced and unbalanced data during the learning phase. From this experiment we infer that systems trained with an unbalanced data set, where positive samples are less in proportion, often outperforms the systems that are trained with a balanced data set.
(5) We experiment with two supervised ensemble-based approaches that combine individual decisions of the classifiers. The homogeneous ensemble is made of four different SVM classifiers (Chali, Hasan and Joty Reference Chali, Joty and Hasan2009), whereas the heterogeneous ensemble combines the decisions of the four classifiers: SVM, CRF, HMM, and MaxEnt. Our experiments show that both homogeneous and heterogeneous ensembles perform better than their single counterpart.
Supervised approach.

In this research, from extensive experiments on the DUC data sets, we learned that the difference in choice of automatic annotation techniques certainly affects the performance of the supervised techniques in consideration. Further observations from different experiments and evaluations reasonably illustrates that ESSK method of labeling data suits the best for most of the supervised systems. From the ensemble experiments run in this research, we can conclude that ensemble methods are pretty much suitable for the query-focused multi-document summarization domain. We also assessed the system performances by feeding balanced and unbalanced data during the learning phase. Given the balanced or unbalanced data during the learning phase, we inferred that the systems trained with an unbalanced data set, where positive samples are less in proportion, often outperform the systems that are trained with a balanced data set. We compared our summarization systems with a baseline system and the average ROUGE scores of all the participating systems of DUC-2006 and DUC-2007. We found that all the supervised systems significantly outperform the baseline system besides considerably beating the average DUC-2006 ROUGE scores (except CRF not beating the ROUGE-2 score). On the other hand, MaxEnt outperformed the ROUGE-1 score of average DUC-2007 systems while all other supervised systems perform closely. All these experiments denote the considerable effectiveness and potential significance of our supervised systems in the query-focused multi-document summarization domain.
The rest of the paper is organized as follows: Section 2 focuses on the related work, Section 3 gives a brief description of the automatic annotation techniques, Section 4 presents experimental details, Section 5 shows results and analysis, and finally, we conclude the paper and discuss some future directions.
2 Related work
Researchers all over the world working on multi-document summarization are trying different directions to see methods that provide the best results. Up to now, various extraction-based techniques have been proposed for generic multi-document summarization. In recent years, researchers become more interested in query-focused (i.e. topic-biased) summarization and hence, different methods have been proposed ranging from heuristic extensions of generic summarization schemesFootnote 5 (by incorporating query-related information) to novel ones. For instance, Nastase (Reference Nastase2008) expands the query by using encyclopedic knowledge in Wikipedia and use the topic-expanded words with activated nodes in the graph to produce an extractive summary. Daume and Marcu (Reference Daumé and Marcu2006) have presented BAYESUM (‘Bayesian summarization’), a sentence extraction model for query-focused summarization. On the other hand, Wan et al. (Reference Wan, Yang and Xiao2007) have proposed a manifold-ranking method to make uniform use of sentence-to-sentence and sentence-to-topic relationships whereas the use of multi-modality manifold-ranking algorithm is shown by Wan and Xiao (Reference Wan and Xiao2009). Other than these, topic-focused multi-document summarization using an approximate oracle score has been proposed by Conroy, Schlesinger and O'Leary (Reference Conroy, Schlesinger and O'Leary2006) based on the probability distribution of unigrams in human summaries. In our query-focused summarization approach, we represent each sentence of a document as a vector of feature-values. We incorporate query-related information into our model by measuring the similarity between each sentence and the user-given query according to Edmundson (Reference Edmundson1969), Sekine and Nobata (Reference Sekine and Nobata2001), and Chali, Joty and Hasan (Reference Chali, Joty and Hasan2009). We use a number of features considering n-gram overlap, Longest Common Subsequence (LCS), Weighted Longest Common Subsequence (WLCS), skip-bigram, exact-word, synonym, hypernym/hyponym, gloss and BE overlap, and syntactic information (details are provided in Section 5).
Supervised machine learning techniques have been applied differently in text summarization domain extensively so far. For example, HMMs have been successfully applied by Conroy and O'Leary (Reference Conroy and O'Leary2001) by denoting two kinds of states, where one kind corresponds to the summary states and the other corresponds to the non-summary states. Ferrier (Reference Ferrier2001) applied the MaxEnt technique to text summarization and found that the maximum entropy classifier produces better results than the naive Bayes technique. Shen et al. (Reference Shen, Sun, Li, Yang and Chen2007) showed the effectiveness of CRFs by applying it to a generic single-document extraction task. On the other hand, single document summarization systems using SVMs demonstrated good performance for both Japanese (Hirao et al. Reference Hirao, Isozaki, Maeda and Matsumoto2002a) and English documents (Hirao et al. Reference Hirao, Sasaki, Isozaki and Maeda2002b). Hirao et al. (Reference Hirao, Suzuki, Isozaki and Maeda2003) showed effectiveness of their multiple document summarization system employing SVMs for sentence extraction. Besides using any supervised classifier individually, at present, one of the most active research areas include methods for constructing good ensemble of classifiers (Qi and Huang Reference Qi and Huang2007). For instance, Nguyen et al. (Reference Nguyen, Shimazu, Phan, Ho and Horiguchi2005) used a boosting-based support vector ensemble to achieve good performance in summarizing text from a Vietnamese corpus. Inspired by the historical evidence of the effectiveness of supervised methods in different summarization settings, in this paper, we formulate the query-focused multi-document summarization task in terms of four different supervised machine learning techniques, viz., SVMs, HMMs, CRFs, and MaxEnt, and two ensemble-based approaches.
Annotated data, a prerequisite for supervised systems, has been used differently over the years. In 1969, for producing an annotated corpus, Edmundson (Reference Edmundson1969) asked humans to identify the important sentences in each text from a collection of 200 scientific documents. On the other hand, Kupiec, Pedersen and Chen (Reference Kupiec, Pedersen and Chen1995) took advantage of human-produced abstracts, and asked annotators to align sentences from the document with sentences from there. However, these techniques required immense human intervention that is time-consuming. In the automatic annotation area, Banko et al. (Reference Banko, Mittal, Kantrowitz and Goldstein1999) proposed a method based on sentence similarity using a bag-of-words (BOW) representation. Marcu (Reference Marcu1999) proposed another method treating each sentence as a set of units that corresponds to clauses and defined similarity between units based on BOW representation. Jing and McKeown (Reference Jing and McKeown1999) proposed a bigram-based similarity approach using the HMM whereas Barzilay and Elhadad (Reference Barzilay and Elhadad2003) combined edit distance and context information around sentences for annotation. In DUC-2007, Toutanova et al. (Reference Toutanova, Brockett, Gamon, Jagarlamudi, Suzuki and Vanderwende2007) used ROUGEFootnote 6 toolkit (Lin Reference Lin2004) to measure sentence goodness against model summaries. Motivated by this, we assume each individual document sentence as the extract summary and calculated its ROUGE similarity scores with the corresponding abstract summaries and thus generate the labeled data set by annotating the top-scored N sentences as summary sentences. Hirao et al. (Reference Hirao, Suzuki, Isozaki and Maeda2004) represented the sentences using Dependency Tree Path (DTP) to incorporate syntactic information. They applied String Subsequence Kernel (SSK) to measure the similarity between DTPs of two sentences and introduced ESSK considering all possible senses to each word for building extracts from abstracts. Their method was effective. However, the fact that they did not disambiguate word senses cannot be disregarded. We consider this fact in our ESSK annotation model using disambiguated word senses and argue that this leads to the incorporation of more accurate semantic information.
3 Automatic annotation techniques
In this work, we prefer automatic annotation to manual annotation for producing a large amount of labeled data. The textual similarity measurement techniques of ROUGE similarity measure (Lin Reference Lin2004), BE overlap (Hovy et al. Reference Hovy, Lin, Zhou and Fukumoto2006), syntactic similarity measure (Moschitti and Basili Reference Moschitti and Basili2006), semantic similarity measure (Moschitti et al. Reference Moschitti, Quarteroni, Basili and Manandhar2007), and ESSK (Hirao et al. Reference Hirao, Suzuki, Isozaki and Maeda2003) are reimplemented in this research to do sentence annotation and explained in more detail here. Applying text similarity measurement techniques to perform automatic annotation is unique in a sense that no other study has accomplished it like ours before.
3.1 ROUGE similarity measures
ROUGE is an automatic tool to determine the quality of a summary by comparing it to reference summaries using a collection of measures (Lin Reference Lin2004). The measures count the number of overlapping units such as n-gram, word-sequences, and word-pairs between the extract and the abstract summaries. The ROUGE measures considered are ROUGE-N (N = 1,2,3,4), ROUGE-L, ROUGE-W, and ROUGE-S.
ROUGE-N is n-gram recall between a candidate summary and a set of reference summaries, which is computed as follows:

where, n is the length of n-grams and Count match(gramn) is the maximum number of n-grams co-occurring in a candidate summary and a set of reference summaries. In case of multiple abstracts, pairwise summary-level ROUGE-N between a candidate summary s and every reference ri, in the reference set is computed. Final ROUGE-N score is then obtained by taking the maximum of the summary-level ROUGE-N scores:

The ROUGE-L (Longest Common Subsequence) score between two summary sentences r of length m and s of length n (assuming r is a reference summary sentence and s is a peer summary sentence) can be computed as follows (Lin Reference Lin2004):
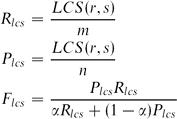
where P is the precision, R is recall, and F-measure combines precision and recall into a single measure.
ROUGE-W (Weighted Longest Common Subsequence) provides an improvement to the basic LCS method of computation by using the function f(n) to credit the sentences having the consecutive matches of words. WLCS can be calculated as follows:
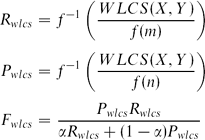
The ROUGE-S (Skip bi-gram) score between the candidate summary sentence S of length m and the reference summary sentence R of length n can be computed as follows:
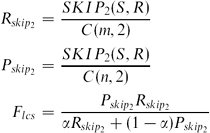
where, SKIP 2(S,Q) is the number of skip bi-gram (any pair of words in their sentence order, allowing for arbitrary gaps) matches between S and R, and α is a constant that determines the importance of precision and recall. C is the combination function. ROUGE-S is extended with the addition of unigram as counting unit, which is called ROUGE-SU (Lin Reference Lin2004).
We apply these ROUGE measures in order to filter out the original document sentences that are mostly similar to the abstract summary sentences. We assume each individual document sentence as the extract summary and calculate its ROUGE similarity scores with the corresponding abstract summaries. Thus, an average ROUGE score is assigned to each sentence in the document. We choose the top N sentences based on ROUGE scores to have the label +1 (summary sentences) and the rest to have the label −1 (non-summary sentences). This approach is unique as no one has used ROUGE similarly to ours before in order to generate labeled data automatically.
3.2 Basic Element (BE) overlap measure
According to Hovy et al. (Reference Hovy, Lin, Zhou and Fukumoto2006), Basic Elements are defined as follows:
• The head of a major syntactic constituent (noun, verb, adjective, or adverbial phrases) expressed as a single item. Or
• A relation between a head-BE and a single dependent, expressed as a triple: (head|modifier|relation).
With BE represented as a head–modifier–relation triple, one can quite easily decide whether any two units match or not considerably more easily than with longer units. Taken this fact into consideration, we get the idea of using BE to measure the overlapped units between document sentences and the abstract summary sentences. The approach of using BEs for automatically annotating document sentences is novel and therefore it is another contribution of this paper. We use the syntactic parser MiniparFootnote 7 to produce a parse tree. Then a set of ‘cutting rules’ are employed to extract only the valid BEs from the tree. We extract BEs for the sentences in the document collection using BE package 1.0 distributed by ISIFootnote 8. Once we obtain BEs for a sentence, we compute the Likelihood Ratio (LR) for each BE (Hovy, Lin and Zhou Reference Hovy, Lin and Zhou2005). The LR score of each BE is an information theoretic measure that represents the relative importance in the BE list from the document set that contains all the sentences to be aligned. Sorting BEs according to their LR scores produces a BE-ranked list. Our goal is to find similarity between document sentences and reference summary sentences. The ranked list of BEs in this way contains important BEs at the top, which may or may not be relevant to the abstract summary sentences. We filter those BEs by checking whether they contain any word that matches an abstract sentence word or a related word (i.e., synonyms, hypernyms, hyponyms, and gloss words, which are found using WordNet (Fellbaum Reference Fellbaum1998)). For each abstract sentence, we assign a score to every document sentence as the sum of its filtered BE scores divided by the number of BEs in the sentence. Thus, every abstract sentence contributes to the BE score of each document sentence and we select the top N number of sentences based on average BE scores to have the label +1 (summary) and rest to have the label −1 (non-summary).
3.3 Syntactic similarity measure
Word dependencies having an important role in finding similarity between two texts can be discovered using a syntactic parser. Syntactic parsing is analyzing a sentence using the grammar rules. One method to tag word dependencies is by using the Charniak parserFootnote 9. Pasca and Harabagiu (Reference Pasca and Harabagiu2001) demonstrated that with the syntactic form one can see which words depend on other words. There should be a similarity between the words that are dependent in the reference summary sentence and the dependency between words of the document sentence. Syntactic features have been used successfully so far in question answering (Zhang and Lee Reference Zhang and Lee2003; Moschitti and Basili Reference Moschitti and Basili2006; Moschitti et al. Reference Moschitti, Quarteroni, Basili and Manandhar2007). Inspired by the potential significance of using syntactic measures for finding similar texts, we get a strong motivation to use it in our automatic annotation framework. To the best of our knowledge, no other study has used syntactic information in order to perform automatic annotation similar to ours before.
In order to calculate the syntactic similarity between the abstract sentence and the document sentence, we first parse the corresponding sentences into syntactic trees using a parser-like (Charniak Reference Charniak2000). Then we calculate the similarity between the two trees using the tree kernel (TK) (Collins and Duffy Reference Collins and Duffy2001). We convert each parenthetic representation generated by the Charniak parser into its corresponding tree and give the trees as input to the TK functions for measuring the syntactic similarity. The tree kernel of two syntactic trees T1 and T2 is actually the inner product of v(T 1) and v(T 2):

We define the indicator function Ii(n) to be 1 if the sub-tree i is seen rooted at node n and 0 otherwise. It follows:
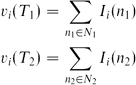
where, N 1 and N 2 are the set of nodes in T1 and T2, respectively. So we can derive
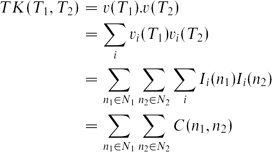
where, we define C(n 1, n 2) = ∑iIi(n 1) Ii(n 2). The TK function gives the similarity score between the abstract sentence and the document sentence based on the syntactic structure. Each abstract sentence contributes a score to the document sentence and the top N number of sentences are selected to be annotated as +1 and the rest as −1 based on the average of similarity scores.
3.4 Semantic similarity measure
Shallow semantic representations, bearing a more compact information, can prevent the sparseness of deep structural approaches and the weakness of BOW models (Moschitti et al. Reference Moschitti, Quarteroni, Basili and Manandhar2007). Initiatives such as PropBank (PB) (Kingsbury and Palmer Reference Kingsbury and Palmer2002) made it possible to design accurate automatic Semantic Role Labeling (SRL) systems (Hacioglu et al. Reference Hacioglu, Pradhan, Ward, Martin and Jurafsky2003). Therefore, we get the feeling that an application of SRL to automatic annotation might suit well, as similarity of an abstract sentence with a document sentence relies on a deep understanding of the semantics of both. So applying semantic text similarity measurement for the purpose of automatic data annotation is another noticeable contribution of this paper. In order to understand the process, let us consider one PB annotation example:
Such annotation can be used to design a shallow semantic representation that can be matched against other semantically similar sentences, e.g.,
In order to experiment with semantic structures, we parse the corresponding sentences semantically using an SRL system like ASSERT.Footnote 10 ASSERT is an automatic statistical semantic role tagger that can annotate naturally occurring text with semantic arguments. When presented with a sentence, it performs a full syntactic analysis of the sentence, automatically identifies all the verb predicates in that sentence, extracts features for all constituents in the parse tree relative to the predicate, and identifies and tags the constituents with the appropriate semantic arguments. We represent the annotated sentences using tree structures called semantic trees (ST). In ST, arguments are replaced with the most important word, often referred to as the semantic head. We look for noun, then verb, then adjective, then adverb to find the semantic head in the argument. As in tree kernels (Section 33), common substructures cannot be composed by a node with only some of its children as an effective ST representation would require. Moschitti et al. (Reference Moschitti, Quarteroni, Basili and Manandhar2007) solved this problem by designing the Shallow Semantic Tree Kernel (SSTK), which allows to match portions of a ST. The SSTK changes the ST by adding SLOT nodes, which provides a fixed number of slots, possibly filled with null arguments that encode all possible predicate arguments. The slot nodes are used in such a way that the adopted TK function can generate fragments containing one or more children. These changes generate a new C, which when substituted (in place of the original C) in (2) gives the new SSTK function that yields the similarity score between an abstract sentence and a document sentence based on semantic structure. Thus, each document sentence gets a semantic similarity score corresponding to each abstract sentence and then the top N number of sentences are selected to be labeled as +1 and the rest as −1 on the basis of average similarity scores.
3.5 Extended string subsequence kernel (ESSK)
Extended string subsequence kernel is a simple extension of the Word Sequence Kernel (WSK) (Cancedda et al. Reference Cancedda, Gaussier, Goutte and Renders2003) and SSK (Lodhi et al. Reference Lodhi, Saunders, Shawe-Taylor, Cristianini and Watkins2002). WSK receives two sequences of words as input and maps each of them into a high-dimensional vector space. WSK's value is just the inner product of two vectors. But WSK disregards synonyms, hyponyms, and hypernyms. On the other hand, SSK measures the similarity between two sequences of ‘alphabets.’ In original ESSK, each ‘alphabet’ in SSK is replaced by a disjunction of an ‘alphabet’ and its alternative (word senses) (Hirao et al. Reference Hirao, Suzuki, Isozaki and Maeda2003). However, it is to be noted that in original ESSK they used all possible senses of a word as alternatives disregarding word sense disambiguation (WSD).Footnote 11 In this research, we modified the ESSK model augmenting to it a WSD module. Using the modified ESSK to perform automatic annotation is unique as no other research has accomplished this before. We consider each word in a sentence as an ‘alphabet,’ and the alternative as its disambiguated sense that we find using the WSD System of Chali and Joty (Reference Chali and Joty2007). Our WSD module exploits WordNet as the knowledge source to find the semantic relations among words in a sentence and assign weights. The whole disambiguation is done in two major steps: (1) building a representation of all possible senses of the words, and (2) disambiguating the words based on the highest score.
During automatic annotation, we calculate the similarity score Sim(Ti, Uj) using our modified ESSK, where Ti denotes abstract sentence and Uj stands for document sentence. Formally, ESSK is defined as follows (Hirao et al. Reference Hirao, Suzuki, Isozaki and Maeda2004):
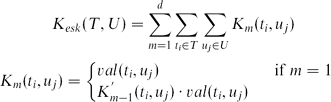
Here, K′m(ti, uj) is defined below. ti and uj are nodes of T and U, respectively. Each node includes a word and its disambiguated sense. The function val(t, u) returns the number of attributes common to the given nodes t and u.

Here λ is the decay parameter for the number of skipped words. K″m(ti,uj) is defined as

Finally, the similarity measure is defined after normalization as given below:

Indeed, this is the similarity score we assigned to each document sentence for each abstract sentence and in the end, the top N number of sentences are selected to be annotated as +1 and the rest as −1 based on average similarity scores.
4 Experiments
In this paper, we consider the DUC-2007 main task to run extensive experiments on our query-focused multi-document summarization systems. In this section, we present experimental details.
4.1 Corpus
We use DUC-2006 data to train all our systems and then produce extract summaries for the 25 topics of DUC-2007 data according to the task description. The DUC-2006 and DUC-2007 document sets came from the AQUAINT corpus, which comprises newswire articles from the Associated Press and New York Times (1998–2000), and Xinhua News Agency (1996–2000).
4.2 Data processing
We clean up the raw data and extract information about the topics by deleting all the unnecessary tags. The sentences of each given document are tokenized by placing one sentence in each line. We do this to label the sentences (by +1 or −1 meaning summary or non-summary sentence) individually. We use OAK system (Sekine Reference Sekine2002) for this purpose.
4.3 Feature extraction
We represent each sentence of a document as a vector of feature-values. We divide the features into two major categories: the features that declare the importance of a sentence in a document, and the features that measure the similarity between each sentence and the user query (Edmundson Reference Edmundson1969; Sekine and Nobata Reference Sekine and Nobata2001; Chali and Joty Reference Chali and Joty2008; Chali et al. Reference Chali, Joty and Hasan2009).
4.3.1 Importance measures
Position of sentences. We give score 1 to those sentences found within the first and the last three sentences of a document and assign score 0 to the rest, as the early and late sentences are considered important intuitively.
Length of sentences. If a sentence is longer, we can heuristically claim that it has a better chance of inclusion in the summary. We give score 1 to a longer sentence and assign score 0 otherwise. In this work, we considered a sentence as long if it has more than eleven words.
Title match. If we find a match such as exact word overlap, synonym overlap, and hyponym overlap between the title and a sentence, we give it the score 1, otherwise 0.
Named entity. Score 1 is given to a sentence that contains a certain Named Entity class among PERSON, LOCATION, ORGANIZATION, Geo-Political Entity (GPE), FACILITY, DATE, MONEY, PERCENT, TIME. We use OAK System (Sekine Reference Sekine2002) from the New York University for Named Entity recognition.
Cue word match. Guided by practical experience and observations, we feel that the probable relevance of a sentence is certainly affected by the presence of cue words such as ‘significant,’ ‘impossible,’ ‘in conclusion,’ ‘finally,’ etc. We use a cue word list of 228 words. We give score 1 to a sentence having any of the cue words and 0 otherwise.
4.3.2 Query-related features
n-gram overlap. This is the recall between the query and the candidate sentence, where n stands for the length of the n-gram (n = 1,2,3,4).
LCS. Given two sequences S 1and S 2, the LCS of S 1and S 2 is a common subsequence with maximum length.
WLCS. It improves the basic LCS method to remember the length of consecutive matches encountered so far (Lin Reference Lin2004). We compute the WLCS-based F-measure between a query and a sentence.
Skip-bigram. Skip-bigram measures the overlap of skip-bigrams between a candidate sentence and a query sentence. Skip-bigram counts all in-order matching word pairs, while LCS only counts one longest common subsequence.
Exact-word overlap. This is a measure that counts the number of words matching exactly between the candidate sentence and the query sentence.
Synonym overlap. This is the overlap between the list of synonyms of the content words extracted from the candidate sentence and query-related words. This can be computed as follows:

where SynSet is the synonym set of content words (i.e., nouns, verbs, and adjectives) in the sentence and Countmatch is the number of matches between the SynSet and query-related words. We use WordNet (Fellbaum Reference Fellbaum1998) database for this purpose.
Hypernym/hyponym overlap. This is the overlap between the list of hypernyms (up to level 2 in WordNet) and hyponyms (level 3) of the nouns extracted from the sentence in consideration and query-related words. This can be computed as follows:

where HypSet is the hyponym/hyponym set of the nouns in the sentence and Countmatch is the number of matches between the HypSet and query-related words.
Gloss overlap. This is the overlap between the list of content words (i.e., nouns, verbs, and adjectives) that are extracted from the gloss definition of the nouns in the sentence in consideration and query-related words. This can be computed as follows:

where GlossSet is the set of content words (i.e., nouns, verbs, and adjectives) taken from the gloss definition of the nouns in the sentence and Countmatch is the number of matches between the GlossSet and query-related words.
Syntactic feature. The syntactic similarity between the query and the sentence is calculated after parsing them into syntactic trees using a parser such as given by Charniak (Reference Charniak2000) and finding similarity between the two trees using the tree kernel (Collins and Duffy Reference Collins and Duffy2001).
BE overlap. We extract BEs (discussed in Section 3.2) for the sentences in the document collection. Then we filter those BEs by checking whether they contain any word which is a query word or a query-related word and get the BE overlap score (Hovy et al. Reference Hovy, Lin and Zhou2005).
4.4 Training and testing data preparation
We use five automatic annotation methods to label each sentence of fifty document sets of DUC-2006 to produce five different versions of training data for feeding the SVM, HMM, CRF, and MaxEnt learners. We choose the top 30% sentences (based on the scores assigned by an annotation scheme) of a document set to have the label +1 and the rest to have −1. Unlabeled sentences of twenty-five document sets of DUC-2007 data are used for the testing purpose.
In another experiment, to check whether a balanced set of training data improves the performance of the supervised systems or not, we obtain a training data set by annotating (using only ROUGE similarity measures (Lin Reference Lin2004)) 50% sentences of each document set as positive and the rest as negative. The ensemble experiments are also performed using this balanced set of training data.
Typically, the training data includes a collection of sentences where each sentence is represented as a combination of a feature vector and corresponding class label (+1 or −1). On the other hand, testing data comprises a set of sentences that is represented as feature vectors. The organization of training and testing data depends on the input format of the package that is used for a particular supervised system.
4.5 Supervised methods
In this work, we formulate the query-focused multi-document summarization problem in terms of different supervised approaches. The supervised methods we use are SVMs, CRFs, HMMs, and MaxEnt. We also employ two ensemble-based supervised approaches for the same task. The following subsections give a detailed description of how we use these methods.
4.5.1 Support vector machine (SVM)
Support vector machine is a powerful methodology for solving machine learning problems introduced by Cortes and Vapnik (Reference Cortes and Vapnik1995) based on the principle of structural risk minimization. In the classification problem, the SVM classifier typically follows from the solution to a quadratic problem. SVM finds the separating hyperplane that has maximum margin between the two classes in case of binary classification. SVMs can also handle nonlinear decision surfaces introducing kernel functions. In this research, we use polynomial kernel functions, which have been found to be very effective in the study of other tasks in natural language processing (NLP) (Joachims Reference Joachims1998; Kudo and Matsumoto Reference Kudo and Matsumoto2001). To be specific, we use the second-order polynomial kernel for the ROUGE- and ESSK-labeled training sets. For the BE, syntactic- and semantic-labeled training sets, the third-order polynomial kernel is used. The third-order polynomial kernel is also used when we do experiments with the balanced training data. The use of each kernel is based on the accuracy we achieved during training.
In order to allow some flexibility in separating the classes, SVM models have a cost parameter, C, that controls the trade-off between allowing training errors and forcing rigid margins. It creates a soft margin that permits some misclassifications. Increasing the value of C increases the cost of misclassifying points and forces the creation of a more accurate model that may not generalize well. We apply three-fold cross-validation with randomized local-grid search (Hsu, Chang and Lin Reference Hsu, Chang and Lin2008) for estimating the value of the trade-off parameter C. Intuitively, we try the value of C in 2i, where i ∈ {−5,−4,. . .,4, 5} and set C as the best performed value of 0.125 for the second-order polynomial kernel. We keep the default value for the third-order polynomial kernel. We use the SVMlight (Joachims Reference Joachims1999) packageFootnote 12 for training and testing in this work. SVMlight is an implementation of SVM (Cortes and Vapnik Reference Cortes and Vapnik1995) for the problems of pattern recognition, regression, and learning a ranking function. The optimization algorithms used here have scalable memory requirements and can handle problems with many thousands of support vectors efficiently. This software also provides methods for assessing the generalization performance efficiently. It includes two efficient estimation methods for both error rate and precision/recall. SVMlight consists of a learning module and a classification module. The learning module takes an input file containing the feature values with corresponding labels and produces a model file. The classification module is used to apply the learned model to new examples.
4.5.2 Hidden markov models (HMM)
Hidden markov models are a form of generative models that assign a joint probability p(x,y) to pairs of observation and label sequences, x and y, respectively (Wallach Reference Wallach2002). Each observation sequence (here, sentence sequence) is considered to have been generated by a sequence of state transitions, beginning in some start state and ending when some predesignated final state is reached. At each state an element of the observation sequence is stochastically generated before moving to the next state. For any observation sequence, the sequence of states that best accounts for that observation sequence is essentially hidden from an observer and can only be viewed through the set of stochastic processes that generate an observation sequence. The principle of identifying the most state sequence that best accounts for an observation sequence forms the foundation underlying the use of finite-state models for labeling sequential data.
In this work, we apply Maximum Likelihood EstimationFootnote 13 (MLE) technique by frequency counts with add-one smoothingFootnote 14 to estimate the three HMM parameters: initial state probabilities, transition probabilities and emission probabilities. We use Dr. Dekang Lin's HMM packageFootnote 15 to generate the most probable label sequence given the model parameters and the observation sequence (unlabeled DUC-2007 test data).
4.5.3 Conditional random fields (CRF)
CRFs, introduced by Lafferty, McCallum and Pereira (Reference Lafferty, McCallum and Pereira2001), are undirected graphical models (Wallach Reference Wallach2002) that allows the specification of a single joint probability distribution over the entire label sequence given the observation sequence (here, sentence sequence), rather than defining per-state distributions over the next states given the current state. The conditional nature of the distribution over label sequences allows CRFs to model real-world data in which the conditional probability of a label sequence can depend on non-independent, interacting features of the observation sequence.
In this research, we use MALLET-0.4 NLP toolkitFootnote 16 (McCallum Reference McCallum2002) to implement the CRF-based summarization system. We formulate our problem in terms of MALLET's SimpleTaggerFootnote 17 class, which is a command line interface to the MALLET CRF class. The original SimpleTagger class did not include any means of denoting the confidence of each labeled instance. Therefore, we modify the SimpleTagger class in order to include the provision for producing corresponding posterior probabilities of the predicted labels, which are used later for ranking sentences.
4.5.4 Maximum entropy (MaxEnt)
The main principle of the MaxEnt method is to model all that is known and assume nothing about that which is unknown. In other words, given a collection of facts, the model must be consistent with all the facts, but otherwise act as uniformly as possible (Berger et al. Reference Berger, Pietra and Pietra1996). MaxEnt models can be termed as multinomial logistic regression if they are to classify the observations into more than two classes (Jurafsky and Martin Reference Jurafsky and Martin2009). However, in this research, we used the MaxEnt model to classify the sentences into two classes: summary and non-summary. We build the MaxEnt system using Dr. Dekang Lin's MaxEnt package.Footnote 18 In order to define the exponential prior of the λ valuesFootnote 19 in MaxEnt models, an extra parameter α is used in the package during training. We keep the value of α as default.
4.5.5 Ensemble methods
Ensemble methods are learning algorithms that construct a set of classifiers and classify new data points by taking a (weighted) vote of their predictions (Dietterich Reference Dietterich2000). The main strategy is to improve the overall performance by correcting mistakes of one classifier using the accurate output of others. Thus, ensembles are often much more accurate than the individual base models that make them up. Ensemble learning consists of two problems – ensemble generation: how does one generate the base models? and ensemble integration: how does one integrate the base model predictions to improve performance? Ensemble generation can be characterized as being homogeneous if each base learning model uses the same learning algorithm, or heterogeneous if the base models can be built from a range of learning algorithms (Rooney et al. Reference Rooney, Patterson, Tsymbal and Anand2004). Many methods for constructing ensembles have been developed over the years that consider Bayesian voting, manipulation of the training examples, input features and output targets, injecting randomness, and so on. The most general-purpose homogeneous ensemble methods are Bagging, AdaBoost algorithm and Cross-Validation Committees (CVC) (Dietterich Reference Dietterich2000). In this research, we use the CVC approach (Parmanto, Munro and Doyle Reference Parmanto, Munro and Doyle1996) of constructing an homogeneous ensemble to inject differences into several SVM classifiers. We apply the supervised learning techniques: SVMs, HMMs, CRFs, and MaxEnt to get individual predictions and combine them to form a heterogeneous ensemble.
Homogeneous ensemble. Ensemble generation for homogeneous learning is generally addressed by using different samples of the training data for each base model keeping the learning algorithm stable (Rooney et al. Reference Rooney, Patterson, Tsymbal and Anand2004). In this work we use the CVC approach to make four different SVM classifiers. To our knowledge, no other research has employed CVC-based ensemble approach for query-focused multi-document summarization (Chali et al. Reference Chali, Hasan and Joty2009a). CVC is a training set sampling method where the strategy is to construct the training sets by leaving out disjoint subsets of the training data (Dietterich Reference Dietterich2000). For instance, the training set can be randomly divided into four disjoint subsets. Then four overlapping training sets can be built by dropping out a different one of these four subsets. As the same type of procedure is employed to construct training sets for four-fold cross-validation, so ensembles constructed in this manner are termed as CVCs (Parmanto et al. Reference Parmanto, Munro and Doyle1996). An important issue in the CVC is the degree of data overlap between the replicates that is the different training subsets. The degree of overlap essentially depends on the number of replicates and the size of a removed fraction from the original sample.
1. Divide whole training data set D into v-fractions d 1,. . .,dv.
2. Leave one fraction dk and train classifier ck with the rest of the data (D - dk).
3. Build a committee from the classifiers using a simple averaging procedure.
Algorithm 1: Cross-Validation Committees (CVC) Method
The fraction of data overlap determines the trade-off between the individual classifier performance and error correlation between the classifiers. Lower correlation is often obvious if the classifiers are trained with less overlapped data. The typical algorithm of the CVC approach (Parmanto et al. Reference Parmanto, Munro and Doyle1996) is presented in Algorithm 1.
In order to build a homogeneous ensemble, we generate four different SVM models in the following way. We divide the training data set (DUC-2006 data) into four equal-sized groups. According to the algorithm, each time we keep 25% of the data aside and use the remaining 75% data for training. Next, we present the test data (DUC-2007 data) before each of the generated SVM models, which produces individual predictions (decision scores along with a label +1 or −1) to those unseen data. The decision scores are the normalized distance from the separating hyperplaneFootnote 20 to each sample. Then, we create the SVM ensemble by combining the predictions by simple weighted averaging. We increment a particular classifier's decision value by 1 (giving more weight) if it predicts a sentence as positive and decrement by 1 (imposing penalty) if the case is opposite. The resulting prediction values are used later for ranking the sentences. During training steps, we use the third-order polynomial kernel for SVM keeping the default value of the trade-off parameter C. We perform the training experiments in WestGrid,Footnote 21 which operates a high-performance computing (HPC) collaboration and visualization infrastructure across western Canada. We use the Cortex cluster, which comprises some shared-memory computers for large serial jobs or demanding parallel jobs.
Heterogeneous ensemble. Differences among the classifiers can be realized by using separate training samples with the same learning method (Qi and Huang Reference Qi and Huang2007). We experiment with an ensemble method that uses the same training set on different learning methods. Thus, we consider it as a heterogeneous ensemble that joins the above four classifiers (SVM, HMM, CRF, and MaxEnt), which are somehow different in accomplishing the classification task. We combine the individual decisions of the classifiers by taking a weighted voting. Then the combined decision values are used to label the unseen data set. We impose a positive weight (ranging from 1 to 5 depending on the individual classifier's performance, more weight if it is declared positive by a better performer) to each positively classified sentence. We take no action for the negatively classified sentences so that they can fall back during ranking.
4.6 Sentence ranking
Extract summary generation can be thought of as searching for important sentences in the documents, which can be dealt with as a two-class problem. However, the proportion of important sentences in training data will differ from that in test data. The number of important sentences in a document is determined by a summarization rate or word limit, which is given at run-time. In the multi-document summarization task at DUC-2007, the limit was 250 words. A simple solution to this problem is to rank sentences in a document, then select the top N sentences.
In SVM systems, we use g (x), the normalized distance from the hyperplane to each sample point, x to rank the sentences. Then we choose N sentences until the summary length (250 words for DUC-2007) is reached. For HMM systems, we use Maximal Marginal Relevance (MMR)-based method to rank the sentences (Carbonell, Geng and Goldstein Reference Carbonell, Geng and Goldstein1997). According to MMR, we choose a sentence for inclusion in summary such that it is maximally similar to the document and dissimilar to the already selected sentences. In CRF systems, we generate posterior probabilities corresponding to each predicted label in the label sequence to measure the confidence of each sentence for summary inclusion. Similarly, for MaxEnt the corresponding probability values of the predicted labels are used to rank the sentences.
5 Results and analyses
In DUC-2007, each topic and its document cluster were given to four different NIST assessors, including the developer of the topic. The assessor created a 250-word summary of the document cluster that satisfies the information need expressed in the topic statement. These multiple ‘reference summaries’ are used in the evaluation of our summary content. In this section we present the automatic and manual evaluation results of all our systems.
5.1 Automatic evaluation results
We evaluate the system-generated summaries using the automatic evaluation toolkit ROUGE (Lin Reference Lin2004), which has been widely adopted by DUC (Now TACFootnote 22). The available ROUGE measures are ROUGE-N (N = 1,2,3,4), ROUGE-L, ROUGE-W, and ROUGE-S. ROUGE parameters were set as that of DUC-2007 evaluation setup.
Precision (P-measure) and recall (R-measure) are the widely used evaluation measures computed based on the number of units (i.e., sentences, words, etc) common to both system-generated and reference summaries. F-measure, another important measure in NLP, combines precision and recall into a single measure of overall performance. We consider these widely used evaluation measures, P, R, and F, for our evaluation task. We report the three widely adopted ROUGE metrics in the results: ROUGE-1 (unigram), ROUGE-2 (bigram), and ROUGE-SU (skip bi-gram) because these have never been shown to not correlate with the human judgement. All the ROUGE measures are calculated by running ROUGE-1.5.5 with stemming but no removal of stopwords.
ROUGE run-time parameters:

We show 95% confidence interval of the evaluation metric, ROUGE-SU for all systems to report significance for doing meaningful comparison. We use the ROUGE tool for this purpose. ROUGE uses a randomized method named bootstrap resampling to compute the confidence interval. Bootstrap resampling has a long tradition in the field of statistics (Efron and Tibshirani Reference Efron and Tibshirani1994). The assumption here is that estimating the confidence interval from a large number of test sets with n test samples drawn from a set of n test samples with replacement is as good as estimating the confidence interval for the test sets of size n from a large number of test sets with n test samples drawn from an infinite set of test samples. The benefit of this assumption is that we only need to consider n samples. We use 1,000 sampling points in the bootstrap resampling.
5.1.1 Impact of automatic annotation techniques
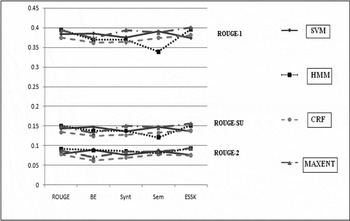
In order to study the impact of different automatic annotation techniques on performance of the supervised approaches to the query-focused multi-document summarization task, we generated summaries for 25 topics of DUC-2007 data by each of our four supervised systems, SVM, HMM, CRF, and MaxEnt, with each system trained using five different automatic labeling methods. Figure 2 shows the ROUGE F-measures for SVM, HMM, CRF, and MaxEnt systems. The x-axis containing ROUGE, BE, Synt (Syntactic), Sem (Semantic), and ESSK stands for the used annotation scheme. The y-axis shows the ROUGE-1 scores at the top, ROUGE-2 scores at the bottom, and ROUGE-SU scores in the middle. The supervised systems are distinguished by the line style used in the figure.
ROUGE F-scores for different supervised systems.

From the figure, we can see that the ESSK-labeled SVM system is having the poorest ROUGE-1 score whereas the Sem-labeled system performs the best. The other annotation methods’ impact here is almost similar in terms of ROUGE-1. Analyzing ROUGE-2 scores, we find that the BE performs the best for SVM, on the other hand Sem achieves top ROUGE-SU score. As for two measures, Sem annotation is performing the best, hence we can typically conclude that Sem annotation is the most suitable method for the SVM system. ESSK works best for HMM and Sem labeling does worst for all ROUGE scores. Synt- and BE-labeled HMMs perform almost similar whereas ROUGE-labeled system is pretty close to that of ESSK. Again, we see that the CRF performs the best with the ESSK-annotated data in terms of ROUGE -1 and ROUGE-SU scores and Sem has the highest ROUGE-2 score. But BE and Synt labeling work bad for CRF whereas the ROUGE labeling performs close to ESSK. So we can typically conclude that ESSK annotation is the best method for the CRF system. Analyzing further, we find that ESSK works best for MaxEnt and BE labeling is the worst for all ROUGE scores. We can also see that ROUGE-, Synt-, and Sem-labeled MaxEnt systems perform almost similar. So from this discussion we can come to a conclusion that SVM system performs the best if training data uses semantic annotation scheme and ESSK works the best for HMM, CRF, and MaxEnt systems.
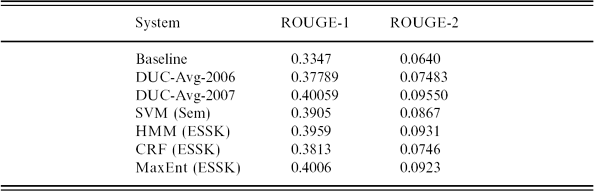
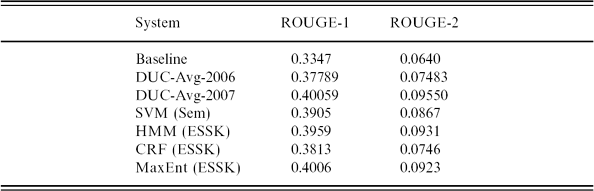
For a direct comparison, in Table 1 we show average ROUGE F-Scores of one baseline system and four supervised approaches in terms of their best suited annotation method used. The baseline system generates summaries by returning all the leading sentences (up to 250 words) in the 〈 TEXT 〉 field of the most recent document(s). We also list the average ROUGE scores of all the participating systems of DUC-2006 and DUC-2007 (i.e., DUC-Avg-2006 and DUC-Avg-2007). Table 1 shows that all the supervised systems typically outperform the baseline system with their best annotation method applied and among the supervised systems, and MaxEnt system performs the best with SVM, HMM, and CRF to follow. We can also find that all the supervised systems beat the average DUC-2006 ROUGE scores (except CRF not beating ROUGE-2 score). On the other hand, MaxEnt outperforms the ROUGE-1 score of average DUC-2007 systems while all other supervised system scores are pretty much close as we see from comparison.
F-measures of supervised systems (comparison)
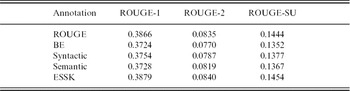
From another angle of analysis, if we average all the corresponding ROUGE F-scores of the SVM, HMM, CRF, and MaxEnt systems, we can clearly show the general impact of different annotation techniques on all the supervised approaches cumulatively in Table 2. Here we find ESSK as the most effective annotation strategy. From Table 2 we can also infer that ROUGE is somewhat respectable as labeling method whereas BE, Syntactic, and Semantic techniques perform almost similar for the task of labeling.
General impact of annotation techniques

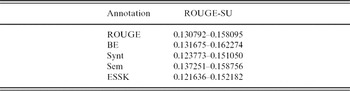
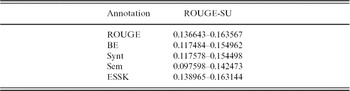
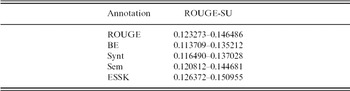
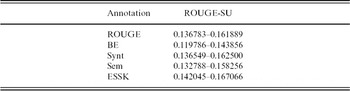
In Tables 3 to 6, we show the 95% confidence intervals of the F-measures for ROUGE-SU for SVM, HMM, CRF, and MaxEnt systems, respectively, to meaningfully compare the impact of annotation methods.
95% confidence intervals for SVM

95% confidence intervals for HMM

95% confidence intervals for CRF

95% confidence intervals for MaxEnt

Analyzing the confidence intervals from Tables 3 to 6, it is obvious that Sem annotation is performing better than other methods for SVM system and ESSK is having the best scores for HMM, CRF, and MaxEnt systems.
Lessons learned. Analyzing the results presented above, we understand that difference in choice of automatic annotation techniques certainly affects the performance of the supervised techniques in consideration. Observing all these results, we can reasonably state that ESSK method of labeling data suits the best for most of the supervised systems. This is because ESSK does a deep semantic analysis while measuring the similarities between document sentences and abstract summary sentences by incorporating the word sense information.
5.1.2 Balanced/unbalanced training data
We perform another experiment by feeding a balanced set of training data (annotating 50% sentences as positive and the rest as negative by ROUGE similarity measure) into the learners of the supervised systems. Tables 7 to 9 present the ROUGE-F score comparisons of the supervised systems in terms of balanced and unbalanced (30% positive samples) training data.
SVM comparisons based on balanced/unbalanced training data

HMM comparisons based on balanced/unbalanced training data

CRF comparisons based on balanced/unbalanced training data

Lessons learned. From deep analyses on the above results we understand that supervised systems perform well for the query-focused multi-document summarization task if they are trained on a data set where positive samples are in less numbers. This is because we always pick up a very small number of sentences to be included in the target summary.
5.1.3 Ensemble experiments
For our ensemble experiments, we use the balanced training data set. Here we use the ROUGE similarity measure-based labeling data. We performed this experiment early in this research, so we chose the balanced training data and ROUGE-based labeling data since they were only available at that time.
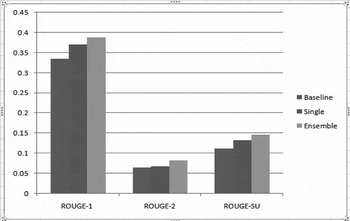
Homogeneous ensemble. The single SVM system is trained on the full data set of DUC-2006. The approach of the baseline system is to select the lead sentences (up to 250 words) from a document set for each topic. Figure 3 clearly suggests that the SVM ensemble system outperforms the baseline system with a high margin for all of the ROUGE measures. It also outperforms the single SVM system by a meaningful margin.
SVM-based ensemble beating single SVM.

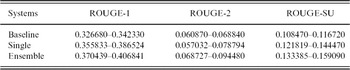
In Table 10, We report 95% confidence intervals of the F-measures for the single SVM system, the baseline system, and the SVM ensemble system to show significance for meaningful comparison. We can see from table 10 that the ensemble system performs better than the single SVM and the baseline systems.
95% confidence intervals for different systems

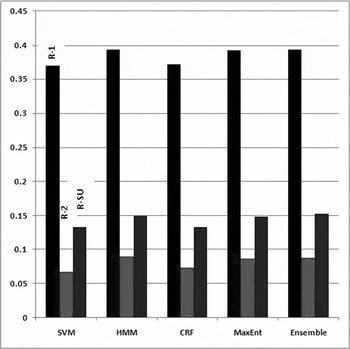
Heterogeneous ensemble. We experiment with an ensemble-based approach combining the individual decisions of the four classifiers: SVM, CRF, HMM, and MaxEnt. Figure 4 portrays the comparison of all the supervised systems. We can clearly see that most of the supervised systems outperform the baseline system by a high margin and the ensemble system is typically the best performer. This is because the individual classifier decisions are combined together to judge the sentence labels correctly. Comparison of the four supervised methods individually reveals that HMM is performing the best and MaxEnt, CRF, and SVM are the next in the performance ranking, respectively. The reason for this is that HMM treats the task as a sequence labeling problem and the scores are improved further as we use the MMR method for sentence ranking, which is proved to be an effective way of reducing the redundancy. We can also understand that the MaxEnt method performs better than the SVM system, concluding that high-order kernels may not be suited well for the problem domain.
Comparison of supervised systems.

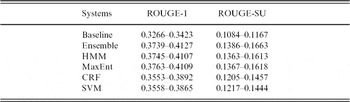
In Table 11, we show the 95% confidence intervals of the F-measures of ROUGE-1 and ROUGE-SU for the baseline system and our supervised systems.
95% confidence intervals for different systems

If we analyze Table 11, we find that all the supervised systems perform significantly better than the baseline system. On the other hand, for the ensemble system, HMM and MaxEnt, we get a high overlap in terms of all ROUGE measures.
Lessons learned. From the ensemble experiments run in this research, we can clearly observe that ensemble methods are pretty much suitable for the query-focused multi-document summarization domain as they considerably outperform their individual counterparts. This indeed reflects the main strategy of using ensembles, i.e., to improve the overall performance by correcting mistakes of one classifier using the accurate output of others. Thus, from these experiments we learn that creation of ensembles is an effective way to generate query-focused summaries as they are often much more accurate than the individual base models that make them up.
5.2 Manual evaluation results
For a sample of forty-six summariesFootnote 23 drawn from the generated summaries of our different systems, we conduct an extensive manual evaluation in order to analyze the effectiveness of our approaches. The manual evaluation comprises a Pyramid-based evaluation of contents and a user evaluation to obtain the assessment of linguistic quality and overall responsiveness.
5.2.1 User evaluation
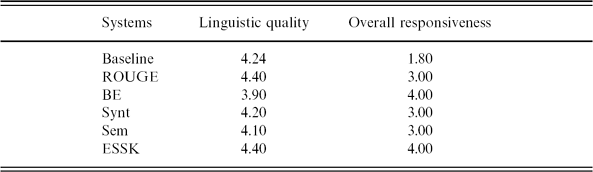
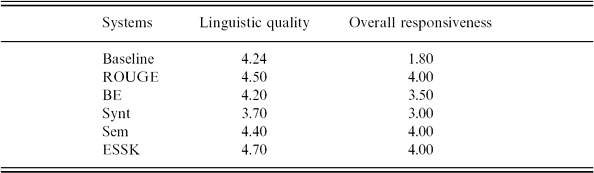
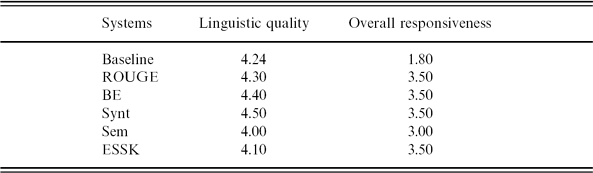
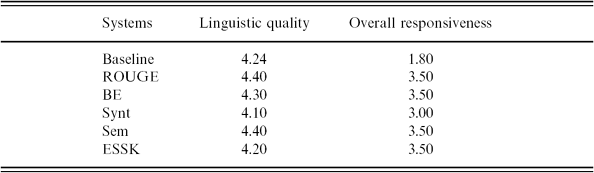
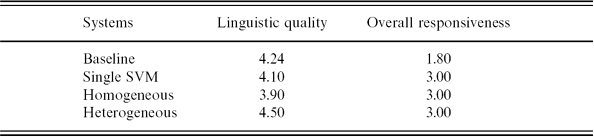
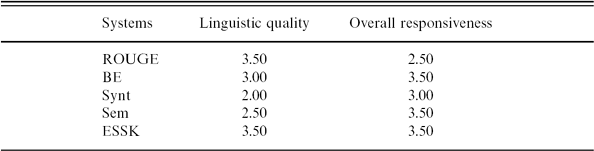
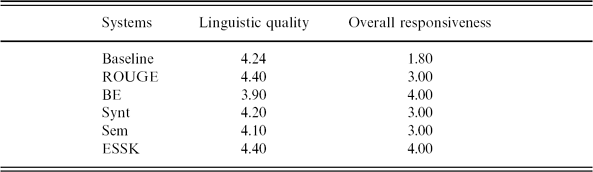
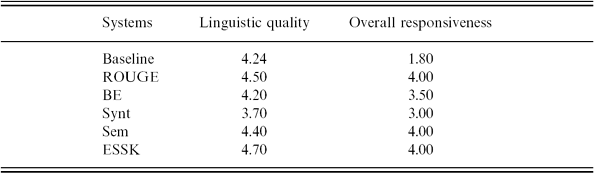
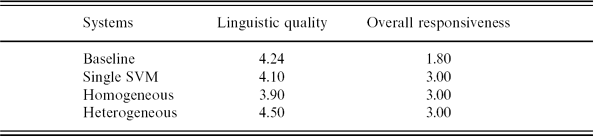
Two university graduate students judged the summaries for linguistic quality and overall responsiveness according to the DUC-2007 evaluation guidelines.Footnote 24 The given score is an integer between 1 (very poor) and 5 (very good) and is guided by consideration of the following factors: (1) grammaticality, (2) non-redundancy, (3) referential clarity, (4) focus, and (5) structure and coherence. They also assigned a content responsiveness score to each of the automatic summaries. The content score is an integer between 1 (very poor) and 5 (very good) and is based on the amount of information in the summary that helps to satisfy the information need expressed in the topic narrative. Tables 12 to 16 present the average linguistic quality and overall responsive scores of all our systems. The same baseline system scores are given for meaningful comparison. From analyses of these tables, we can see that ESSK-labeled system is the best for SVM and CRF in terms of both linguistic quality and responsiveness scores whereas ESSK does the best for HMM and MaxEnt systems only in terms of responsiveness scores. For all combinations of annotation methods and supervised systems, we find that they all outperform the responsiveness score of the baseline system and show decent performance in terms of linguistic quality. From evaluation results of the ensemble methods (Table 16), we can observe that all ensembles are performing closely to their individual counterparts, while heterogeneous ensemble beating the baseline system in all scores and homogeneous ensemble is beating only the responsiveness score.
Linguistic quality and responsive scores for SVM
Linguistic quality and responsive scores for CRF
Linguistic quality and responsive scores for HMM
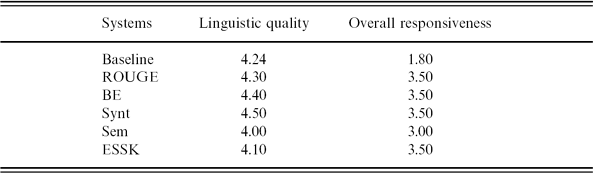
Linguistic quality and responsive scores for MaxEnt
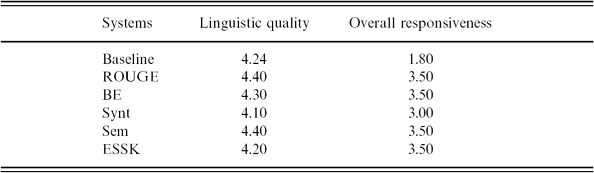
Linguistic quality and responsive scores for ensemble systems
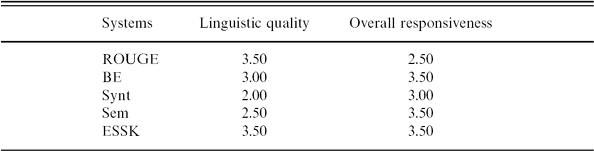
Manual judgement of annotation performance. From another point of analysis, to draw a certain conclusion on the relation between qualities of automatically labeled data and final performances of supervised methods using them, we conduct another experiment by extracting 10% of the most salient sentences from differently labeled data set and manually judge their linguistic quality and overall responsiveness scores corresponding to human-generated abstract summaries. For a randomly chosen set of two topics from DUC-2006 data, we perform this analysis and show the results in Table 17. Observing the results from this analysis, we understand again that, typically, ESSK-based annotation provides mostly similar sentences to the abstract summary sentences denoting its postive impact on the performance of the supervised methods considered.
Manual judgement of annotation performance
5.2.2 Pyramid evaluation
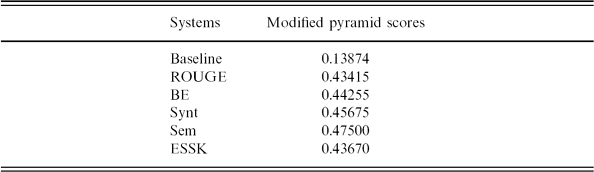
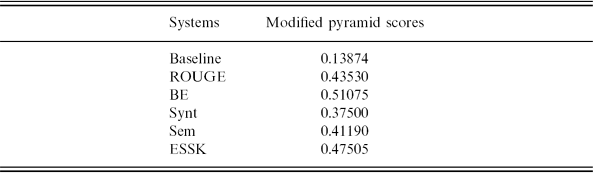
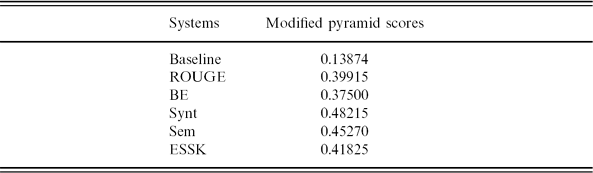
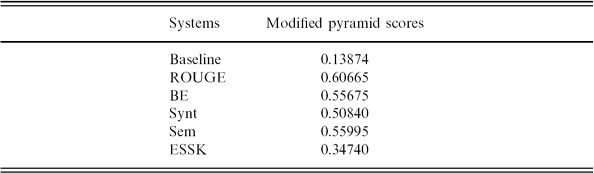
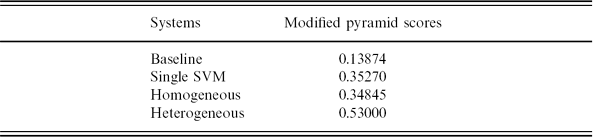
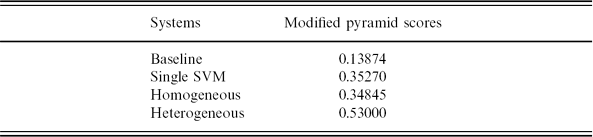
The Pyramid method for summary evaluation focuses on the task of determining if a system summary expresses the same content as a set of manual model summaries. A set of word spans, which expresses similar meaning, is referred to as a Summary Content Unit (SCU). After similar manual annotation of a complete set of reference summaries, the resulting set of SCUs is called a pyramid. A pyramid can be used to evaluate new summaries, following a method proposed by Harnly et al. (Reference Harnly, Nenkova, Passonneau and Rambow2005). In the DUC-2007 main task, twenty-three topics were selected for the optional community-based pyramid evaluation. Volunteers from sixteen different sites created pyramids and annotated the peer summaries for the DUC main task using the given guidelines (http://www1.cs.columbia.edu/~becky/DUC2006/2006-pyramid-guidelines.html). Eight sites among them created the pyramids. We used these pyramids to annotate our peer summaries to compute the modified pyramid scores.Footnote 25 We used the DUCView.jar Footnote 26 annotation tool for this purpose. Tables 18 to 22 show the modified pyramid scores of all our systems. A baseline system score is also reported. The peer summaries of the baseline system are generated by returning all the leading sentences (up to 250 words) in the 〈 TEXT 〉 field of the most recent document(s). Analyzing the results of these tables, we find that Sem, BE, Synt, and ROUGE are performing the best for SVM, CRF, HMM, and MaxEnt systems, respectively. On an average, we observe that ESSK is showing consistent performance for all the supervised systems whereas all the systems are outperforming the baseline system by a significant margin. From the ensemble evaluations, we find that heterogeneous ensemble is performing the best; on the other hand, homogeneous ensemble performs closely to its individual counterpart.
Modified pyramid scores for SVM systems
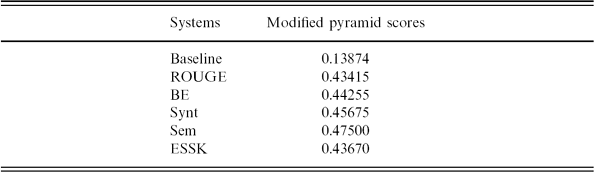
Modified pyramid scores for CRF systems
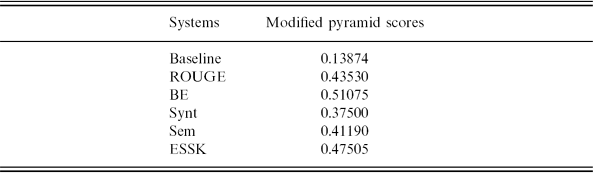
Modified pyramid scores for HMM systems
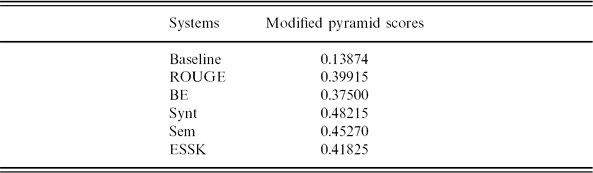
Modified pyramid scores for MaxEnt systems
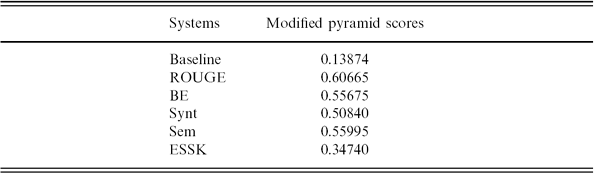
Modified pyramid scores for ensemble systems
5.2.3 Lessons learned
From the extensive manual evaluation results and analyses presented above, we come to learn again that the choice of an automatic annotation method largely impacts the performance of a supervised model. If the automatic annotation model incorporates deep semantic information while judging the most important sentences that are closely related to the human-provided summary sentences, then the performance of a supervised system becomes reasonably better. Hence, we conclude that ESSK-labeled data can be the best option if we experiment with supervised methods to build query-focused multi-document summarization systems.
6 Conclusions and future directions
Our main concern in this work was to address the query-focused multi-document summarization problem in a supervised framework. In this research, we have been inspired by the idea of several text similarity measurement techniques and tuned them up to different extent to fit for automatic labeling of data set. We chose automatic annotation strategy over manual annotation in order to generate a huge amount of labeled data. We reimplemented five different text similarity measurement techniques: ROUGE similarity measure, BE overlap, syntactic similarity measure, semantic similarity measure, and ESSK and applied them to perform automatic annotation. We built our query-focused multi-document summarization systems applying four different supervised machine learning techniques: SVMs, HMMs, CRFs, and MaxEnt. Then we conducted an extensive experimental analysis to show the impact of five automatic annotation methods on the performance of the four supervised machine learning techniques. To the best of our knowledge, no other study has deeply investigated and compared the effects of using different automatic annotation techniques on different supervised learning approaches in the domain of query-focused multi-document summarization. We evaluated our systems automatically using ROUGE and reported the significance of our results through 95% confidence intervals. We also presented manual evaluation results to compare our systems meaningfully. We also experimented with two supervised ensemble-based approaches that combine individual decisions of the classifiers.
Analyzing all the results in this paper, we clearly understood that the difference in choice of automatic annotation techniques certainly affects the performance of the supervised techniques in consideration. Further observations from different experiments and evaluations reasonably illustrates that ESSK method of labeling data suits the best for most of the supervised systems. This is because ESSK does a deep semantic analysis while measuring the similarities between document sentences and abstract summary sentences by incorporating the word sense information. From the ensemble experiments run in this research, we conclude that ensemble methods are pretty much suitable for the query-focused multi-document summarization domain as they considerably outperform their individual counterparts that reflects the main strategy of using ensembles, i.e., to improve the overall performance by correcting mistakes of one classifier using the accurate output of others. We also assessed the system performances by feeding balanced and unbalanced data during the learning phase. From this experiment we inferred that the systems trained with an unbalanced data set, where positive samples are less in proportion, often outperform the systems that are trained with a balanced data set. We compared our summarization systems with a baseline system and the average ROUGE scores of all the participating systems of DUC-2006 and DUC-2007. We found that all the supervised systems significantly outperform the baseline system besides considerably beating the average DUC-2006 ROUGE scores (except CRF not beating ROUGE-2 score). On the other hand, MaxEnt outperformed the ROUGE-1 score of average DUC-2007 systems while all other supervised systems perform closely.
From the experiments, it is to be noted that although the supervised models are sharing the same features, the difference in results is coming from the fact that they are being trained by differently annotated data sets. The difference factor is also there because of significant difference in how one supervised model learns from the given data set. In order to improve the overall performance of all of our supervised systems, we think that it is necessary to be more accurate while generating the labeled data. If we can train our systems better, they will perform better while classifying the unseen data set. Therefore, we plan to work on finding more sophisticated approaches to effective automatic labeling so that we can experiment on different supervised methods. We will also evaluate our systems by providing manually annotated data during training. Integer Linear Programming (ILP) has recently attracted much attention in the NLP community. Most of these approaches use ILP to model problems in a more global manner. Capturing the global properties of a problem can improve the accuracy of a model as it is able to represent the long-range dependencies of the problem. So we will apply ILP approaches in order to see how it works for the query-focused multi-document summarization.
Acknowledgments
We thank the anonymous reviewers for their useful comments on the earliest version of this paper. The research reported here was supported by the Natural Sciences and Engineering Research Council (NSERC) of Canada – discovery grant and the University of Lethbridge.