





Non-technical Summary
Birds are active animals, with high and constant body temperatures. Their flight power relies on a high metabolism and a continuous supply of oxygen delivered to their cells. By contrast, crocodiles are generally slow-moving, with variable body temperatures and low metabolism. They can engage in powerful activity when capturing and drowning prey animals, and they can do it without breathing or relying on blood flow to supply oxygen. So, crocodiles can only engage in powerful activity for a short time before becoming exhausted. Because of these traits, birds are described as “warm-blooded” (endothermic), and crocodiles are described as “cold-blooded” (ectothermic). Both birds and crocodiles had a common ancestor approximately 250 million years ago. Once thought to be cold-blooded, this ancestor is now considered to have been more like a bird than a crocodile. This study traces the metabolism of the bird and crocodile lineages by measuring the size of holes in fossil leg bones called nutrient foramens. The holes contained arteries and veins to transport blood in and out of the bone. More active animals require more blood to grow and repair their bones, so they have larger holes. Today, “warm-blooded” birds and mammals have large holes, but “cold-blooded” crocodiles, lizards, and turtles have small ones. Our study of 81 different species of extinct bird and crocodile relatives confirms that the Triassic ancestors of dinosaurs (including birds) and crocodiles had high metabolic rates. Members of both groups were similar until recently, when crocodiles eventually became sit-and-wait predators in water, a lifestyle better suited to low metabolic rate, because they can hold their breath for long periods while waiting for prey and drowning it.
Introduction
Archosaurs were a dominant presence in terrestrial vertebrate communities through most of the Mesozoic (252–66 million years ago) and persist today as roughly 10,000 species of birds (Tobias et al. Reference Tobias, Sheard, Pigot, Devenish, Yang, Sayol and Neate‐Clegg2022) and about 27 species of crocodylians (Grigg and Kirshner Reference Grigg and Kirshner2015). Mesozoic archosaurs filled an extremely diverse range of ecological niches and an enormous range of body size, including the largest terrestrial vertebrate animals known. Paleontologists over the last 50 years have sought to understand the growth rates, metabolic intensities, and thermal relations of extinct archosaurs. Unfortunately, it is difficult to interpret these physiological properties in Mesozoic archosaurs by examining their recent descendants, the birds (Aves) and crocodylians (Crocodylia). Bird-line archosaurs (Avemetatarsalia) experienced a massive reduction in both genetic and ecological diversity at the end of the Cretaceous (Field et al. Reference Field, Bercovici, Berv, Dunn, Fastovsky, Lyson, Vajda and Gauthier2018), which allowed Cenozoic mammals to infiltrate the terrestrial niches they once occupied (Acosta Hospitaleche and Jones Reference Acosta Hospitaleche and Jones2024) and placed constraints on body size and morphology not formerly present in archosaurs (Bhullar et al. Reference Bhullar, Hanson, Fabbri, Pritchard, Bever and Hoffman2016). Extant crocodile-line archosaurs (Pseudosuchia) also do not represent Mesozoic archosaur diversity because, contrasting with the historical diversity of archosaurs, they are roughly similar in body form, style of locomotion, and ecological niches (Grigg and Kirshner Reference Grigg and Kirshner2015). Today, both groups exhibit diametrically different exercise physiologies, with birds relying primarily on sustainable aerobic pathways and crocodylians relying on unsustainable, but powerful, anaerobic pathways.
Birds and crocodylians are often referred to as endotherms and ectotherms, respectively, or in the vernacular, “warm-blooded” and “cold-blooded” animals. However, the definitions of these terms have led to substantial confusion in the past. Some scientists define endothermy in terms of high aerobic metabolic rates (i.e., tachymetabolism). Others define endothermy as an ability to maintain a high and constant body temperature (i.e., thermoregulation). Others conflate the two, sometimes referring to the term “thermometabolism.” Much controversy surrounds the evolution of endothermy, possibly because the evidence used in the arguments focuses on either tachymetabolism or thermoregulation. So it is essential to understand the differences between the two concepts and the likely sequence of evolutionary events. Most hypotheses on the origins of endothermy mainly cluster in the following scenarios: “aerobic capacity first,” “thermoregulation first,” or “correlated progression.”
The aerobic capacity first hypothesis proposes that selection for increasing sustainable locomotion for predation and escape involved rising aerobic metabolic rates (tachymetabolism), which require greater investment of mitochondria in muscle (Bennett and Ruben Reference Bennett and Ruben1979). Heat generated by useful work in the body and inherent mitochondrial inefficiency provided enough energy to raise body temperature significantly, even at rest. This otherwise wasted heat appears in endotherms today as a constant, minimal basal metabolic rate (BMR), and it is used for endothermic thermoregulation by controlling the rate of heat loss through changes in insulation depending on ambient temperature and body size. In this view, the tachymetabolism of a high-performance body is proposed to have evolved before the ability to use otherwise wasted mitochondrial heat. Comparative phylogenetic analyses of the relationship between resting and maximal metabolic rates of extant endotherms and ectotherms support Bennett and Ruben’s aerobic capacity model (Nespolo et al. Reference Nespolo, Solano-Iguaran and Bozinovic2017).
The “thermoregulation first” hypothesis posits that becoming insulated retained metabolic heat and simply raised body temperature, which speeds up biochemical reactions via the van ‘t Hoff effect, thus enhancing power (Crompton et al. Reference Crompton, Taylor and Jagger1978; Clarke and Pörtner Reference Clarke and Pörtner2010). In this scenario, the acquisition of insulation appears initially more important than mitochondrial investment. Large body size of ectothermic dinosaurs is often thought to raise and stabilize body temperature, obviating a need for tachymetabolism and thermoregulation, an effect termed “gigantothermy” (Paladino et al. Reference Paladino, O’Connor and Spotila1990). One criticism of this scenario is that simply warming an ectotherm does not change it into an equivalent endotherm. For instance, maximum total power generation (aerobic plus anaerobic pathways) in a warm, 200 kg estuarine crocodile ( Crocodylus porosus ) is only 14% of that produced by a 200 kg mammal, and the crocodile will fatigue much sooner (Seymour Reference Seymour2013). Mitochondrial investment, not simply elevated body temperature, is the key feature of tachymetabolic endotherms. Another criticism is that an early appearance of insulation on an essentially ectothermic animal would lessen its ability to thermoregulate behaviorally by interfering with the effectiveness of basking (Cowles Reference Cowles1958). This criticism is supported by the absence of insulation in extant ectothermic reptiles, including the most tachymetabolic varanid lizards (Tomańska et al. Reference Tomańska, Stawinoga, Szturo, Styczyńska, Klećkowska-Nawrot, Janeczek, Goździewska-Harłajczuk, Melnyk and Gębarowski2024). The idea of gigantothermy also ignores the fact that all large dinosaurs begin life small.
Finally, the “correlated progression” hypothesis considers both increased mitochondrial investment and insulation occurring in concert (Kemp Reference Kemp2006). It is likely that insulation began to appear at a point when conserving waste metabolic heat began to be more selectively valuable than the ability to gain heat from the sun. This could have happened quickly after attaining tachymetabolism, in view of the homology of insulating scales, hair, and feathers extending to the Early Triassic ancestors of mammals and birds (Benton et al. Reference Benton, Dhouailly, Jiang and McNamara2019). While development of insulation may have synergistically increased the effects of mitochondrial investment, we reiterate that the increased aerobic power generation from mitochondrial investment is the key feature of endothermy.
This study seeks to trace the occurrence of tachymetabolism throughout the two major lineages of archosaurs, the crocodylian lineage (Pseudosuchia) and the dinosaur-avian lineage (Avemetatarsalia), through the size of the nutrient foramina on locomotory long bones that reflect the rates of blood flow through them (Fig. 1). More intense locomotion increases the incidence of microfractures and requires an increased rate of bone remodeling (Varela et al. Reference Varela, Tambusso and Fariña2024) and replacement (Lieberman et al. Reference Lieberman, Pearson, Polk, Demes and Crompton2003; Robling et al. Reference Robling, Castillo and Turner2006). The oxygen consumption involved in remodeling is met by bone perfusion (Bingmann and Wiemann Reference Bingmann and Wiemann2007), and most perfusion in long bones is provided through the nutrient foramen (Trueta Reference Trueta1963).
The evolution of archosauriforms and their relatives over approximately 250 million years resulted in two lineages surviving until today, the crocodylian lineage (Pseudosuchia) and the dinosaurian-avian lineage (Avemetatarsalia) (A). Today alligators and crocodiles (Crocodylia) have low metabolic rates and may bask in the sun, so they are termed “ectotherms,” while birds (Aves) have high metabolic rates and generate heat inside their bodies, so they are called “endotherms.” This study reveals how these two distinct patterns may have evolved from a common ancestor. Because high metabolic rates of an endotherm require high rates of blood flow to the body, their major blood vessels are larger. Some vessels pass through holes (foramina) in bones, thus providing a gauge of vascular size in fossils. One example from the bipedal dinosaur Ornithomimus shows the nutrient foramen on the shaft (B), and this study measures the minor diameter (C) to calculate blood flow rate in the nutrient artery.

Figure 1. Long description
Panel A is a phylogenetic tree spanning 250 million years. From top to bottom, the lineages are Mammalia, Lepidosauria, Testudines, Early archosauriforms, Pseudosuchia (leading to Crocodylia), and Avemetatarsalia. The Avemetatarsalia branch splits into Non-dinosaurian avemetatarsalians and Dinosauria, which further branches into Ornithischia, Sauropodomorpha, and Theropoda (leading to Aves). A geological timeline at the bottom marks the Permian, Triassic, Jurassic, Cretaceous, Paleogene, Neogene, and Quaternary periods.
Panel B is a photograph of a fossilized Ornithomimus femur with a 10 cm scale bar. A small red box on the mid-shaft identifies the location of a nutrient foramen.
Panel C is a close-up inset of the red box from Panel B. It shows an oval-shaped hole in the bone surface, outlined by a red ellipse. A double-headed red arrow measures the minor diameter of this foramen. A scale bar indicates 1 mm.
The foramen technique was first used to gauge perfusion of the cortical bone of the shaft in living mammals and reptiles and in a few extinct dinosaurs (Seymour et al. Reference Seymour, Smith, White, Henderson and Schwarz-Wings2012). It revealed that blood flow rate was higher in mammals and dinosaurs than in extant reptiles, consistent with the hypothesis that aerobic locomotion in endotherms is more intense than in ectotherms. Since 2012, the foramen technique has been used to assess femoral nutrient artery blood flow in fossil synapsids (Newham et al. Reference Newham, Gill, Brewer, Benton, Fernandez, Gostling and Haberthür2020; Knaus et al. Reference Knaus, Van Heteren, Lungmus and Sander2021; Varela et al. Reference Varela, Tambusso and Fariña2024), notosuchians (Sena et al. Reference Sena, Montefeltro, Marinho, Langer, Fachini, Piacentini Pinheiro and Machado2023, Reference Sena, Montefeltro, Marinho, Langer, Fachini, Pinheiro and Machado2025a), ornithodirans (Sena et al. Reference Sena, Voeten, Araújo and Cubo2025b), extinct birds (Allan et al. Reference Allan, Cassey, Snelling, Maloney and Seymour2014; Hu et al. Reference Hu, Miller, Snelling and Seymour2023), extinct kangaroos (Hu et al. Reference Hu, Seymour, Snelling and Wells2024), and during the ontogeny of the hadrosaurid dinosaur, Maiasaura (Seymour et al. Reference Seymour, Caldwell, Woodward and Hu2024). In contrast to histological sampling to determine bone vascularity, the advantages of the foramen technique are that it can provide a measure of bone perfusion without fossil destruction, it is quick and inexpensive, and most importantly, it is quantifiable for comparative studies if the procedures are standardized (Hu et al. Reference Hu, Nelson and Seymour2020). It is also functionally related to the levels of vascularity evident in histological studies of fossil bone (Padian and de Ricqlès Reference Padian and de Ricqlès2020).
The principal aim of this study was to search for foramen-bearing femur bones deep into the Triassic and measure foramen sizes to test the hypothesis that the origin of tachymetabolic endothermy occurred among archosauriforms before the two lineages split.
Second, we wished to determine when pseudosuchians shifted from tachymetabolism to bradymetabolism, helping to explain the profound metabolic distinction between recent crocodylians and birds. This aim stemmed from several lines of evidence that extant crocodylians have anatomical and physiological characteristics indicative of a tachymetabolic evolutionary past, but not presently used in their current bradymetabolic state (Seymour et al. Reference Seymour, Bennett-Stamper, Johnston, Carrier and Grigg2004). These characteristics include complex lungs (Perry Reference Perry1990) with flow-through ventilation (Farmer Reference Farmer2015) and ability to breathe during locomotion (Carrier and Farmer Reference Carrier and Farmer2000; Farmer and Carrier Reference Farmer and Carrier2000). Furthermore, crocodylians are the only reptiles with a completely divided, four-chambered heart potentially capable of high arterial blood pressure and flows necessary for tachymetabolism as in birds and mammals, but now vestigial (Seymour et al. Reference Seymour, Bennett-Stamper, Johnston, Carrier and Grigg2004). Instead, recent crocodylians have evolved a uniquely modified heart capable of shunting blood past the lungs, promoting bradymetabolism and producing low blood pressure. The selective value of the reversion to ectothermy in crocodylians was hypothesized to involve the physiology of sit-and-wait ambush predators in water (Seymour et al. Reference Seymour, Bennett-Stamper, Johnston, Carrier and Grigg2004). This lifestyle is characterized by low aerobic metabolic scope and tolerance to high levels of lactic acid produced anaerobically during intense bouts of activity (Bennett et al. Reference Bennett, Seymour, Bradford and Webb1985). Bradymetabolism at rest allows crocodiles to remain cryptic longer, and near-total reliance on anaerobic metabolism during the short but powerful predation events allows them to remain submerged while drowning prey.
Third, our study sought to differentiate femoral blood perfusion rate between bipedal and quadrupedal archosaurs. The hypothesis is that the locomotory and weight-bearing stresses on the femora of bipeds are greater than those of quadrupeds and require larger bones and greater blood perfusion.
Materials and Methods
Taxon Sampling
Museum collections were surveyed for femora preserving measurable nutrient foramina from archosauriforms, concentrating on early archosaurs. Femoral midshaft circumference (Cf) and total femur length (Lf) were both measured to 1 mm (Supplementary Fig. S1). Because fossils can be deformed or partially preserved, femur volume could not be measured accurately. Instead, the bone volume was estimated as that of a cylinder with a cross-sectional area of the mid-shaft and length Lf. This measure (Vf; cm3) is assumed to be proportional to true bone volume for comparative purposes.
Nutrient Foramina
Primary and secondary nutrient foramina are located on the femoral shaft (diaphysis). Foramina on the metaphysis and epiphysis were not considered. We followed the recommended principles of foramen measurement (Hu et al. Reference Hu, Nelson and Seymour2020). The foramina were photographed perpendicular to the opening when possible, and a millimeter scale bar was placed at the same distance from the lens as the opening. A few foramina were measured with calipers when photography was not possible. Some specimens were part of museum mounts, a few were casts, and many foramina were filled with sediments or preparation material that could not be removed. In total, 217 femora with putative foramina were photographed. Before analysis, photos were judged as to the quality of the image to measure foramen dimensions accurately, resulting in four categories (Supplementary Fig. S2).
Measurements on the images were performed with Fiji (Open Source, www.fiji.sc), using the scale bar as the reference distance. An ellipse was superimposed over the foramen, with the minor diameter over the narrowest dimension of the opening orthogonal to the photographic axis (Fig. 1C). Foramen radius was then considered to be half of the minor diameter. The nutrient vessels usually pass through the surface of the bone at an angle, occasionally steep, which causes the major diameter of the foramen on a photograph to appear much longer than the true diameter of the canal, especially if the hole is filled with matrix. Foramen cross-sectional area was therefore assumed to be the same as that of a circle determined from the minor diameter. This approach may have underestimated the true area to some extent and resulted in slightly lower values than comparable measurements of foramen area from extant mammals, reptiles, and birds (Seymour et al. Reference Seymour, Smith, White, Henderson and Schwarz-Wings2012; Allan et al. Reference Allan, Cassey, Snelling, Maloney and Seymour2014). See Supplementary Text for a critique of methods for measuring foramina.
Blood Flow Rate
Blood flow rate (
$ \dot{\mathrm{Q}} $
 ; ml min−1) in the nutrient artery was calculated from artery lumen radius, assuming that the lumen area occupied 20% of the foramen area as demonstrated in chickens (Hu et al. Reference Hu, Nelson and Seymour2021a). Then,
$ \dot{\mathrm{Q}} $
was calculated with an empirical polynomial equation derived from mammals (Seymour et al. Reference Seymour, Hu, Snelling and White2019).
$ \dot{\mathrm{Q}} $
calculated from femur foramen size agreed with measurements of blood flow rates with microspheres in chickens (Hu et al. Reference Hu, Nelson and Seymour2021b). Details of the assumptions, units, and calculations are provided in the Supplementary Text to help future investigators avoid miscalculation.
Body Mass
Body masses (Mb, kg) of the individual animals associated with the femora were calculated from equations derived from quadrupeds (Campione and Evans Reference Campione and Evans2012) and bipeds (Campione et al. Reference Campione, Evans, Brown and Carrano2014), implemented using the R package MASSTIMATE (Campione Reference Campione2020). The equation for quadrupeds requires measurement of minimum circumference of both femur (Cf) and humerus (Ch), but we did not measure the latter. In these cases, Ch and Mb for the same fossils were obtained from a comprehensive study of archosaur body size (Benson et al. Reference Benson, Hunt, Carrano and Campione2018). The equations and certain modifications of them are more fully described in the Supplementary Text. If juvenile specimens were recognized as markedly smaller individuals compared with known specimens of the same taxon, they were excluded from the analysis, because rapid growth is known to increase bone blood flow rate in archosaurs (Hu et al. Reference Hu, Nelson and Seymour2021b; Seymour et al. Reference Seymour, Caldwell, Woodward and Hu2024). Species were identified as bipeds by significantly disproportionate fore- and hind-limb lengths. Facultative bipeds were treated as bipeds, and if the primary mode of locomotion was in doubt for a specimen, the species was not included in the comparison with quadrupeds.
Non-phylogenetic Statistics
Data for
$ \dot{\mathrm{Q}} $
and Mb from two to five multiple specimens were averaged and treated as a single datum. Selecting only image-quality categories 1 and 2 and eliminating juveniles based on Mb resulted in 81 extinct archosauriforms. (Supplementary Dataset). In addition, we used published data for recent species: mammals (n = 59), varanid lizards (n = 7), and non-varanid reptiles (n = 32) (Seymour et al. Reference Seymour, Smith, White, Henderson and Schwarz-Wings2012). We also used foramen radii and Mb from additional species of notosuchians (n = 7) to contribute more
$ \dot{\mathrm{Q}} $
values to the Pseudosuchia (Sena et al. Reference Sena, Montefeltro, Marinho, Langer, Fachini, Piacentini Pinheiro and Machado2023).
Statistics involve generalized least squares (GLS) linear regression on log10-transformed data to calculate allometric equations to represent the samples. GLS regressions were run without a correlation structure (unless referred to as PGLS, see following section), meaning they are equivalent to ordinary least squares regressions. All error statistics are 95% confidence intervals. Analysis of covariance (ANCOVA) was used to compare the allometric equations in two datasets (Zar Reference Zar1998). If the exponents (b) of the equations are significantly different, then ANCOVA cannot test the scaling factor (a). In such cases, however, the range in which the data in the two groups are significantly different can be evaluated with a Johnson-Neyman (J-N) test (White Reference White2003). Our discussion focuses more on the results from non-phylogenetic statistics, because they have larger sample sizes and allow the J-N tests.
Phylogenetically Informed Statistics
Data for
$ \dot{\mathrm{Q}} $
and Mb were also analyzed with phylogenetic generalized least square (PGLS) regressions to determine the influence of evolutionary relatedness on the resulting allometric equations. The archosauriform dataset for PGLS was smaller than for non-phylogenetic GLS, because 12 specimens with uncertain phylogenetic affinities had to be removed. However, the PGLS dataset was increased by 108 recent birds (Allan et al. Reference Allan, Cassey, Snelling, Maloney and Seymour2014), 21 extinct birds (Hu et al. Reference Hu, Miller, Snelling and Seymour2023), and 18 extinct mammals (Varela et al. Reference Varela, Tambusso and Fariña2024). See Supplementary Material for details of processes and assumptions.
Results
Group-specific, Non-phylogenetic Comparisons
Femoral nutrient artery blood flow rates,
$ \dot{\mathrm{Q}} $
, calculated from foramen minor radius in 81 extinct taxa are compared with new values of
$ \dot{\mathrm{Q}} $
recalculated from foramen area measured in previous studies of extant mammals, non-varanid reptiles, and varanid reptiles (Seymour et al. Reference Seymour, Smith, White, Henderson and Schwarz-Wings2012; Fig. 2). GLS regressions (Fig. 2, solid lines) on log-transformed
$ \dot{\mathrm{Q}} $
(ml min−1) and log-transformed body mass (Mb, kg) yield allometric equations in the form of a power function:
$ \dot{\mathrm{Q}}=a\times {\mathrm{M}}_{\mathrm{b}}^b $
 , where a is the scaling factor (or elevation of the line) and b is the exponent (slope of the line on log axes) (Table 1). The linear equivalent of the allometric exponential equation is log
$ \dot{\mathrm{Q}}=\log a+\left(b\times \log \hskip0ex {\mathrm{M}}_{\mathrm{b}}\right) $
 ), where log a is the intercept and b is the slope.
Rate of blood flow (
$ \dot{\mathrm{Q}} $
; ml min−1) through the nutrient foramen on the shaft of the femur of vertebrate groups in relation to estimated body mass (Mb, kg). Each dot is a separate named genus, species, or indeterminate taxon. Solid lines are generalized least square (GLS) regressions, and their equations and statistics are in Table 1. Dashed lines represent the equations from phylogenetic generalized least square (PGLS) regressions for the same groups (equations provided in Table 3).

Figure 2. Long description
A line graph on a logarithmic scale. The horizontal x-axis represents Body mass from 10 g to 10 tonnes. The vertical y-axis represents Blood flow rate (Q dot) in ml min super minus 1, ranging from 0.0001 to 1000. Four distinct data groups are shown with corresponding silhouettes, regression lines, and equations.
* Extant non-varanid reptiles (blue): Located at the bottom of the plot with the lowest blood flow rates. Data points are blue dots. A solid blue line represents the G L S regression and a dashed blue line represents the P G L S regression. Equation: Q dot equals 0.005 M sub b super 0.67.
* Extant mammals (red): Positioned above the non-varanid reptiles. Data points are red dots. Solid and dashed red lines show a steeper slope than the blue group. Equation: Q dot equals 0.036 M sub b super 0.74.
* Extant varanid reptiles (gold): A smaller cluster of gold dots located between 1 kg and 10 kg. The regression lines are nearly horizontal, indicating a weaker correlation with mass. Equation: Q dot equals 0.088 M sub b super 0.11.
* Extant archosauriforms (black): Located at the top-right, representing the largest body masses and highest flow rates. Data points are black dots. Solid and dashed black lines show a strong linear increase. Equation: Q dot equals 0.086 M sub b super 0.63.
All groups show a general trend where blood flow rate increases as body mass increases, with mammals and archosauriforms maintaining higher flow rates relative to mass than non-varanid reptiles.
Allometric equations relating femur blood flow rate (
$ \dot{\mathrm{Q}} $
, ml min-1) and body mass (Mb, kg) in the form of
$ \dot{\mathrm{Q}} $
= a Mbb, where a is the scaling factor (elevation of the line) and b is the exponent (slope of the line). When
$ \dot{\mathrm{Q}} $
is related to femur cylinder volume (Vf, liter), the equation is
$ \dot{\mathrm{Q}} $
= a Vfb. Statistics are number of taxa (n species, genera, or indeterminate taxa), coefficient of determination (r 2), ANCOVA statistic (F), and probability of the exponent being zero (p). “Archosauriforms” refers to non-avian archosauriforms. “Reptiles” refers to non-archosaur, non-varanid reptiles. ETME, End-Triassic Mass Extinction

Table 1. Long description
The table contains 11 rows of data organized into six columns. The variable Q dot represents femur blood flow rate, M sub b represents body mass, and V sub f represents femur cylinder volume.
* Archosauriforms: n = 81, Q dot = 0.0864 M sub b super 0.63, r super 2 = 0.69, F = 180, p < 0.0001.
* Birds: n = 108, Q dot = 0.0313 M sub b super 0.92, r super 2 = 0.85, F = 606, p < 0.0001.
* Mammals: n = 59, Q dot = 0.0356 M sub b super 0.74, r super 2 = 0.88, F = 435, p < 0.0001.
* Reptiles: n = 32, Q dot = 0.0052 M sub b super 0.67, r super 2 = 0.81, F = 129, p < 0.0001.
* Varanids: n = 8, Q dot = 0.0877 M sub b super 0.11, r super 2 = 0.02, F = 0.108, p = 0.75.
* Pre-E T M E: n = 24, Q dot = 0.0478 M sub b super 0.74, r super 2 = 0.78, F = 99.9, p < 0.0001.
* Post-E T M E: n = 54, Q dot = 0.1616 M sub b super 0.54, r super 2 = 0.57, F = 72.0, p < 0.0001.
* Bipeds (by mass): n = 32, Q dot = 0.0818 M sub b super 0.80, r super 2 = 0.74, F = 186, p < 0.0001.
* Quadrupeds (by mass): n = 46, Q dot = 0.0704 M sub b super 0.59, r super 2 = 0.67, F = 95.2, p < 0.0001.
* Bipeds (by volume): n = 30, Q dot = 7.426 V sub f super 0.78, r super 2 = 0.90, F = 246, p < 0.0001.
* Quadrupeds (by volume): n = 39, Q dot = 3.478 V sub f super 0.52, r super 2 = 0.67, F = 79.0, p < 0.0001.
The ANCOVA reveals that extinct archosauriforms have significantly higher
$ \dot{\mathrm{Q}} $
values than mammals (i.e., higher scaling factor a), but the exponents (b) are not significantly different (Fig. 2, Table 2). The exponent for non-avian archosauriforms is significantly lower than that for birds; however, the J-N test shows that the data for the archosauriforms in our sample are not significantly different from those of birds at Mb > 6.8 kg, which includes most of them. The scaling exponent for extinct archosauriforms is not significantly different from that for non-varanid reptiles, but the regression line is significantly higher (Table 2). Extinct archosauriforms are not significantly different from varanid lizards in either exponent or elevation (Table 2).
Results of analysis of covariance (ANCOVA) and Johnson-Neyman (J-N) test comparing archosauriforms with other groups of extant amniotes. All analyses refer to generalized least squares (GLS) regressions of
$ \dot{\mathrm{Q}} $
(ml min−1) on body mass (Mb, kg) or femur cylindrical volume (Vf, liter). “Archosauriforms” refers to non-avian archosauriforms. “Reptiles” refers to non-archosauriform, non-varanid reptiles. *Archosauriforms are greater than birds below a body mass of 6.8 kg according to the J-N test (White, Reference White2003). †Bipeds are greater than quadrupeds above a body mass of 11.5 kg (J-N test). ‡Bipeds are greater than quadrupeds above a femur volume of 0.34 L (J-N test). ETME, End-Triassic Mass Extinction

Table 2. Long description
The table consists of eight columns: Group 1, Group 2, Exponent F, Exponent p, Exponent Significance (Sig.), Elevation F, Elevation p, and Elevation Significance (Sig.).
* Archosauriforms vs. Mammals: Exponent F 3.23, p 0.075 (N S); Elevation F 5.978, p 0.016 (S).
* Archosauriforms vs. Birds: Exponent F 24.6, p less than 0.001 (S); Elevation is Not valid, Sig. marked with asterisk.
* Archosauriforms vs. Reptiles: Exponent F 0.21, p 0.65 (N S); Elevation F 84.6, p less than 0.001 (S).
* Archosauriforms vs. Varanids: Exponent F 1.93, p 0.17 (N S); Elevation F 1.52, p 0.22 (N S).
* Pre-E T M E vs. Post-E T M E: Exponent F 2.73, p 0.103 (N S); Elevation F 1.70, p 0.20 (N S).
* Bipeds M sub b vs. Quadrupeds M sub b: Exponent F 6.00, p 0.017 (S); Elevation is Not valid, Sig. marked with dagger.
* Bipeds V sub f vs. Quadrupeds V sub f: Exponent F 10.4, p 0.002 (S); Elevation is Not valid, Sig. marked with double dagger.
Group-specific, Phylogenetic Comparisons
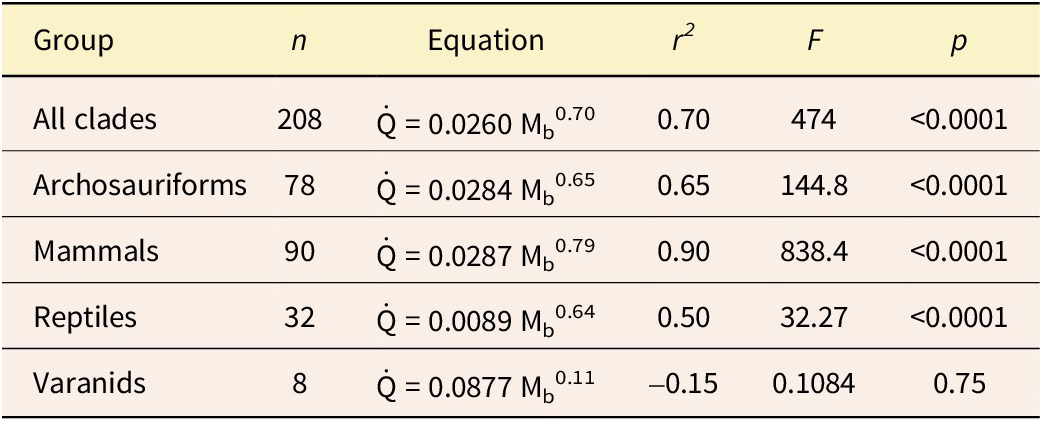
Non-phylogenetic GLS regressions do not account for data being influenced by evolutionary relatedness, so PGLS regressions were carried out on the same groups (Table 3). Dashed lines for PGLS regressions are compared with solid lines for non-phylogenetic GLS regressions (Fig. 2). The PGLS regression for extinct archosauriforms remained higher than that for extant non-varanid reptiles. However, the datasets for non-phylogenetic GLS and PGLS were different. Therefore, further analyses of identical datasets involving both PGLS and non-phylogenetic GLS regressions were carried out (Supplementary Table S2). Exponents and scaling factors were not significantly different in any of the individual clades. The small effects of phylogeny on regressions confirmed the major effect of body size on
$ \dot{\mathrm{Q}} $
. When all clades were considered, however, PGLS resulted in a significantly lower exponent (0.701) than GLS (0.824). Further discussion of this result is in the Supplementary Text.
Phylogenetic generalized least squares (PGLS) regression equations relating femur blood flow rate (
$ \dot{\mathrm{Q}} $
, ml min−1) and body mass (Mb, kg). “Archosauriforms” refers to non-avian archosauriforms. “Reptiles” refers to non-archosaur, non-varanid reptiles

Table 3. Long description
The table contains six columns: Group, n, Equation, r super 2, F, and p.
* All clades: n is 208. Equation is Q dot equals 0.0260 M sub b to the 0.70 power. r super 2 is 0.70. F is 474. p is less than 0.0001.
* Archosauriforms: n is 78. Equation is Q dot equals 0.0284 M sub b to the 0.65 power. r super 2 is 0.65. F is 144.8. p is less than 0.0001.
* Mammals: n is 90. Equation is Q dot equals 0.0287 M sub b to the 0.79 power. r super 2 is 0.90. F is 838.4. p is less than 0.0001.
* Reptiles: n is 32. Equation is Q dot equals 0.0089 M sub b to the 0.64 power. r super 2 is 0.50. F is 32.27. p is less than 0.0001.
* Varanids: n is 8. Equation is Q dot equals 0.0877 M sub b to the 0.11 power. r super 2 is minus 0.15. F is 0.1084. p is 0.75.
Separate groups of archosauriforms are compared with PGLS regressions showing extensive overlap, but variable exponents (Fig. 3, Supplementary Table S2). When GLS residuals of the regression including “All clades” (Fig. 3) are mapped on phylogenetic trees, they inform patterns of metabolic rate (Fig. 4, Supplementary Fig. S4). Positive residuals indicate higher
$ \dot{\mathrm{Q}} $
values and more tachymetabolic animals, whereas negative residuals move toward lower
$ \dot{\mathrm{Q}} $
values and bradymetabolism. Tachymetabolism is widespread across the tree, including ancestrally in the stem-archosaurs and pseudosuchians. Tachymetabolism is present throughout the pseudosuchian lineages, including notosuchians, with a shift to bradymetabolism evident only in crown crocodylians. Within Dinosauria, bradymetabolism is characteristic of some ornithischian dinosaurs, namely ankylosaurs and stegosaurs (Thyreophora), but strong tachymetabolism is present in ornithopods and ceratopsians (Neornithischia). Sauropodomorphs are ancestrally tachymetabolic but shift to bradymetabolic when they become large bodied. Theropods appear to be uniformly tachymetabolic since their origin in the Triassic.
Rate of blood flow (
$ \dot{\mathrm{Q}} $
; ml min−1) through the nutrient foramen on the shaft of the femur of archosauriform groups in relation to estimated body mass (Mb, kg). Each dot is a separate named genus, species, or unidentified taxon. Phylogenetic generalized least square (PGLS) regression equations and lines describe each group (see Supplementary Table S2 for statistics). The dashed black regression line labeled “All clades” represents all data, including mammals and other reptiles not plotted here. It serves as the reference line from which the residuals (the positive and negative differences between a data point and the line) are calculated (Fig. 4).

Figure 3. Long description
A log-log scatter plot with the X axis representing Body mass from 10 g to 10 tonnes and the Y axis representing Blood flow rate (Q dot) from 0.0001 to 1000 ml min super minus 1. A dashed black line labeled All clades runs diagonally from the bottom-left to the top-right, serving as a reference.
Five specific clades are highlighted with colored silhouettes, data points, and P G L S regression lines:
* Crown Birds: Brown dots and line at the lower mass range (10 g to 1 kg). Equation: Q dot equals 0.037 M sub b super 0.84.
* Ornithischia: Blue dots and line in the mid-mass range (1 kg to 100 kg). Equation: Q dot equals 0.194 M sub b super 0.49.
* Non-dinosaurian avemetatarsalians: Purple dots and line (1 kg to 100 kg). Equation: Q dot equals 0.019 M sub b super 0.74.
* Pseudosuchia: Green dots and line (10 kg to 1 tonne). Equation: Q dot equals 0.024 M sub b super 0.74.
* Sauropodomorpha: Black dots and line (100 kg to 10 tonnes). Equation: Q dot equals 0.076 M sub b super 0.65.
* Theropoda: Red dots and line (10 kg to 10 tonnes). Equation: Q dot equals 0.014 M sub b super 0.92.
All regression lines show a positive linear trend on the log-log scale, indicating that blood flow rate increases as body mass increases.
Reduced time-calibrated phylogenetic tree of major groups of archosauriforms and their relatives. Branches with warm (red) colors indicate positive
$ \dot{\mathrm{Q}} $
residuals, and branches with cold (blue) colors indicate negative residuals, from the overall regression line (“All clades” line in Fig. 3). These colors imply degrees of tachymetabolism and bradymetabolism, respectively. Note the prevalence of tachymetabolism in the Triassic, leading to numerous taxa in both Pseudosuchia and Avemetatarsalia. Complete reversal from tachymetabolism to bradymetabolism is evident in extant Crocodylus species. Multiple reversals occur among later sauropodomorphs and some armored dinosaurs. An expanded tree is available in Supplementary Fig. S4.

Figure 4. Long description
A phylogenetic tree with a horizontal time axis at the bottom spanning from 250 million years ago to the present. The axis is divided into the Triassic (purple), Jurassic (blue), Cretaceous (green), Paleogene (orange), Neogene (yellow), and Quaternary (thin yellow strip).
A color scale for Residual Q dot ranges from negative 1.89 (dark blue) to positive 1.3 (dark red), representing bradymetabolism and tachymetabolism respectively.
Major clades are organized vertically from top to bottom:
* Pseudosuchia: Features many red branches in the Triassic, transitioning to blue for extant Crocodylus species in the Quaternary.
* Non-dinosaurian avemetatarsalians: Small group with red and pink branches.
* Ornithischia: Shows a mix of red branches (e.g., Hypsilophodontidae) and blue branches (e.g., Stegosauria and some Ankylosauria).
* Sauropodomorpha: Displays a transition from red Triassic ancestors to light blue and grey branches in later sauropods like Diplodocus.
* Theropoda: Predominantly red and dark red branches extending from the Triassic through the Cretaceous, terminating in Aves (birds).
Silhouettes of representative animals are placed to the right of each major clade: a crocodile-like archosaur for Pseudosuchia, a small bipedal reptile for non-dinosaurian avemetatarsalians, an armored dinosaur for Ornithischia, a long-necked sauropod for Sauropodomorpha, and a large theropod for Theropoda.
Comparisons across the End-Triassic Mass Extinction (ETME)
There is no apparent difference in
$ \dot{\mathrm{Q}} $
between archosauriforms before and after the ETME (Fig. 5, Table 2).
Rate of nutrient foramen blood flow (
$ \dot{\mathrm{Q}} $
; ml min−1) in relation to estimated body mass (Mb, kg) of archosaurs before and after the End-Triassic Mass Extinction (ETME). Equations for the generalized least square (GLS) regressions are in Table 1. There are no significant differences in exponent and elevation of the data according to analysis of covariance (ANCOVA) (Table 2).

Figure 5. Long description
A line graph on a logarithmic scale for both axes. The horizontal x-axis represents Body mass with major tick marks at 1 kg, 10 kg, 100 kg, 1 tonne, and 10 tonnes. The vertical y-axis represents Blood flow rate in m l min super minus 1 with major tick marks at 0.01, 0.1, 1, 10, 100, and 1000.
Two datasets are plotted:
* Pre E T M E: Represented by red circular data points and a red regression line. The data points range from approximately 1 kg to 2 tonnes. The regression equation is Q dot equals 0.0478 M sub b super 0.74.
* Post E T M E: Represented by black circular data points and a black regression line. The data points range from approximately 1 kg to over 10 tonnes. The regression equation is Q dot equals 0.1616 M sub b super 0.54.
Both datasets show a positive linear increase on the log-log scale. The red line starts lower than the black line at 1 kg but has a steeper slope, eventually intersecting the black line near the 1 tonne mark. The black data points are more numerous and extend further into the higher body mass range.
Comparisons among Pseudosuchians
There are apparent differences in
$ \dot{\mathrm{Q}} $
among the representatives of the pseudosuchian lineage (Fig. 6). The allometric equation for
$ \dot{\mathrm{Q}} $
of all 24 taxa of extinct pseudosuchians (including those recalculated from Sena et al. [Reference Sena, Montefeltro, Marinho, Langer, Fachini, Piacentini Pinheiro and Machado2023]) is
$ \dot{\mathrm{Q}} $
= 0.059 Mb0.69 (R 2 = 0.64), which indicates tachymetabolic rates, as it is significantly higher than means for extant bradymetabolic Crocodylus porosus (n = 4) and Crocodylus johnstoni (n = 4) (ANCOVA: exponent F = 0.04, p = 0.84; elevation F = 4.81, p = 0.039) (Fig. 6).
Rate of nutrient foramen blood flow (
$ \dot{\mathrm{Q}} $
; ml min−1) in relation to estimated body mass (Mb, kg) among pseudosuchians from the Triassic (red) and post-Triassic (blue). Notosuchians from the Late Cretaceous (black) include Notosuchus from this study and the others recalculated from foramen size in the supplementary tables of another study (Sena et al. Reference Sena, Montefeltro, Marinho, Langer, Fachini, Piacentini Pinheiro and Machado2023). There is no significant difference between the groups, but all 24 extinct pseudosuchians have values significantly higher than those of the extant crocodylians, represented here (green) by the means from Crocodylus porosus (n = 4) and Crocodylus johnstoni (n = 4) (Seymour et al. Reference Seymour, Smith, White, Henderson and Schwarz-Wings2012).

Figure 6. Long description
A line graph with logarithmic scales on both axes. The horizontal x-axis represents Body mass in k g, ranging from 1 to 1000. The vertical y-axis represents Blood flow rate in m l min super minus 1, ranging from 0.01 to 10.
Four distinct data series with corresponding regression lines are shown:
* Black points and line: Late Cretaceous Notosuchians. This group sits highest on the y-axis for their mass, including species like Notosuchus, Coronelsuchus, and Pissarrachampsa. The trend shows a steep linear increase.
* Red points and line: Triassic pseudosuchians, including Hesperosuchus, Tarjadia, and Lotosaurus. This line is positioned below the black line but above the green line.
* Light blue points and line: Post-Triassic pseudosuchians, including Alligator, Bottosaurus, and various Crocodylomorpha indet. This group shows the widest range of body mass and follows a linear trend similar in slope to the red group.
* Green points and line: Extant crocodylians, represented by Crocodylus johnsoni at the lower end and Crocodylus porosus at the higher end. This line is the lowest on the graph, indicating significantly lower blood flow rates relative to body mass compared to the extinct groups.
Individual labels are placed next to specific data points across the plot area.
Bipeds versus Quadrupeds
These data for extinct archosauriforms are separated into bipedal and quadrupedal locomotor modes (Fig. 7). The ANCOVA reveals significantly different GLS allometric equations for the two modes, with a significantly higher exponent in the bipeds (b = 0.80) than in the quadrupeds (b = 0.58) (Table 2). Because the exponents are significantly different, the J-N test indicates that
$ \dot{\mathrm{Q}} $
is significantly greater in the bipeds than the quadrupeds at body masses exceeding 11.5 kg, which includes most of them.
Rate of nutrient artery blood flow (
$ \dot{\mathrm{Q}} $
; ml min−1) in relation to body mass (Mb, kg) in quadrupedal (red) and bipedal (blue) archosaurs. Equations for the generalized least square (GLS) regressions are in Table 1. The exponents are significantly different according to analysis of covariance (ANCOVA) (Table 2). The Johnson-Neyman (J-N) analysis shows that data for bipeds are significantly higher than those for quadrupeds if body mass is greater than 11.5 kg.

Figure 7. Long description
The line graph uses logarithmic scales for both axes. The horizontal X-axis represents Body mass with major tick marks at 1 kg, 10 kg, 100 kg, 1 tonne, and 10 tonnes. The vertical Y-axis represents Blood flow rate (Q dot) in ml min super minus 1, with major tick marks at 0.01, 0.1, 1, 10, 100, and 1000.
Two data series are plotted:
* Bipeds are represented by light blue dots and a light blue regression line. The equation Q dot = 0.0818 M sub b super 0.80 is positioned near the top right of the line.
* Quadrupeds are represented by dark red dots and a dark red regression line. The equation Q dot = 0.0704 M sub b super 0.59 is positioned near the top right of the line.
Both groups show a positive linear correlation on the log-log scale, but the bipedal line has a steeper slope and higher values than the quadrupedal line as mass increases. A horizontal bracket labeled ‘zone of significant difference’ spans the X-axis from approximately 11.5 kg to the right edge of the graph, indicating where the two groups differ significantly.
The
$ \dot{\mathrm{Q}} $
difference between bipeds and quadrupeds is reflected in the relationships between
$ \dot{\mathrm{Q}} $
and an indirect measure of femur volume (Vf = midshaft cross-sectional area × length) (Fig. 8). The ANCOVA indicates that the exponent for bipeds (0.78) is significantly higher than that for quadrupeds (0.52), and the J-N test reveals that the data for bipeds are significantly above those for quadrupeds if Vf is greater than 0.34 liters (Table 2).
Rate of nutrient artery blood flow (
$ \dot{\mathrm{Q}} $
; ml min−1) in relation to nominal femur volume (Vf; liters calculated as a cylinder from midshaft circumference and length) in quadrupedal (red) and bipedal (blue) archosauriforms. Equations for the generalized least square (GLS) regressions are in Table 1. The exponents are significantly different according to analysis of covariance (ANCOVA) (Table 2). The Johnson-Neyman (J-N) analysis shows that data for bipeds are significantly higher than those for quadrupeds if femur volume is greater than 0.34 liters.

Figure 8. Long description
A line graph on a logarithmic scale for both axes.
* The horizontal X axis is labeled Bone cylinder volume (liter) with values ranging from 0.001 to 100.
* The vertical Y axis is labeled Blood flow rate (ml min super minus 1) with values ranging from 0.01 to 1000.
Data Trends:
* Bipeds are represented by light blue dots and a light blue regression line. The line follows the equation Q dot equals 7.426 V sub f super 0.78. The data points show a steep linear increase across the volume range.
* Quadrupeds are represented by dark red dots and a dark red regression line. The line follows the equation Q dot equals 3.478 V sub f super 0.52. This line has a shallower slope than the bipedal line.
Spatial Annotations:
* The two regression lines intersect at approximately 0.01 liters. Below this point, the quadrupedal line is slightly higher. Above this point, the bipedal line rises significantly faster.
* A horizontal bracket labeled zone of significant difference starts at 0.34 liters on the X axis and extends to the right edge of the graph, indicating where bipedal blood flow is significantly higher than quadrupedal flow.
* The labels for Bipeds and Quadrupeds with their respective equations are located in the top right quadrant of the plot area.
Discussion
High Long Bone Perfusion Rates Indicate Widespread Tachymetabolism in Archosauriforms
We recover high levels of bone perfusion throughout Pseudosuchia and Avemetatarsalia, consistent with tachymetabolic endothermy throughout the Mesozoic. Femur perfusion in extinct archosauriforms is significantly higher than in mammals of the same body size, significantly higher than in extant non-varanid reptiles, but not significantly different from larger extant birds and extant varanid reptiles (Fig. 2, Table 2). These conclusions are similar to those of the seminal study that used the foramen technique (Seymour et al. Reference Seymour, Smith, White, Henderson and Schwarz-Wings2012), but our results are more robust, because they are based on greatly increased sample size and time span. We also report blood flow rate (
$ \dot{\mathrm{Q}} $
), which is a more appropriate and accurate measure of blood flow than the blood flow index (Qi) used formerly (Seymour et al. Reference Seymour, Hu, Snelling and White2019).
PGLS of
$ \dot{\mathrm{Q}} $
data for archosauriform clades, including crown birds (Fig. 3), reveals similar patterns as GLS regressions (Fig. 2). This result supports the hypothesis of a functional connection between blood flow rate, level of metabolism and body size, independent of phylogenetic relatedness. When superimposed on the phylogenetic tree, the data reveal widespread tachymetabolism in both lineages of archosaurs (Fig. 4).
The Evolution of Tachymetabolism in Both Archosaurian Lineages
The Triassic appears to be a period during which many groups of tachymetabolic taxa flourished, with gracile, cursorial body forms, indicative of sustained, aerobic exercise appearing among members of both the crocodylian lineage (Pseudosuchia) and the dinosaur-bird lineage (Avemetatarsalia). Our data show consistent tachymetabolism among archosauriforms during this period (Fig. 4). Further evidence for metabolic status of the Triassic stem-archosaurs and pseudosuchians included in our study (i.e., bone histology, systemic arterial blood pressure, locomotion energetics, paleothermometry, and nasal turbinates) is presented in the Supplementary Text. Similar evidence for widespread tachymetabolism among the archosaurs and their relatives is presented in Grigg et al. (Reference Grigg, Nowack, Bicudo, Bal, Woodward and Seymour2022).
One of the goals of the present study was to determine the timing of reversion from tachymetabolism to bradymetabolism in the Pseudosuchia. The anatomy and physiology of extant bradymetabolic crocodylians exhibit several lines of evidence of a tachymetabolic ancestry. These include the embryological development of the four-chambered heart, its loss of potential for delivering large amounts of blood at a high systemic pressure (Seymour et al. Reference Seymour, Bennett-Stamper, Johnston, Carrier and Grigg2004), a complex structure of the lung including flow-through ventilation that is no longer effectively used (Farmer and Sanders Reference Farmer and Sanders2010), and a suite of characteristics associated with the ability to breathe during locomotion (Carrier Reference Carrier1987a). Bradymetabolism and a high capacity for anaerobic metabolism are clearly adaptive for extant crocodylians, allowing them to hold their breath under water for long periods (Seymour et al. Reference Seymour, Bennett-Stamper, Johnston, Carrier and Grigg2004). The existence of endothermic birds and ectothermic crocodylians today provides unequivocal evidence for this separation, but the timing of the shift, or shifts, from tachymetabolism to bradymetabolism is not clear.
The present study shows that
$ \dot{\mathrm{Q}} $
values do not change across the ETME either in archosauriforms in general (Fig. 5) or among pseudosuchians in particular. However, all data from extinct pseudosuchians are significantly higher than those of extant Crocodylus species (Fig. 6). This difference suggests that the loss of tachymetabolism, possibly accompanying the shift to a sit-and-wait lifestyle, may have occurred more recently than previously assumed. Members of the Crocodylomorpha have shifted between terrestrial, freshwater, and marine habitat many times throughout their evolutionary history (Wilberg et al. Reference Wilberg, Turner and Brochu2019), so the shift to bradymetabolic behavior could have occurred at any time. One crocodylomorph, as known from the ichnogenus Batrachopus, is estimated to have been 3 m long and about 100 kg, and it made bipedal trackways in Cretaceous sediments of Korea (Kim et al. Reference Kim, Lockley, Lim, Bae and Romilio2020). Bipedal locomotion in an animal this large is consistent with endothermic tachymetabolism (Pontzer et al. Reference Pontzer, Allen and Hutchinson2009). Despite this exception, Jurassic and Cretaceous pseudosuchians with crocodile-like body forms are generally considered to have had crocodile-like behavior and physiology. In particular, Neosuchia, a clade arising in the mid-Jurassic and extending to extant crocodylians, is characterized by the horizontal crocodylian body form, and most of them are presumed to have been semi-aquatic, sit-and-wait predators, like extant bradymetabolic crocodylians (Ristevski et al. Reference Ristevski, Young, De Andrade and Hastings2018). However, mental images of recent crocodylians may have influenced the reconstruction of fossil bones.
Among our pseudosuchian samples is the goniopholidid mesoeucrocodylian Amphicotylus from the Late Jurassic of North America. The
$ \dot{\mathrm{Q}} $
value of Amphicotylus indicates a high level of tachymetabolism, near the levels in Triassic archosauriforms (Fig. 6).
$ \dot{\mathrm{Q}} $
in other extinct crocodylomorphs with crocodylian body plans (Bottosaurus, Thoracosaurus, Hyposaurus, and another eight indeterminate crocodylomorphs) are not significantly different from Triassic pseudosuchians (Fig. 6) or, indeed, from mammals (Fig. 2). By contrast, the European goniopholidid Goniopholis is considered to be ectothermic, based on bone histology (primary osteon area and estimated red blood cell size) and isotopic thermometry (Faure-Brac et al. Reference Faure-Brac, Amiot, Muizon, Cubo and Lécuyer2022). Reduced bone growth rate in pseudosuchians near the end of the Triassic has been proposed to represent the end of high metabolic rates in the entire lineage, despite the presence of highly vascularized bone, which is otherwise consistent with tachymetabolism (Botha et al. Reference Botha, Weiss, Dollman, Barrett, Benson and Choiniere2023). Decreasing bone growth rate (i.e., slowing of periosteal apposition) during ontogeny appears to be universal in both ectothermic and endothermic archosauriforms, because they exhibit determinate growth (Frýdlová et al. Reference Frýdlová, Mrzílková, Šeremeta, Křemen, Dudák, Žemlička, Minnich, Kverková, Němec, Zach and Frynta2020).
The clade Notosuchia is another large group of post-ETME crocodyliform pseudosuchians that arose in the Middle Jurassic and lasted until the Miocene, occupying mainly terrestrial habitats (Dal Sasso et al. Reference Dal Sasso, Pasini, Fleury and Maganuco2017; Viñola López et al. Reference Viñola López, Velez-Juarbe, Münch, Milan, Antoine, Marivaux, Jimenez-Vasquez and Bloch2025). Some notosuchians were gracile, cursorial predators; others were more sedentary, heavily armored herbivores; and some ventured into water. Our survey included only one species, Notosuchus terrestris, but it joins nutrient foramen size data from seven other genera of notosuchians (Sena et al. Reference Sena, Montefeltro, Marinho, Langer, Fachini, Pinheiro and Machado2025a) and produces a range of
$ \dot{\mathrm{Q}} $
values that are consistent with mammalian-grade tachymetabolism and higher than almost all other pseudosuchians (Fig. 6). However, Sena et al. (Reference Sena, Montefeltro, Marinho, Langer, Fachini, Pinheiro and Machado2025a) transformed absolute
$ \dot{\mathrm{Q}} $
values into data for maximum metabolic rate (MMR) by way of phylogenetic eigenvector maps (PEM) (Guénard et al. Reference Guénard, Legendre and Peres-Neto2013), yielding MMR values in notosuchians that are less than 10% of those of mammals and less than 30% of those of varanid lizards, thereby inferring profound ectothermy. It is unclear how notosuchian
$ \dot{\mathrm{Q}} $
values that are the same or higher than those in mammals of the same body size can result in a conclusion that notosuchians were ectotherms (see Supplementary Text for further references and discussion of notosuchians).
Effects of Locomotory Style on Femur Perfusion
The scaling of
$ \dot{\mathrm{Q}} $
on body mass reveals the effects of locomotory style, with higher blood flow rates in bipeds than in quadrupeds (Fig. 7, Table 2). The exponent is higher in bipeds than in quadrupeds, but the J-N test shows that the bipeds’ individual data are significantly higher than those of quadrupeds at body masses greater than 11.5 kg. This mass is close to the theoretical threshold above which the energy cost of bipedal locomotion requires endothermic tachymetabolism (Pontzer et al. Reference Pontzer, Allen and Hutchinson2009). The explanation for this difference is primarily that bipeds place locomotory and weight-bearing stresses on two legs, whereas quadrupeds distribute weight across four. The femora of bipeds therefore have more bone tissue than those of quadrupeds of similar body mass (Campione et al. Reference Campione, Evans, Brown and Carrano2014) and logically demand greater perfusion. This correlation is supported in extinct archosaurs by similar patterns of scaling of
$ \dot{\mathrm{Q}} $
against Mb (Fig. 7) and against femur cylinder volume, Vf (Fig. 8). Apparently, the metabolic intensity of a given volume of bone is higher in bipeds than quadrupeds, possibly related to greater bone stresses in locomotion, incidence of microfractures, and bone remodeling in bipeds.
All theropods and many ornithopods intensified tachymetabolism associated with their bipedality after the ETME (Fig. 7). In contrast, quadrupedal avemetatarsalians, including several thyreophorans, ceratopsians, and sauropods, generally exhibit lower metabolic rates (Fig. 4). It may be significant that most of these quadrupeds were well-armored, relying on passive defense and possibly stealth, rather than running escape (Hayashi et al. Reference Hayashi, Carpenter, Scheyer, Watabe and Suzuki2010; Brown et al. Reference Brown, Henderson, Vinther, Fletcher, Sistiaga, Herrera and Summons2017). Uniformly low
$ \dot{\mathrm{Q}} $
values among late sauropods may be associated with low metabolic rates, inherently slow locomotion, and protection simply by being large.
The steeper exponent of the regressions of
$ \dot{\mathrm{Q}} $
on Mb for crown birds than for non-avian archosauriforms (Fig 3, Table 1, Supplementary Table S2) may be related to the fact that smaller birds are primarily volant (relying more on wings than on legs), pushing the data from smaller birds down. Larger birds tend to be primarily cursorial (relying on legs more than wings), with the largest being flightless, pushing the larger data up. A phylogenetically informed analysis (PGLS) of 100 bird species showed significantly higher Qi in primarily cursorial species than in primarily volant ones (Allan et al. Reference Allan, Cassey, Snelling, Maloney and Seymour2014). The same study showed that femoral perfusion in cursorial birds is approximately two times higher than in quadrupedal mammals of the same Mb. The significantly higher femoral
$ \dot{\mathrm{Q}} $
in extinct archosauriforms than in mammals may be related to a higher concentration of obligate and facultative bipeds (40%) among archosauriforms compared with extant mammals (24%). Therefore, high
$ \dot{\mathrm{Q}} $
may translate better to overall metabolic rate of the bone than it does to metabolic rate of the whole animal.
Tachymetabolism and Thermoregulation
Our results indicate that archosauriforms were capable of sustained aerobic energy production for intense locomotion. This tachymetabolism involves a suite of correlated physiological variables, that is, relatively high investment of mitochondria in the body, high resting and active metabolic rates, high maximum aerobic power production, and an increased capacity of the cardiovascular and respiratory systems to deliver oxygen (Grigg et al. Reference Grigg, Nowack, Bicudo, Bal, Woodward and Seymour2022).
However, our results do not directly address the physiological ability to regulate body temperature independently from ambient temperature. It is possible for an animal to possess an aerobic exercise physiology without temperature regulation. For example, varanid and teiid lizards are exceptional among extant reptiles in several ways related to their relatively high aerobic capacity. The physiology of varanids led James Hopson to say they were “the most mammal-like of lizards” (Hopson Reference Hopson2012: p. 133). Varanids show a highly efficient, widely ranging, sustained mode of foraging, in contrast to other lizards that are sedentary, sit-and-wait predators largely reliant on anaerobic energy used in short bursts (Christian and Conley Reference Christian and Conley1994). Although varanids show similar resting metabolic rates as other lizards, they have considerably higher maximum metabolic rates. Their maximum aerobic metabolic rates well exceed the resting metabolic rates of mammals (Clemente et al. Reference Clemente, Withers and Thompson2009), and small varanids can exceed half of the maximum aerobic metabolic rate of similarly sized mammals (Taylor et al. Reference Taylor, Maloiy, Weibel, Langman, Kamau, Seeherman and Heglund1981; Thompson and Withers Reference Thompson and Withers1997).
Coupled with this high aerobic capacity, varanids show complex lung structure and unidirectional air flow (Schachner et al. Reference Schachner, Cieri, Butler and Farmer2014), an ability to breathe during locomotion up to the maximum aerobic speed (Carrier Reference Carrier1987b), and a heart that separates arterial and venous blood more effectively and produces higher systemic blood pressures than in other reptiles (Burggren and Johansen Reference Burggren and Johansen1982). These characteristics result in faster flow rates and greater oxygen delivery, both supporting higher aerobic capacity. Importantly, varanids and teiids are the only extant lizards known to have vascular cortical bone among the larger species, a characteristic of endotherms (de Buffrénil et al. Reference de Buffrénil, Houssaye and Böhme2008). Moreover, Varanus exanthematicus grows at rates equivalent to those of endotherms, and, like endotherms, their long bones reveal secondary remodeling in response to exercise (Owerkowicz and Crompton Reference Owerkowicz and Crompton1997). Finally, high metabolic rates are indicated by overlapping femoral bone perfusion, measured as
$ \dot{\mathrm{Q}} $
, in varanids and Mesozoic archosauriforms (Fig. 2).
Despite evidence for tachymetabolism reaching mammalian levels of BMR, varanids do not use the heat generated by activity or digestion for temperature regulation (Bennett et al. Reference Bennett, Hicks and Cullum2000). Teiid lizards have similar lifestyles to varanids, and one species, Salvator merianae, can raise its body surface temperature approximately 6°C above ambient temperature in burrows during the reproductive season (Tattersall et al. Reference Tattersall, Leite, Sanders, Cadena, Andrade, Abe and Milsom2016).
Although varanids indicate that it is possible that the evolution of tachymetabolism and thermoregulation may have occurred asynchronously, they are clearly exceptions to the dichotomous framework for strategies involving metabolic rates (tachymetabolism vs. bradymetabolism) linked with temperature regulation (endothermy vs. ectothermy). Paleontological evidence has led most authors to place extinct species into one state or the other.
In a competitive environment, there are increasing selective pressures to find resources or mates or to avoid predators. The history of tetrapods is clearly one of increasing levels of aerobic activity to carry out these functions. It is possible that the early stages of archosauromorph evolution were characterized by increasing aerobic activity metabolism with a varanid-like physiology, but which ultimately led to the evolution of temperature regulation according to the aerobic capacity hypothesis (Bennett and Ruben Reference Bennett and Ruben1979). Tachymetabolic endothermy provides the heat source upon which early sauropsids and synapsids could have evolved physiological thermoregulatory endothermy, leading to homeothermy. The addition of this ability to maintain a high and stable body temperature in cold environments resulted in the widespread success of birds and mammals today.
Early archosauriforms already possessed a biochemical and genetic “toolbox” preadapted for developing temperature regulation upon the heat supply available in inherent tachymetabolism. The ancestral elements for control of heat production include shivering and non-shivering thermogenesis (NST) in muscle and in brown adipose tissue. NST is based on controlled “slippage” of Ca2+ from the sarcoplasmic reticulum Ca2+-ATPase (SERCA) in skeletal muscle (Nowack et al. Reference Nowack, Giroud, Arnold and Ruf2017; Bal and Periasamy Reference Bal and Periasamy2020). Evidence for NST pathways in recent fish and reptiles suggests that the biochemical machinery for NST existed before amniotes evolved (Grigg et al. Reference Grigg, Nowack, Bicudo, Bal, Woodward and Seymour2022). The dermal precursors of insulation in the form of fur and feathers are known to have existed before the first archosaurian feathers appear in Middle Jurassic fossils (Benton et al. Reference Benton, Dhouailly, Jiang and McNamara2019; Dhouailly et al. Reference Dhouailly, Godefroit, Martin, Nonchev, Caraguel and Oftedal2019). Thus, the toolbox would promote the correlated progression hypothesis for the evolution of endothermy.
Up to now, however, we have no evidence for physiological thermoregulation per se in archosaurs before the Middle Jurassic. Several isotopic analyses revealing body temperatures between about 35°C and 44°C are limited to archosaurs after the Middle Jurassic (Grigg et al. Reference Grigg, Nowack, Bicudo, Bal, Woodward and Seymour2022). Functional equivalents of nasal turbinates, shown to be advantageous in endotherms for reclaiming heat and water, are present in Cretaceous ankylosaurs (Bourke et al. Reference Bourke, Porter and Witmer2018). Unequivocal evidence of a brooding archosaur, which is indicative of parental thermoregulation, comes from Late Cretaceous oviraptorosaurian theropods (Norell et al. Reference Norell, Clark, Chiappe and Dashzeveg1995). Isotopic thermometry indicates that the incubation temperatures of eggs were between 30°C and 40°C, close to theropod body temperature (Amiot et al. Reference Amiot, Wang, Wang, Lécuyer, Mazin, Mo and Flandrois2017; Bi et al. Reference Bi, Amiot, de Fabrègues, Pittman, Lamanna, Yu and Yu2021). Nevertheless, the nearly universal association between tachymetabolism and temperature regulation in extant endotherms is reason to apply the aphorism “Absence of evidence is not evidence of absence” and search for earlier evidence for thermoregulation.
Acknowledgments
This research was funded by the Australian Research Council (grant no. DP 170104952) to R.S.S. We thank A. Millhouse (Smithsonian National Museum of Natural History, Washington, D.C.), M. Norell and C. Mehling (American Museum of Natural History, New York), and M. Lamanna and A. Henrici (Carnegie Museum of Natural History, Pittsburgh) for access to their collections. D. Henderson (Royal Tyrrell Museum of Palaeontology, Drumheller, Alberta), R. Allain (Muséum National d’Histoire Naturelle, Paris), C. Sullivan (University of Alberta, Edmonton), I. Meyer (University of the Witwatersrand, South Africa), and H. R. Caldwell (Montana State University, Bozeman) kindly provided photographs and measurements of specimens. We appreciate the comments of the referees.
Author Contribution
R.S.S., C.V.M.: organization of the project, primary analysis of the data and initial drafting of the manuscript. C.V.M., R.S.S., M.D.E., S.J.N., M.E.H.J., S.C.R.M., D.S.: searching museums for foramina and supplying photographs. Q.H.: validating foramen analysis. N.E.C.: calculating body masses. C.V.M.: phylogenetic analyses. R.S.S., C.V.M., Q.H., M.D.E., S.J.N., M.E.H.J., S.C.R.M., D.S., E.W.W., N.E.C., G.G.: providing pertinent references and editing versions of the manuscript.
Competing Interests
Authors declare no competing interests.
Data Availability Statement
Data available from the Zenodo Digital Repository under the following doi numbers: Species Dataset, https://doi.org/10.5281/zenodo.20320734; Supplementary Text, https://doi.org/10.5281/zenodo.20437601; Supplementary Figures, https://doi.org/10.5281/zenodo.20389711; Supplementary Tables, https://doi.org/10.5281/zenodo.20389551; Enlarged Supplementary Fig. S4, https://doi.org/10.5281/zenodo.20389339; phylogenetic analysis data and R codes, https://doi.org/10.5281/zenodo.20437709 and https://doi.org/10.5281/zenodo.20403801.




 Open access

