





Non-technical Summary
Pterosaurs were flying reptiles that lived alongside dinosaurs and were the first vertebrates to achieve powered flight. How they produced and regulated the heat and energy needed for this lifestyle has been debated for decades, with proposals ranging from reptile-like “cold-blooded” physiology to bird-like “warm-blooded” systems. In this study, bones of the pterosaur Caiuajara dobruskii from both juvenile and adult individuals were examined under the microscope. The analysis focused on tiny cavities in the bone that once housed bone cells. The density of these spaces can be used to estimate how rapidly an animal grows, consumes oxygen and, therefore, its metabolic intensity. The results show that Caiuajara probably had higher metabolic rates than those of most living reptiles, but not as extreme as those of typical mammals and birds, placing it in an intermediate metabolic continuum. Despite this intermediate metabolism, Caiuajara could sustain energetically demanding behaviors, including powered flight, while maintaining a level of internal heat production greater than that of most modern reptiles, though not as intense as in small warm-blooded animals.
Introduction
Thermometabolism is a key dimension of vertebrate evolution, fundamentally shaping physiology, ecology, life history, and the range of achievable metabolic rates (Pettersen et al. Reference Pettersen, White and Marshall2016). Within amniotes, two main thermogenetic regimes are recognized: endothermy and ectothermy, which differ markedly in both resting and maximal metabolic levels.
Although all animals generate internal metabolic heat, endothermy is defined as relying primarily on this internal heat to maintain stable elevated body temperatures (McNab Reference McNab2002), often including non-shivering thermogenesis. On the other hand, ectothermy relies predominantly on environmental heat gained via behavioral and microhabitat adjustments (Clarke and Pörtner Reference Clarke and Pörtner2010; Rowland et al. Reference Rowland, Bal and Periasamy2015; Faure-Brac et al. Reference Faure-Brac, Amiot, de Muizon, Cubo and Lécuyer2022). Consequently, endotherms typically maintain higher and more stable body temperatures and exhibit higher resting and maximum metabolic rates (i.e., oxygen consumption in ml O2 h−1) compared with ectotherms (Clarke and Pörtner Reference Clarke and Pörtner2010; Faure-Brac et al. Reference Faure-Brac, Woodward, Aubier and Cubo2024).
Extant birds and mammals, the only living endothermic amniotes, are crown representatives of Sauropsida and Synapsida, respectively, having diverged from a common ancestor more than 320 million years ago (Faure-Brac et al. Reference Faure-Brac, Woodward, Aubier and Cubo2024). Within this broader context, several hypotheses propose independent evolutionary pathways to elevated metabolic rates comparable to those of endotherms within Archosauromorpha. Including ancient crocodylomorph lineages (Seymour et al. Reference Seymour, Bennett-Stamper, Johnston, Carrier and Grigg2004) and pterosaurs (Clarke and Pörtner Reference Clarke and Pörtner2010), the latter attracting particular attention because their flight-related morphology and life-history traits, suggest the potential for sustained high metabolic performance.
Although the question of pterosaur thermoregulation remains contentious (Kellner and Campos Reference Kellner and Campos2002; Unwin and Deeming Reference Unwin and Deeming2008; Wellnhofer Reference Wellnhofer2008; Clarke and Pörtner Reference Clarke and Pörtner2010), several morphological features provide indirect evidence for elevated metabolic scope in these flying reptiles. Pneumatized bones (Romer Reference Romer1956; Claessens et al. Reference Claessens, O’Connor and Unwin2009; Martin and Palmer Reference Martin and Palmer2014; Buchmann et al. Reference Buchmann, Holgado, Sobral, Avilla and Rodrigues2021), elevated growth rates—including prolonged ontogenetic trajectories in taxa such as Pterodaustro (Chinsamy et al. Reference Chinsamy, Codorniú and Chiappe2008) and Rhamphorhynchus (Prondvai et al. Reference Prondvai, Stein, Ősi and Sander2012), and fibrolamellar bone histology (Steel Reference Steel2008; Araújo et al. Reference Araújo, Bantim, Holgado, Sayão, Weinschütz and Kellner2023) all indicate sustained high rates of bone deposition and, more broadly, elevated physiological performance.
Additional lines of evidence, including broad paleobiogeographic distributions (Kellner et al. Reference Kellner, Rodrigues, Costa, Weinschütz, Figueiredo, Souza, Brum, Eleutério, Mueller and Sayão2019a), the evolution of elaborate cranial crests in some taxa (Kellner and Campos Reference Kellner and Campos2002; Kellner Reference Kellner2013), the presence of pycnofibers (Kellner et al. Reference Kellner, Wang, Tischlinger, Campos, Hone and Meng2010; Yang et al. Reference Yang, Jiang, McNamara, Kearns, Pittman, Kaye, Orr, Xu and Benton2019; Cincotta et al. Reference Cincotta, Nicolaï, Campos, McNamara, D’Alba, Shawkey and Kischlat2022), and complex brain morphology (Edinger Reference Edinger1927, Reference Edinger1941; Hopson Reference Hopson1977; Kellner Reference Kellner1996) have also been interpreted as consistent with elevated levels of physiological activity. However, these inferences are largely qualitative, underscoring the difficulty of reconstructing thermophysiology from fossil remains and motivating more explicitly quantitative approaches.
Among these, quantitative histological proxies provide one of the most direct means of inferring resting metabolic rate (RMR) in extinct vertebrates, as bone-tissue organization records underlying growth dynamics (Padian and Horner Reference Padian and Horner2002; Montes et al. Reference Montes, Le Roy, Perret, De Buffrenil, Castanet and Cubo2007; Cubo and Jalil Reference Cubo and Jalil2019).
Osteocyte lacunar density has gained prominence in paleophysiological research over the last decade (Cubo et al. Reference Cubo, Le Roy, Martinez-Maza and Montes2012). When combined with phylogenetic eigenvector maps (PEMs), these data have been successfully used to infer thermometabolic regimes across terrestrial archosaurs, including Euparkeria (Legendre et al. Reference Legendre, Segalen and Cubo2013), Azendohsaurus sp. (Cubo and Jalil Reference Cubo and Jalil2019), various pseudosuchians (Legendre et al. Reference Legendre, Guénard, Botha-Brink and Cubo2016; Cubo et al. Reference Cubo, Sena, Aubier, Houee, Claisse, Faure-Brac, Allain, Andrade, Sayão and Oliveira2020, Reference Cubo, Sena, Pellarin, Faure‐Brac, Aubier, Cheyron, Jouve, Allain and Jalil2025; Faure-Brac et al. Reference Faure-Brac, Amiot, de Muizon, Cubo and Lécuyer2022), and thalattosuchians (Pellarin et al. Reference Pellarin, de Araújo Sena, Clarac and Cubo2025), as well as in plesiosaurs (Fleischle et al. Reference Fleischle, Wintrich and Sanders2018), synapsids (Faure-Brac and Cubo Reference Faure-Brac and Cubo2020), and dinosaurs (Bert et al. Reference Bert, Woodward, Rinder, Amiot, Horner, Lécuyer, Sena and Cubo2025).
Beyond resting metabolism, maximum metabolic rate (MMR) represents the highest rate at which an organism can consume oxygen to sustain aerobic metabolism during peak activity (Seymour Reference Seymour2013). In extinct taxa, MMR can be estimated using blood flow indices (Qi) derived from femoral nutrient foramina, which serve as proxies for peak of oxygen consumption (VO2 max) (Seymour et al. Reference Seymour, Smith, White, Henderson and Schwarz-Wings2012; Hu et al. Reference Hu, Nelson and Seymour2020, Reference Hu, Miller, Snelling and Seymour2023; Sena et al. Reference Sena, Montefeltro, Marinho, Langer, Fachini, Pinheiro and Machado2025a,Reference Sena, Voeten, Araújo and Cubob).
When combined with PEM, this approach provides a quantitative framework for reconstructing maximal metabolic performance in extinct clades (Cubo et al. Reference Cubo, Sena, Pellarin, Faure‐Brac, Aubier, Cheyron, Jouve, Allain and Jalil2025; Pellarin et al. Reference Pellarin, de Araújo Sena, Clarac and Cubo2025; Sena et al. Reference Sena, Montefeltro, Marinho, Langer, Fachini, Pinheiro and Machado2025a,Reference Sena, Voeten, Araújo and Cubob). Applications to non-avian dinosaurs (Bert et al. Reference Bert, Woodward, Rinder, Amiot, Horner, Lécuyer, Sena and Cubo2025), non-mammalian mammaliforms (Newham et al. Reference Newham, Gill, Brewer, Benton, Fernandez, Gostling and Haberthür2020), non-avian sauropsids (Knaus et al. Reference Knaus, van Heteren, Lungmus and Sander2021), extinct birds (Allan et al. Reference Allan, Cassey, Snelling, Maloney and Seymour2014), several archosaur groups (Sena et al. Reference Sena, Montefeltro, Marinho, Langer, Fachini, Pinheiro and Machado2023, Reference Sena, Montefeltro, Marinho, Langer, Fachini, Pinheiro and Machado2025a; Cubo et al. Reference Cubo, Sena, Pellarin, Faure‐Brac, Aubier, Cheyron, Jouve, Allain and Jalil2025), and a rhamphorhynchid pterosaur (Sena et al. Reference Sena, Voeten, Araújo and Cubo2025b) demonstrate the potential of these methods for addressing broad questions about vertebrate energetics.
A major constraint for retrodicting RMR and MMR regimes from fossils is the quality of preservation (Cubo et al. Reference Cubo, Huttenlocker, Legendre, Olivier, de Ricqlès, de Buffrénil, de Ricqlès, Zylberberg and Padian2021). Assemblages preserving three-dimensional (3D) bone architecture are therefore especially informative. The “Cemitério dos Pterossauros” (Pterosaur Graveyard) bonebed from the Upper Cretaceous of southern Brazil represents such an exceptional setting (Kellner et al. Reference Kellner, Weinschütz, Holgado, Bantim and Sayão2019b), yielding numerous three-dimensionally preserved specimens of the tapejarid pterosaur Caiuajara dobruskii (Manzig et al. Reference Manzig, Kellner, Weinschütz, Fragoso, Vega, Guimarães, Godoy, Ricetti and de Moura2014).
Recent osteohistological analyses of 18 Caiuajara specimens have provided key insights into ontogeny and life history (Araújo et al. Reference Araújo, Bantim, Holgado, Sayão, Weinschütz and Kellner2023), as well as bone laminarity associated with functional biomechanics (Araújo et al. Reference Araújo, Cubo, Sena, Bantim, Weinschütz, Kellner and Sayão2025). Together, these data offer a rare opportunity to integrate paleohistological and biomechanical inferences in a single population. Here, a quantitative osteohistological analysis of C. dobruskii is presented, constituting a novel application of PEM-based paleophysiological methods to a pterodactyloid pterosaur. As thermometabolism underpins key physiological features linked to biological traits such as growth rates, nutrient and oxygen intake, and locomotion capabilities (Cubo et al. Reference Cubo, Sena, Pellarin, Faure‐Brac, Aubier, Cheyron, Jouve, Allain and Jalil2025), we estimate both RMR and MMR to quantify aerobic scope and energetic capacity, thereby placing pterosaur thermometabolism within a broader comparative framework.
Materials and Methods
Fossil Material
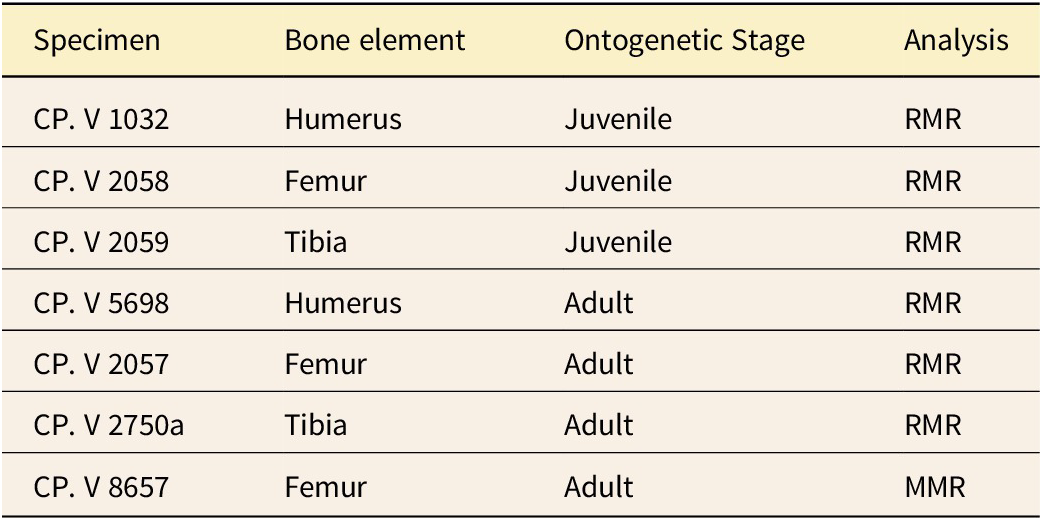
The analyzed specimens were provided by the Centro Paleontológico da Universidade do Contestado (CENPALEO–UNC) and have been previously described morphologically (Manzig et al. Reference Manzig, Kellner, Weinschütz, Fragoso, Vega, Guimarães, Godoy, Ricetti and de Moura2014) and histologically (Araújo et al. Reference Araújo, Bantim, Holgado, Sayão, Weinschütz and Kellner2023, Reference Araújo, Cubo, Sena, Bantim, Weinschütz, Kellner and Sayão2025). Six osteohistological thin sections were examined: two humeri (CP. V, CENPALEO–Vertebrados, catalogue nos. 1032 and 5698), two femora (CP. V 2058 and CP. V 2057), and two tibiae (CP. V 2059 and CP. V 2750a). In addition, a CT-scanned femur (CP. V 8657) was analyzed. All specimens belong to Caiuajara dobruskii, a tapejarid pterosaur from the Upper Cretaceous Caiuá Group, Bauru Basin, Brazil (Table 1).
Specimens of Caiuajara dobruskii used in this study for metabolic rate estimation. Each element was histologically sampled to estimate resting metabolic rate (RMR) or maximal metabolic rate (MMR), with ontogenetic stages classified as juvenile or adult based on bone microstructure and size (Araújo et al. Reference Araújo, Bantim, Holgado, Sayão, Weinschütz and Kellner2023)

Table 1. Long description
The table consists of four columns: Specimen, Bone element, Ontogenetic Stage, and Analysis.
* Row 1: Specimen C P dot V 1032, Humerus, Juvenile, R M R.
* Row 2: Specimen C P dot V 2058, Femur, Juvenile, R M R.
* Row 3: Specimen C P dot V 2059, Tibia, Juvenile, R M R.
* Row 4: Specimen C P dot V 5698, Humerus, Adult, R M R.
* Row 5: Specimen C P dot V 2057, Femur, Adult, R M R.
* Row 6: Specimen C P dot V 2750a, Tibia, Adult, R M R.
* Row 7: Specimen C P dot V 8657, Femur, Adult, M M R.
Initialisms used include R M R for resting metabolic rate and M M R for maximal metabolic rate.
Mid-diaphyseal cross sections of long bones were used to estimate RMR based on osteocyte lacunar density, whereas the CT-segmented femur was used to estimate MMR through analysis of the size of the metaphyseal nutrient foramen.
Osteohistological Procedures
Sampling and thin-section preparation were carried out at the Paleohistology Laboratory of the Department of Geology and Paleontology, National Museum, Rio de Janeiro. All specimens are housed in the same institution. Transverse thin sections of the mid-diaphysis were previously prepared for Araújo et al. (Reference Araújo, Bantim, Holgado, Sayão, Weinschütz and Kellner2023) study following established osteohistological methods: bone samples were embedded in clear epoxy resin (Resapol T-208) catalyzed with Butanox M50 (IBEX, Recife, Brazil) and cut using a diamond-tipped blade mounted on a Dremel 3000 saw. The sections were then wet-ground on a metallographic polishing machine (Aropol-E, Arotec Ltda.) with progressively finer abrasive papers (80/P80, 360/P360, 1200/P1200) until reaching a thickness of approximately 60 μm. Histological structures were examined under a Zeiss Axio Imager.M2 transmitted-light optical microscope equipped with parallel and crossed nicols and fluorescence filters to enhance birefringence, and images were captured using an AxioCam digital camera.
Ontogenetic Control
Specimens were assigned to ontogenetic categories (juvenile, subadult, adult) following the size classes of Manzig et al. (Reference Manzig, Kellner, Weinschütz, Fragoso, Vega, Guimarães, Godoy, Ricetti and de Moura2014) and the osteohistological criteria of Araújo et al. (Reference Araújo, Bantim, Holgado, Sayão, Weinschütz and Kellner2023). These criteria include: (1) degree of cortical vascularization; (2) relative abundance of primary versus secondary bone tissue; (3) presence, number, and spacing of lines of arrested growth (LAGs); (4) development of endosteal lamellae and extent of metaphyseal remodeling; and (5) when preserved, degree of fusion of articular ends. Juveniles are characterized by highly vascularized fibrolamellar bone lacking growth marks; subadults by the onset of cortical stabilization and the appearance of the first LAGs; and adults by reduced vascularity, multiple LAGs, and well-developed endosteal lamellae. These ontogenetic categories were explicitly incorporated into the sampling design to assess how metabolic rates vary across the growth series of C. dobruskii.
Osteocyte Density
Osteocyte lacunar density was quantified following the protocol described by Cubo et al. (Reference Cubo, Le Roy, Martinez-Maza and Montes2012), by counting lacunae within the primary bone matrix between primary osteons. Ideally, measurements would be taken from the innermost layers of the primary cortical bone deposited in early ontogeny, as in the original dataset compiled by Cubo et al. (Reference Cubo, Le Roy, Martinez-Maza and Montes2012). However, extensive bone resorption in the endosteal region resulting from medullary cavity expansion in pterosaur bones (Steel Reference Steel2008; Eleutério et al. Reference Eleutério, Bantim, Lima, Andrade, Saraiva, Kellner and Sayão2015), together with the adult ontogenetic stage of some specimens, precluded sampling of these regions. Consequently, counts were taken from more external regions of the primary cortex, representing the youngest preserved portions of the bone, and osteocyte density was calculated as the number of osteocyte lacunae divided by the analyzed bone area and is expressed as the number of lacunae per square micrometer (μm²).
Phylogenetic Comparative Method and Framework
Phylogenetic relationships among extant taxa were compiled from multiple sources: Neornithes (Bundle et al. Reference Bundle, Hoppeler, Vock, Tester and Weyand1999; Allan et al. Reference Allan, Cassey, Snelling, Maloney and Seymour2014; Stiller et al. Reference Stiller, Feng, Chowdhury, Rivas-González, Duchêne, Fang and Deng2024); Cetartiodactyla (Zurano et al. Reference Zurano, Magalhães, Asato, Silva, Bidau, Mesquita and Costa2019); other mammals (Upham et al. Reference Upham, Esselstyn and Jetz2019; Newham et al. Reference Newham, Gill, Brewer, Benton, Fernandez, Gostling and Haberthür2020); squamates (Vidal and Hedges Reference Vidal and Hedges2005; Pyron et al. Reference Pyron, Burbrink and Wiens2013); and varanid lizards (Villa et al. Reference Villa, Abella, Alba, Almecija, Bolet, Koufos and Knoll2018). Branch lengths for extant taxa were obtained from TimeTree (timetree.org, accessed 29 November 2024), while those for extinct taxa were sourced from the Paleobiology Database (paleobiodb.org, accessed 29 November 2024).
PEMs were generated using the MPSEM (Modelling Phylogenetic Signals using Eigenvector Maps) package (v. 0.6-1; Guénard et al. Reference Guénard, Legendre and Peres-Neto2013) in R Studio software (v.2024.12.1 Build 563; R Core Team 2023) to develop regression models for estimating mass-independent RMR and MMR. Alternative models incorporating different co-predictors (plus a null model without co-predictors) were systematically compared using corrected Akaike information criterion (AICc) via forward sequential selection (forward sequential AICc). The osteocyte lacunae density (cell density) model yielded the lowest AICc values and highest adjusted R² across skeletal elements (humerus: R² = 0.82; femur: R² = 0.76; tibia: R² = 0.99) and was thus selected as the best-fitting model (detailed model diagnostics reported in “Results”). These models enabled retrodiction of mass-independent RMR and MMR values, along with 95% confidence intervals (CIs), for C. dobruskii specimens. Model residuals were assessed for normality using the Shapiro-Wilk test.
Metabolic Rate Retrodictions and Units
RMR
To estimate the mass-independent RMR of C. dobruskii, we developed phylogenetically informed regression models following the R script and workflow of Legendre et al. (Reference Legendre, Guénard, Botha-Brink and Cubo2016). The calibration dataset consisted of measurements from 18 extant amniote species, supplemented here with four additional bird taxa (see Supplementary Table 1), and osteocyte lacunar density from six long bones of C. dobruskii (humerus, femur, tibia) was used as the quantitative predictor of mass-independent RMR (Fig. 1). Because osteohistological organization varies among bones, separate comparative datasets were used to fit humeral, femoral, and tibial models (see data.txt used in R analyses in Supplementary Material).
Osteocyte density (OD) as an explanatory factor to infer resting metabolic rate (RMR). A, Tibia CP. V 2750a. Marked squares in the cortex indicate regions of the outer cortex delineated by transects. B, Transects and respective osteocyte density values obtained.

Figure 1. Long description
Panel A shows a circular cross-section of a tibia bone. At the center is a white void containing a black silhouette of a pterosaur and the text Tibia - C P dot V 2057a. The surrounding bone cortex is a thick, textured ring with dark vascular canals. Four red squares, numbered 1 through 4, are positioned along the outer cortex. Square 1 is at the top-left, square 2 is at the bottom-center, square 3 is at the middle-right, and square 4 is at the top-right.
Panel B displays four magnified rectangular insets corresponding to the numbered regions in Panel A. Each inset shows the microscopic texture of the bone and provides an O D value below it.
* Inset 1 shows O D 0,0052.
* Inset 2 shows O D 0,00381.
* Inset 3 shows O D 0,0027.
* Inset 4 shows O D 0,00462.
Phylogenetic structure was incorporated using PEM (Guénard et al. Reference Guénard, Legendre and Peres-Neto2013), which extends ordinary least squares regression by estimating the strength of phylogenetic signal (α parameter) and including phylogenetic eigenvectors as co-predictors when appropriate. Model fitting followed Guénard et al. (Reference Guénard, Legendre and Peres-Neto2013), Legendre et al. (Reference Legendre, Guénard, Botha-Brink and Cubo2016), and Knaus et al. (Reference Knaus, van Heteren, Lungmus and Sander2021), and goodness of fit was evaluated using R² and AICc, the latter treated descriptively because no alternative model structures were compared. The tibia model showed the best fit (R² = 0.99; AICc = 3.92), followed by the humerus (R² = 0.82; AICc = 6.41) and femur (R² = 0.76; AICc = 17.37), and Shapiro-Wilk tests confirmed that residuals did not deviate from any model. Final PEM models were used to retrodict mass-independent RMR for juvenile and adult C. dobruskii, including 95% CIs derived from parametric bootstrapping.
Ancestral Reconstruction of Metabolic Values
We reconstructed ancestral RMR for all nodes using the function fastAnc from the R package phytools (Revell Reference Revell2024), following the approach of Faure-Brac and Cubo (Reference Faure-Brac and Cubo2020). This function estimates ancestral states under a Brownian motion model maximum likelihood and provides 95% CIs for each node, which can be visualized directly on the phylogeny.
Because the metabolic values used as input are scaled, dimensionless predictions derived from the PEM models, the reconstructed ancestral states likewise lack physiological units. Accordingly, ancestral character estimation (ACE) results were interpreted in a comparative framework, focusing on the relative phylogenetic position of C. dobruskii within the broader metabolic landscape of archosaurs.
MMR
We examined 3D models of the C. dobruskii femur (CP. V8657). The fossil was scanned using a Zeiss Xradia 510 Versa microtomograph (Zeiss Inc., Barcelona, Spain), equipped with a flat-panel detector, at the National Museum, Federal University of Rio de Janeiro. Segmentation and measurement of the nutrient foramina were performed using Mimics Innovation Suite v. 24 (Materialise) at the Centre de Recherche en Paléontologie–Paris (CR2P). Foramina were manually identified using axial scan slices, and 3D rendering was carried out using the Multiple Slice Edit tool. Both the segmentation process and the estimation of the nutrient foramen diameter were conducted using the Mimics software. The measurement protocol involves recording the area of the nutrient foramen as close as possible to the external aperture, to minimize sampling bias between fossil specimens and extant dry bones, whose foramina are typically measured at the bone surface.
The nutrient foramen area on the femur (CP. V 8657) was measured on foramen aperture using ImageJ/Fiji (v. 1.54; Schindelin et al. Reference Schindelin, Rueden, Hiner and Eliceiri2015), approximating the foramen as a geometric circle. Nutrient artery blood flow rate (Q̇, in ml s−1) was estimated with the curved polynomial equation: log Q̇ = −0.20 log(ri²) + 1.91 log(ri) + 1.82 (Seymour et al. Reference Seymour, Hu, Snelling and White2019), where ri is the arterial lumen radius derived from the arterial lumen area, assumed to represent roughly 20% of the total foramen area (Hu et al. Reference Hu, Nelson and Seymour2022).
To estimate the mass-independent MMR for the femur (CP. V 8657), we applied a phylogenetic inference model based on femoral nutrient foramina data (Fig. 2). Our extant dataset comprised MMRs, body masses, and nutrient artery blood flow (Q̇) values from 43 amniote species, including 15 mammals, 14 non-avian sauropsids, and 14 avian sauropsids (see Supplementary Table 2). This approach allowed us to infer the mass-independent MMR from femoral nutrient foramen data.
Mass-independent maximum metabolic rate (MMR) inferred using metaphyseal femoral nutrient foramen measurements. A, CT image of a Caiuajara dobruskii femur (CP. V 8657), showing the nutrient foramen region in metaphysis. B and C, Close-up views of the nutrient foramen (NF) from CT scans. Scale bar equals 5 cm (A).

Allometric Correction and Metabolic Units
Some authors have shown that the MMR is corrected with different mass exponents depending on the clade. For example, in mammals, the mass exponent is 0.870, higher than in sauropsids corresponding to 0.829 (mass-independent MMR (White and Seymour Reference White and Seymour2005; Seymour Reference Seymour2013; Hu et al. Reference Hu, Nelson and Seymour2022). To correct the allometric effects (i.e., the increasing surface-to-volume ratio with decreasing mass), we applied phylogenetic exponents in our analyses of 0.86 for RMR and 0.87 for MMR. These values correspond to the phylogenetic means recovered using Mesquite (Maddison and Maddison Reference Maddison and Maddison2016) according to the different dataset for each analysis. This generates a single character matrix of distinct extant species exponents: 0.829 for non-avian sauropsids (Seymour Reference Seymour2013), 0.87 for synapsids (White and Seymour Reference White and Seymour2005), and 1.02 for avian species (Allan et al. Reference Allan, Cassey, Snelling, Maloney and Seymour2014), and a question mark for fossil taxa using the Reconstruct ancestral states function with the Character History Source option in the Trace. Consequently, the mass-independent RMR unit is expressed in ml O2 h−1 g−0.86 and the mass-independent MMR unit in ml O2 h−1 g−0.87.
Results
Adult and Juvenile Caiuajara dobruskii RMR Retrodiction
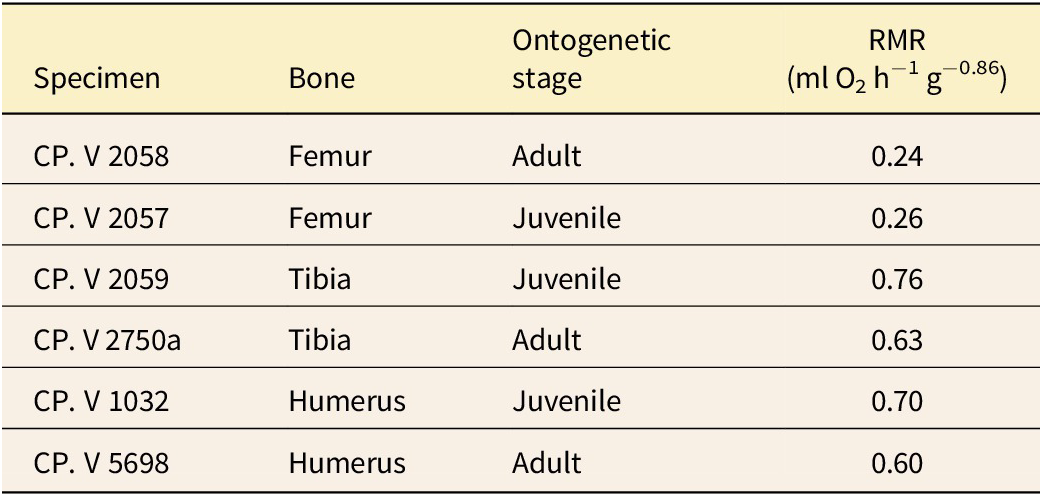
Mass-independent RMR estimates for juvenile and adult C. dobruskii were broadly similar across skeletal elements (Table 2). The phylogenetic eigenvector-based regression models used for RMR retrodiction demonstrated strong explanatory power: for the humerus and femur models, R 2 values were 0.82 and 0.76, respectively, whereas the tibial model exhibited exceptionally high performance (R 2 = 0.99; AICc = 3.92). No alternative models provided a better fit based on AICc comparisons, and therefore model selection was not required (see “Materials and Methods”). For the humerus, the retrodicted mass‐independent RMR was 0.70 (95% CI: 0.49–1.02) ml O2 h−1 g−0.86 in the juvenile and 0.60 (95% CI: 0.42–0.86) ml O2 h−1 g−0.86 in the adult. The tibial models produced the lowest values, 0.18 (95% CI: 0.11–0.29) ml O2 h−1 g−0.86 in the adult and 0.15 (95% CI: 0.09–0.23) ml O2 h−1 g−0.86 in the juvenile (Fig. 3). Femoral retrodictions were intermediate, yielding 0.22 (95% CI: 0.13–0.36) ml O2 h−1 g−0.86 in juveniles and 0.30 (95% CI: 0.19–0.48) ml O2 h−1 g−0.86 in adults.
Caiuajara dobruskii resting metabolic rate (RMR) values calculated in this study using data available from literature

Table 2. Long description
The table consists of four columns: Specimen, Bone, Ontogenetic stage, and R M R in milliliters O sub 2 per hour per gram to the negative 0.86 power.
* Row 1: Specimen C P dot V 2058, Femur, Adult, R M R 0.24.
* Row 2: Specimen C P dot V 2057, Femur, Juvenile, R M R 0.26.
* Row 3: Specimen C P dot V 2059, Tibia, Juvenile, R M R 0.76.
* Row 4: Specimen C P dot V 2750a, Tibia, Adult, R M R 0.63.
* Row 5: Specimen C P dot V 1032, Humerus, Juvenile, R M R 0.70.
* Row 6: Specimen C P dot V 5698, Humerus, Adult, R M R 0.60.
Results of the phylogenetic eigenvector map (PEM) analysis using osteocyte density as predictor variable for mass-independent resting metabolic rate (RMR) inferences in ml O2 h−1 g−0.86. Dark blue squares represent ectotherms, while red squares denote endotherms. Black square represents the mass-independent RMR values of Caiuajara dobruskii.

Figure 3. Long description
A two-panel horizontal layout. On the left is a phylogenetic tree with grey branches connecting eighteen species, each represented by a silhouette and scientific name. The species are organized into clades including amphibians, mammals, squamates, turtles, crocodilians, the extinct pterosaur Caiuajara dobruskii, and birds.
To the right is a scatter plot with a logarithmic X-axis labeled R M R (m L O sub 2 h super -1 g super -0.86) ranging from 0.01 to 10.
Data distribution:
* Blue open squares (ectotherms) are clustered on the left side of the plot, between 0.03 and 0.1.
* Red open squares (endotherms) are clustered on the right side, between 0.8 and 3.0. This group includes mammals at the top and birds at the bottom.
* A single black solid square with horizontal error bars represents Caiuajara dobruskii, positioned in a yellow highlighted row. It sits in the middle of the plot at approximately 0.2, between the ectotherm and endotherm clusters.
Bottom left text indicates the model used is Phylogeny plus Osteocyte Density, with an R super 2 of 0.99 and an A I C c of 3.92.
Statistical Comparison to Extant Taxa
The estimated RMR of C. dobruskii femur PEM: 0.22–0.36 (central: 0.285) yields a z-score of +5.15 relative to ectotherms (mean = 0.079, SD = 0.040; n = 10) and −1.53 relative to endotherms (mean = 1.96, SD = 1.11; n = 12), positioning it as a statistical extreme outlier in the ectothermic spectrum (5.2 SD above mean) but well within the physiological variation of endotherms (1.5 SD below mean; Supplementary Fig. 1).
Reconstruction of Ancestral RMR Values across Phylogeny
Ancestral reconstruction of RMR under a maximum-likelihood framework reveals a clear phylogenetic gradient. Basal nodes exhibit low reconstructed values (ranging approximately from −2.8 to −2.0), whereas progressively higher values are observed toward more derived clades, reaching up to about 0.77 in terminal nodes (Fig. 4).
Maximum-likelihood (ML) ancestral state reconstruction of mass-independent resting metabolic rate (RMR) across extant amniotes and Caiuajara dobruskii, based on values inferred with phylogenetic eigenvector maps (PEMs) for the fossil taxon and measured by respirometry for living species (units in ml O2 h−1 g−0.86). Branch colors represent reconstructed RMR values along the phylogeny, from low (yellow) to high (red), and numbered internal nodes correspond to ML ancestral estimates summarized in the adjacent table, which reports central values and 95% confidence intervals (CIs). Within Archosauria, basal nodes exhibit low reconstructed RMR compatible with plesiomorphic ectothermy, whereas more derived ornithodiran nodes show progressively elevated values, with C. dobruskii plotting among the highest ancestral estimates, close to those of modern birds.

Figure 4. Long description
A multi-panel figure containing a color scale, a phylogenetic tree, and a data table.
* Color Scale: A vertical gradient bar on the left ranging from negative 3.0 (yellow) to 0.8 (red), representing reconstructed R M R values.
* Phylogenetic Tree: The tree root begins at node 24 on the left, dated to approximately 320 m M A. Branches extend rightward toward modern species at 0 m M A.
* Branch Colors: Basal nodes and branches for squamates (Varanus, Podarcis), turtles (Chelodina, Trachemys), and crocodilians (Crocodylus, Alligator) are yellow, indicating low R M R. Branches for mammals (Capreolus, Mus) and birds (Anas, Gallus) are dark red, indicating high R M R.
* Fossil Taxon: Caiuajara dobruskii is positioned between crocodilians and birds. It has a reconstructed value of 0.75 with a 95 percent C I of 0.49 to 1.02, indicated by a P E M inference label. Its branch is colored orange-red, similar to modern birds.
* Data Table: Located on the right, titled ancestral states M L reconstruction with 95 percent C I. It lists node numbers 24 through 45 with corresponding lower, central, and upper statistical values. For example, node 24 has a central value of 0.2690, while node 45 has a central value of 2.1600.
The analyzed fossil taxon falls within this upper range, aligning with the elevated values characteristic of derived nodes and clearly differing from the lower estimates reconstructed for basal ancestors. Overall, the pattern indicates a continuous evolutionary gradient in reconstructed values throughout phylogeny, with marked differences between deep ancestral nodes and more derived taxa.
Adult Caiuajara dobruskii MMR Retrodiction
The retrodicted mass-independent MMR for C. dobruskii was 5.68 (95% CI: 4.66–7.74) ml O2 h−1 g−0.87, with estimated femoral blood flow (Q̇) serving as a co‑predictor in the phylogenetic regression model (R² = 0.90; corrected Akaike information criterion, AICc = 58.28; p = 5.50 × 10⁻¹²; Fig. 5). This mass‑independent MMR lies above typical values reported for extant ectothermic reptiles (< 1 ml O2 h−1 g−0.87) and overlaps the lower range of birds and other high‑performance vertebrates, indicating a substantially elevated aerobic capacity relative to ectotherms while remaining below the highest values observed in mammals.
Phylogenetic eigenvector map (PEM) including a sample of extant amniotes used to construct the mass-independent maximal metabolic rate (MMR) inference model. Retrodictions for pterosaurs were performed using the nutrient artery Q̇ value as a co-predictor. Pink squares represent MMR values measured for Synapsida; dark green squares indicate values observed in non-avian sauropsids; red squares correspond to MMR values observed in birds; and the black square represents the fossil taxon Caiuajara dobruskii.

Figure 5. Long description
A dual-panel diagram.
On the left is a phylogenetic tree with branches color-coded by clade.
* The top section in purple and pink represents Synapsida, including mammals like Tachyglossus aculeatus and Bos taurus.
* The middle section in shades of green represents non-avian sauropsids, including lizards like Tiliqua rugosa and crocodilians like Alligator mississippiensis.
* The bottom section in yellow and red represents birds, such as Dromaius novaehollandiae and Pelecanus conspicillatus.
* A specific branch for the fossil taxon Caiuajara dobruskii is highlighted with a horizontal yellow bar extending into the data area.
On the right is a scatter plot on a logarithmic scale. The x-axis is labeled M M R 0.87 (m L O sub 2 h super minus 1 g super minus 0.87) with values ranging from 0.1 to 100.
* Pink squares (Synapsida) are clustered between 10 and 100 on the x-axis.
* Dark green squares (non-avian sauropsids) are clustered between 0.8 and 10.
* Red squares (birds) are clustered between 5 and 50.
* A single black square with horizontal error bars represents Caiuajara dobruskii, positioned at approximately 6 on the x-axis, aligned with the yellow highlight from the tree.
Discussion
RMR Estimates across Major Clades
Our quantitative analyses retrodicted mass-independent RMR values for Caiuajara dobruskii ranging from 0.24 to 0.76 ml O2 h−1 g−0.86. These values are substantially higher than those typically observed in extant ectothermic sauropsids (0.03–0.15 ml O2 h−1 g−0.86; mean ≈ 0.07; e.g., Alligator mississippiensis, Caiman crocodilus, Varanus niloticus; Fleischle et al. Reference Fleischle, Wintrich and Sanders2018; Sena et al. Reference Sena, Montefeltro, Marinho, Langer, Fachini, Pinheiro and Machado2023; Pellarin et al. Reference Pellarin, de Araújo Sena, Clarac and Cubo2025), yet considerably lower than those of modern endotherms such as birds and mammals (1.25–4.54 ml O2 h−1 g−0.86; mean ≈ 2.5). Accordingly, the estimated RMR of C. dobruskii is approximately 4- to 12-fold higher than the ectothermic mean, but 3- to 6-fold lower than that of typical endotherms.
Using the central estimate derived from the femur PEM (0.285 ml O2 h−1 g−0.86) yielded a z-score of +5.15 for C. dobruskii relative to ectotherms (mean = 0.079, SD = 0.040; n = 10) and −1.53 relative to endotherms (mean = 1.96, SD = 1.11; n = 12). This places it as an extreme statistical outlier among ectotherms (more than 5 SD above the mean), while remaining within the range of endothermic variation (1.5 SD below the mean; Supplementary Fig. 1). Importantly, 95% CIs of our estimates do not overlap with those of either sampled ectotherms or endotherms.
Taken together, these results position C. dobruskii within a quantitatively intermediate metabolic continuum relative to extant tetrapods. This pattern is further supported by estimated mass-independent MMR values, which fall between those highly active ectothermic reptiles (e.g., varanids) and those of birds and mammals, indicating an overall metabolic regime elevated above typical ectothermy, yet not reaching the full intensity of endothermy.
Comparative biological evidence reinforces the plausibility of such intermediate metabolic strategies. In fishes, regional endothermy has evolved independently in tunas (Ciezarek et al. Reference Ciezarek, Osborne, Shipley, Brooks, Tracey, McAllister, Gardner, Sternberg, Block and Savolainen2019), billfish (Istiophoridae and Xiphiidae), and lamnid sharks (Lamnidae; Pimiento et al. Reference Pimiento, Cantalapiedra, Shimada, Field and Smaers2019), demonstrating that elevated aerobic performance and increased tissue temperatures can arise through distinct physiological and evolutionary pathways (Block et al. Reference Block2011). Similarly, leatherback sea turtles (e.g., Dermochelys coriacea) elevate their internal body temperatures above ambient conditions through increased metabolic activity, without maintaining strict homeothermy (Paladino et al. Reference Paladino, O’Connor and Spotila1990; Dawson et al. Reference Dawson, Field, Hull, Zelenitsky, Therrien and Affek2020). These examples indicate that intermediate metabolic states are not anomalous, but rather part of a broader physiological continuum.
Histological evidence further supports this interpretation by revealing heterogeneity in growth dynamics among pterosaurs. For instance, Pterodaustro exhibits an initial phase of rapid growth lasting approximately 2 years, followed by 3 to 4 years of slower bone deposition, indicating a determinate and prolonged ontogeny (Chinsamy et al. Reference Chinsamy, Codorniú and Chiappe2008). In contrast, Rhamphorhynchus displays a more gradual and continuous growth pattern, suggesting greater ontogenetic plasticity and potentially more moderate metabolic rates (Prondvai et al. Reference Prondvai, Stein, Ősi and Sander2012). Caiuajara, in turn, appears to have sustained elevated growth rates throughout ontogeny, without clear development of parallel-fibered bone associated with the onset of flight (Araújo et al. Reference Araújo, Bantim, Holgado, Sayão, Weinschütz and Kellner2023), which may indicate a more persistently elevated physiological regime.
Within a broader macroevolutionary context, reconstructed RMR values across Archosauria indicate a directional trend from low values at basal nodes toward progressively higher metabolic levels in more derived lineages (Grigg et al. Reference Grigg, Nowack, Bicudo, Bal, Woodward and Seymour2022). This pattern suggests that elevated aerobic capacity and enhanced thermoregulatory potential began to emerge early in archosaur evolution, rather than arising abruptly in crown groups. The metabolic position of Caiuajara within this gradient reinforces this interpretation: its estimated RMR aligns with elevated values observed in derived nodes, indicating a level of energetic performance well above plesiomorphic ectothermy.
This evolutionary framework suggests that increases in activity, growth rate, and metabolic intensity were tightly linked during archosaur diversification. In pterosaurs, the origin of powered flight likely imposed substantial energetic demands and may have favored the evolution of elevated metabolic performance, without requiring physiological equivalence to the thermoregulatory regimes of extant birds or mammals (Mozo et al. Reference Mozo, Emre, Bouillaud, Ricquier and Criscuolo2005).
Accordingly, our results support the presence of intermediate metabolic conditions in C. dobruskii, reflecting its position within a broader evolutionary continuum of increasing metabolic intensity, without implying a single, intermediate discrete thermoregulatory strategy.
On the Use of “Mesothermy” and Intermediate Metabolic States
The term “mesothermy” has been widely used to describe organisms that exhibit metabolic rates intermediate between those of ectotherms and endotherms (Grady et al. Reference Grady, Enquist, Dettweiler-Robinson, Wright and Smith2014). In this context, the position of C. dobruskii within a quantitatively intermediate metabolic continuum is broadly consistent with the “mesothermic” condition inferred for non-avian dinosaurs based on growth scaling (Grady et al. Reference Grady, Enquist, Dettweiler-Robinson, Wright and Smith2014) and for basal archosauromorphs using phylogenetic eigenvector mapping approaches (Legendre et al. Reference Legendre, Guénard, Botha-Brink and Cubo2016).
However, this classification should be treated with caution. As emphasized by Legendre et al. (Reference Legendre, Guénard, Botha-Brink and Cubo2016), intermediate metabolic rates may reflect an evolutionary gradient of ancestrally elevated metabolic levels within Archosauromorpha, rather than a discrete thermoregulatory category.
Given these considerations, we interpret the metabolic profile of C. dobruskii as part of a broader continuum of intermediate physiological states, characterized by RMR and MMR that exceed those of most extant ectotherms but do not match the full intensity observed in typical endotherms. In this sense, Caiuajara may be described as metabolically intermediate and broadly compatible with mesothermy sensu lato, understood here as a descriptive term for taxa showing intermediate metabolic intensity and partial thermoregulatory capacity. Importantly, comparable physiological patterns occur in a variety of extant vertebrates, including highly active taxa with ectothermic ancestry, such as tunas and lamnid sharks, as well as lineages with endothermic ancestry but reduced metabolic intensity, such as monotremes. These examples indicate that intermediate metabolic regimes can arise through multiple physiological and evolutionary pathways and should not be taken to imply a single underlying mechanism or a strictly defined thermoregulatory category. Accordingly, the metabolic pattern inferred for C. dobruskii is best viewed as consistent with a spectrum of intermediate physiological conditions, rather than as evidence for one exclusive thermoregulatory strategy. In the absence of direct physiological data, we therefore refrain from assigning Caiuajara to a rigid categorical framework and instead emphasize its position within a metabolically intermediate continuum.
Importantly, the combination of moderately elevated RMR and relatively high estimated MMR suggests that Caiuajara possessed the capacity for energetically demanding behaviors, such as sustained flight, while likely exhibiting limited or partial thermal stability. This provides a plausible physiological explanation for its intermediate position relative to extant ectotherms and endotherms, while explicitly acknowledging that multiple thermoregulatory scenarios, including mesothermy sensu lato, remain plausible.
Finally, because no sampled extant tetrapod exhibits a comparable combination of traits—and given the absence of direct living analogues for pterosaurs, straightforward actualistic comparisons are not possible for this taxon. Accordingly, any metabolic classification should be treated with caution. Nevertheless, this study represents one of the first quantitative efforts to reconstruct RMR and MMR in pterosaurs, contributing to a more refined understanding of the physiology of these remarkable flying reptiles.
Ontogenetic Patterns and Functional Implications
Across ontogeny, both juvenile and adult specimens of C. dobruskii exhibit relatively high mass-independent RMR values. Juvenile humeri yield slightly higher retrodicted rates, consistent with the elevated energetic requirements of rapid skeletal growth and active thermoregulation during early life stages (Glazier Reference Glazier2005; Araújo et al. Reference Araújo, Bantim, Holgado, Sayão, Weinschütz and Kellner2023). However, unexpected patterns were detected in the femur and tibia, where RMR values were higher in adults than in juveniles.
In taxa reliant on terrestrial or saltatory locomotion, cortical ossification often intensifies during later developmental stages, leading to an increase in osteocyte lacunae density and, consequently, higher inferred RMR values (Huttenlocker and Farmer Reference Huttenlocker and Farmer2017; Cubo et al. Reference Cubo, Sena, Pellarin, Faure‐Brac, Aubier, Cheyron, Jouve, Allain and Jalil2025). In C. dobruskii, this pattern may reflect ontogenetic shifts in hindlimb function, potentially linked to changes in locomotor behavior or the increasing structural demands of takeoff and landing. These findings suggest that pterosaur bone physiology was highly dynamic, with metabolic and biomechanical demands changing during development in response to functional constraints.
In vertebrates, MMR is tightly coupled with circulatory efficiency, as increasing metabolic and locomotor demands require enhanced oxygen delivery. One reliable proxy used to estimate MMR in extinct taxa is the size of the nutrient foramina in long bones, particularly in the femur, as this reflects the capacity of the nutrient artery to supply oxygenated blood to bone tissue (Seymour et al. Reference Seymour, Smith, White, Henderson and Schwarz-Wings2012, Reference Seymour, Hu, Snelling and White2019; Hu et al. Reference Hu, Nelson, Snelling and Seymour2018). In extant terrestrial vertebrates, species that exhibit higher locomotor activity possess relatively larger nutrient foramina, indicating a greater demand for oxygen to support bone remodeling and repair (Bishop and Butler Reference Bishop and Butler1995; Bundle et al. Reference Bundle, Hoppeler, Vock, Tester and Weyand1999; Allan et al. Reference Allan, Cassey, Snelling, Maloney and Seymour2014). Moreover, the biomechanical stresses associated with high activity levels often lead to microfractures, necessitating increased bone remodeling and further oxygen consumption (Seymour Reference Seymour2013).
For an adult C. dobruskii, mass-independent MMR was retrodicted to be 5.68 ml O2 h−1 g−0.87, a value overlapping the lower range of modern birds, which present mass-independent MMR in the range 4–10 ml O2 h−1 g−0.87 (Bundle et al. Reference Bundle, Hoppeler, Vock, Tester and Weyand1999; Seymour et al. Reference Seymour, Hu, Snelling and White2019; Hu et al. Reference Hu, Nelson and Seymour2021). This high metabolic capacity is critical for sustaining powered flight, as it ensures a continuous energy supply and efficient aerobic metabolism. In contrast, extant ectothermic reptiles, such as lizards, typically have mass-independent MMR values <1 ml O2 h−1 g−0.87 (Bennett and Ruben Reference Bennett and Ruben1979). The overlap between the estimated MMR of C. dobruskii and the lower avian range reinforces the notion that these pterosaurs were capable of energetically demanding activities, including sustained flight, and required a highly efficient aerobic system. As our MMR retrodictions were based solely on adult specimens, future analyses of immature individuals will be crucial to fully understand metabolic scaling across ontogeny.
Notably, this estimate closely matches the mass-independent MMR 5.55 ml O2 h−1 g−0.87 (95% CI: 4.37–7.05) recently estimated for a juvenile Rhamphorhynchus using the same femoral nutrient foramen methodology (Sena et al. Reference Sena, Voeten, Araújo and Cubo2025b). Despite major differences in body size (long-tailed non-pterodactyloid vs. short-tailed pterodactyloid), wing architecture, and paleoecology (Jurassic lagoon piscivore vs. Cretaceous desert inhabitant), both taxa converge on comparable maximal aerobic capacities that overlap the lower range of modern birds and exceed typical ectothermic reptiles by more than fivefold. This metabolic equivalence across Pterosauria lineages suggests that high aerobic performance constituted a fundamental ornithodiran adaptation for powered flight, potentially enabling sustained aerial locomotion irrespective of specific biomechanical or ontogenetic constraints.
Further, while these findings suggest a physiological convergence between pterosaurs and birds, high metabolic rates in C. dobruskii may not be solely the result of ecological adaptations. Our ACE analyses reveal a strong phylogenetic structuring of metabolic traits: basal archosaur nodes exhibit markedly low reconstructed mass-independent RMR values (approximately −2.8 to −2.0), whereas more derived ornithodiran nodes show a progressive rise, reaching positive values up to ~0.7. Caiuajara dobruskii plots within this upper range of derived nodes, indicating that its elevated metabolic rate is consistent with, rather than exceptional relative to, the metabolic landscape inherited from advanced ornithodiran ancestors. This pattern suggests that part of its metabolic physiology reflects phylogenetic inertia rather than pure ecological innovation.
However, the apparent overlap between the upper range of inferred reptilian MMR and the lower range of avian values in our dataset is driven primarily by varanid lizards, which are highly active squamates that can attain aerobic metabolic rates comparable to those of small mammals, although this elevated condition is not maintained continuously (Thompson and Withers Reference Thompson and Withers1997; Frappell and Butler Reference Frappell and Butler2004; Clemente et al. Reference Clemente, Withers and Thompson2009). These reptiles also possess disproportionately large femoral nutrient foramina relative to most other ectotherms (Seymour et al. Reference Seymour, Smith, White, Henderson and Schwarz-Wings2012; Varela et al. Reference Varela, Tambusso and Fariña2024). Because our MMR estimates are derived from this osteological proxy rather than from direct respirometry, they likely reflect a combination of genuine convergence in bone perfusion and activity levels and methodological scatter and therefore should be interpreted as indicating broad energetic capacities rather than implying equivalent whole‑organism performance between reptiles and birds.
Similarly, the MMR retrodiction of C. dobruskii aligns with the higher energetic capacity characteristic of derived archosaurs, reinforcing the interpretation that both its resting and maximal metabolic traits represent an elevated, intermediate metabolic condition arising from a combination of inherited high‑performance physiological baselines and ecological demands associated with powered flight.
Ecological and Behavioral Implications
The Caiuajara assemblage was discovered in a sand sea formed within an interior paleodesert (Manzig et al. Reference Manzig, Kellner, Weinschütz, Fragoso, Vega, Guimarães, Godoy, Ricetti and de Moura2014). In such harsh environments, animals must contend with extreme daytime heat and markedly lower nighttime temperatures (Williams and Tieleman Reference Williams and Tieleman2005). The relatively high RMR observed in juvenile C. dobruskii, while only marginally higher than adult values, suggests that these pterosaurs likely exhibited some degree of thermoregulatory control despite their increased vulnerability to thermal fluctuations. Juveniles are likely to face higher energetic demands associated with maintaining thermal balance under these challenging conditions.
The large premaxillary crest in tapejarid pterosaurs has been proposed to contribute to thermoregulation (Kellner and Campos Reference Kellner and Campos2002; Kellner Reference Kellner2013). However, the crest in C. dobruskii is only fully developed in adults, while RMR values were similar across ontogenetic stages. This pattern implies that the crest likely had a minimal role in thermoregulation in Caiuajara and was instead linked to sexual maturity. Such a developmental pattern supports hypotheses that these prominent cranial structures primarily functioned in visual communication, social signaling, and hierarchy establishment—roles that become particularly important once reproductive maturity is reached. Ontogenetic studies of related tapejarids (Vullo et al. Reference Vullo, Marugan-Lobon, Kellner, Buscalioni, Gomez, De la Fuente and Moratalla2012; Naish et al. Reference Naish, Witton and Martin-Silverstone2021; Zhou et al. Reference Zhou, Yu, Zhu and Andres2022) further reinforce the idea that crest development is more closely associated with maturity than with physiological regulation. Similar display structures in both extant and extinct taxa often serve comparable roles in intra- and interspecific interactions (Evans Reference Evans2006; Gates et al. Reference Gates, Organ and Zanno2016; DeSantis et al. Reference DeSantis, Sharp, Schubert, Colbert, Wallace and Grine2020; Torres et al. Reference Torres, Clarke, Groenke, Lamanna, MacPhee, Musser, Roberts and O’Connor2025).
The overrepresentation of juveniles in the Caiuajara assemblage has spurred several hypotheses regarding their depositional dynamics. One possibility is that a “creching” behavior—akin to that observed in modern birds (Araújo et al. Reference Araújo, Bantim, Holgado, Sayão, Weinschütz and Kellner2023) may have facilitated group aggregation during reproductive periods, thereby enhancing protection and thermoregulation. In extant colonial birds such as flamingos (Phoenicopteridae) (Pickering et al. Reference Pickering, Creighton and Stevens‐Wood1992), pelicans (Pelecanidae) (Evans Reference Evans1984), and penguins (Spheniscidae) (Handrich et al. Reference Handrich, Bevan, Charrassin, Butler, Ptz, Woakes, Lage and Maho1997), creching is vital for minimizing heat loss and maintaining stable body temperatures, particularly under extreme environmental conditions. Similarly, the increased sensitivity of Caiuajara juveniles to temperature fluctuations may have favored such social and behavioral strategies for thermoregulation, particularly during the cooler desert nights (Fernandes and Magalhães-Ribeiro Reference Fernandes and Magalhães-Ribeiro2015). These parallels with modern avian taxa underscore the possibility that pterosaurs employed complex physiological and behavioral adaptations to cope with their environment.
Moreover, the retrodicted mass-independent RMR values for C. dobruskii (0.24–0.76 ml O2 h−1 g−0.86) fall between the typical ranges of modern ectotherms and endotherms, with confidence intervals that exclude both groups. In contrast, the estimated mass-independent MMR suggests a high aerobic capacity compatible with powered flight. These histologically derived estimates, normalized by a phylogenetic body-mass exponent, represent the first direct RMR retrodictions in pterosaurs and indicate that Caiuajara occupied an intermediate metabolic continuum, rather than matching any extant ectothermic or endothermic pattern. Given the lack of living tetrapods with this specific combination of resting and maximal metabolic rates, we refrain from inferring a single, definitive thermoregulatory strategy for Caiuajara and instead emphasize its placement within a continuum of intermediate metabolic conditions. Nonetheless, because the present study is based solely on C. dobruskii, further research across a broader range of pterosaur taxa will be essential to determine whether this metabolic pattern was widespread within the clade. Future investigations should aim to expand the sample size of both pterosaurs and extant taxa, especially birds, thereby enabling broader generalizations regarding pterosaur metabolic physiology and its ecological and evolutionary implications.
Conclusions
This study presents the first quantitative retrodictions of mass-independent RMR and MMR for Caiuajara dobruskii, providing new insights into pterosaur metabolic scope and thermophysiology. The reconstructed RMR values place C. dobruskii clearly above ectothermic sauropsids yet well below the mean of modern endotherms, indicating a metabolically intermediate continuum broadly compatible with mesothermy sensu lato. Both juvenile and adult specimens exhibit similar intermediate RMR values throughout ontogeny, although shifts in bone physiology may reflect changes in locomotor performance and functional demands. A mass-independent MMR estimate of 5.68 ml O2 h−1 g−0.87 places C. dobruskii within the metabolic range of highly active reptiles, such as varanids, while overlapping with values reported for some modern birds and small mammals. Together, these results suggest that C. dobruskii possessed a well-developed aerobic system capable of sustaining energetically demanding behaviors, including prolonged powered flight, although likely without reaching the extreme performance levels of small endotherms. Combined RMR and MMR estimates indicate that C. dobruskii occupied an intermediate position within a broader metabolic continuum between typical ectothermic reptiles and fully endothermic birds and mammals, without uniquely resolving its thermoregulatory strategy. Furthermore, the apparent lack of a thermoregulatory function for the cranial crest, combined with its delayed development, supports a sociosexual signaling role rather than physiological regulation. Behavioral adaptations such as possible creching behavior may have mitigated thermal stress in juvenile aggregations, particularly under extreme desert conditions. Broader taxonomic sampling of both pterosaurs and extant analogs, utilizing specimens from other pterosaur bonebeds such as Hamipterus tianshanensis and Pterodaustro guinazui, will be essential to evaluate how widespread such metabolic conditions were across Pterosauria.
Acknowledgments
E.V.A. acknowledges the Programa de Pós-Graduação em Zoologia (PPGZoo) for their grant support, as well as Center for Research on Palaeontology–Paris (CR2P)–Sorbonne University for the internship that contributed to this research. This study was funded by the Conselho Nacional de Desenvolvimento Científico e Tecnológico (CNPq: 141138/2022-0 to E.V.A; 309245/2023-0, 408309/2025-3 to J.M.S; and 308707/2023-0, and 406902/2022-4–INCT PALEOVERT to A.W.A.K.), and Fundação de Amparo à Pesquisa do Estado do Rio de Janeiro (FAPERJ: E-26/200.558/2026E-26/201.095/2022 to A.W.A.K.; E-26/210.066/2023 and E-26/210.734/2024 to J.M.S). This project received funding from the European Union’s Horizon 2020 research and innovation programme under the Marie Skłodowska-Curie grant agreement 101107135 to M.V.H. Also, the authors thank M. A. Raposo and R. Stopiglia (Setor de Ornitologia, Museu Nacional/UFRJ) for bird sample curatorial assistance and I. Rocha for technical support with 3D segmentation.
Author Contribution
E.V.A.: Conceptualization; data curation; formal analysis; investigation; methodology; writing–original draft and figure editing. M.V.H.: Conceptualization; methodology; data curation; formal analysis; writing–review; validation; funding acquisition. J.C.: Conceptualization; methodology; data curation; formal analysis; writing–review; validation; funding acquisition. L.C.W.: data curation; writing–review: A.W.A.K.: Funding acquisition; supervision; validation; writing–review and editing. J.M.S.: Conceptualization; methodology; data curation; formal analysis; writing–review; editing; funding acquisition; supervision.
Competing Interests
The authors declare no competing interests.
Data Availability Statement
All data generated or analyzed during this study, including raw datasets, R scripts for all phylogenetic and metabolic analyses, and the 3D-scanned femur model with associated parameters, are available in the Dryad Digital Repository at: https://doi.org/10.5061/dryad.t1g1jwtfv




 Open access

