1. Introduction
Scientists present hypotheses in journal articles and research talks, and defend them with arguments that often include visual representations as well as text. Papers in Science and Nature, for example, often have diagrams, graphs, and the products of imaging techniques like MRI and electron microscopy. Why do scientists include visual representations—why not defend ideas just with linguistic or numerical representations? Scientists do not act as if figures are ‘mere illustrations’ that are redundant expressions of information presented in the text, or convey information inessential to the argument. On the contrary, scientists treat figures as if they play integral roles in the arguments in which they appear—reviewers include assessment of figures and of the relation between figures and conclusion in their evaluation of the strength and cogency of the argument as a whole. These phenomena—the prevalence of figures presented to support hypotheses, and the way scientists evaluate those figures in assessing the argument as a whole—suggest that visual representations make some significant contribution to arguments distinct from that of linguistic representations.
But how figures contribute support to hypotheses is not well understood. There has been no sustained study of how, or even whether, a picture could provide evidence for a scientific hypothesis; only recently have a few philosophers have addressed the issue at all (see Giere Reference Giere and Baigrie1996; Brown Reference Brown and Baigrie1996; Wimsatt Reference Wimsatt, Fine, Forbes and Wessels1991). This neglect suggests an underlying assumption: The reasoning involved when scientists support hypotheses with figures can be understood without considering visual representations as such. This implicit assumption has not been tested.
This paper has two goals. The first is to lay the groundwork for explaining how visual representations function as evidence, by giving an analysis of what the visual format contributes to evidential support. The second goal is to evaluate the assumption identified above. I will argue that confirmation with figures cannot be adequately understood without taking visual forms of representation into account. This shows that even though the first goal (analysis of how the visual format contributes to confirmation) is merely the first step in understanding how figures support hypotheses, it is an essential one.
Meeting these goals depends on understanding visual representations as such, as well as how they compare with linguistic representations. The first step is an analysis of the various kinds of symbols used in scientific arguments. Next, these analytical methods are applied to two figures presented as data in biological research papers, to show how the visual format is involved in supporting hypotheses. Finally, I compare these results to analytical tactics that depend on the assumptions that figures can be ignored or assimilated to linguistic analysis.
2. Symbolic Features of Visual Representations
In order to understand why different kinds of representations are used in scientific communication, it is necessary to identify the features that account for their differences and similarities. So the first thing to do is identify the symbolic features of the various kinds of representations used in scientific arguments. This will account for differences among kinds of figures used in science, as well as explain how visual representations differ from linguistic representations.
Visual representations are those with some spatial features that are interpreted to mean something about the referent. The spatial relations of a figure can refer to spatial relations (as in a diagram of a molecule), temporal relations (time lines), relations between properties (graphs), etc. Other visible features like color may also contribute to the meaning of visual representations, depending on the system, but the referential role of spatial relations is the defining feature of visual representations. Because of this, the visible forms of visual representations are related to their referents.
The two-dimensional format of figures is very different from the serial format of linguistic and mathematical representations. Written words are two-dimensional characters; we identify letters by their shapes, but a sequence of letters, punctuation marks, and spaces is sufficient to determine the meaning of linguistic statements.Footnote 1 The spatial form of serial representations is arbitrary with respect to their meaning. The shapes of letters are unrelated to the referents of the words and sentences they comprise, and the spatial position of words (like location on a page) does not contribute to the meaning of text, except in terms of the sequence of linguistic characters.
This distinction does not capture all the relevant differences and similarities among the various representations used in science. Goodman (Reference Goodman1976) provides the resources needed in his analysis of symbol systems.Footnote 2
Goodman is famous for arguing that pictorial representation is essentially similar to linguistic representation: It is based on denotation, and the content of a picture is not determined by any relation between the visible features of a picture and its referent besides a conventional assignment of referent to pictorial symbol (like that between ‘cat’ and its referent). Goodman's conclusion about the complete conventionality of pictorial representation is not warranted; Files (Reference Files1996) shows Goodman's evidence is compatible with non-conventional determinants of pictorial content, such as the role for spatial relations described above. Goodman's other results, however, present an important advance. Focusing on whole systems of symbols, rather than the relation between an individual symbol and its referent, he was able to identify some important differences and similarities among types of symbols.
Symbol systems consist of characters (classes of utterances or visible marks), and rules assigning referents to characters. We are rarely conscious of it, but comprehension of every symbol (linguistic or pictorial) requires interpretation;Footnote 3 no object conveys content just in virtue of its own properties (Goodman Reference Goodman1976; Files Reference Files1996). For this reason, every symbol system is governed by interpretive ‘rules’ that are at least partly conventional.Footnote 4 Interpretation of a particular symbol requires identifying the mark (or utterance) as an instantiation of a particular character, and the identity of the character determines what the mark denotes. For example, comprehension of written English requires (1) identifying words through identifying the sequence of individual letters that compose them, and (2) associating the correct referent objects with particular words or phrases.
Differences in how the marks are identified and how referents are assigned to characters allows for specification of two important kinds of symbol systems. The first type of symbol system has articulate syntax: Each character can be identified and differentiated from others (or it is simply illegible). They are composed of atomic characters (letters, numerals, etc.) that can be combined to form more complex characters; the identities of both the atomic characters and the more complex symbol they comprise are always determinable. Natural languages have these features, so Goodman calls these linguistic systems. Other serial representations like those in mathematics and symbolic logic count as linguistic, and so do some visual representations, such as molecular diagrams.
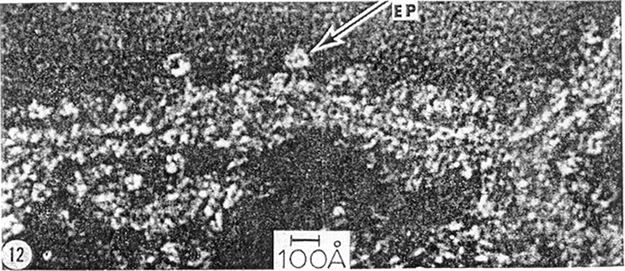
The other kind of symbol system is characterized by a distinctive set of syntactic and semantic characteristics that do not allow for decomposition of a symbol into discrete atomic characters. Examples include photography and electron micrographs. Pictorial systems Footnote 5 do not have articulate syntax: You cannot always tell exactly what character a mark instantiates. These are also dense systems. There is a character ordered between any two characters. And for any two referents of the system, there is a referent between the two. Serial systems can be dense in these ways (e.g., symbols for fractions). But because spatial relations are meaningful in a dense visual system, in pictorial systems there is a character that is intermediate in form between any two characters, and a referent object intermediate between any two referents of the system. Any variation in form (for at least one visible aspect of the symbol) changes the meaning of the figure. The electron micrograph (Figure 1) is an example of a pictorial representation.
Electron micrograph, from Fernández-Morán Reference Fernández-Morán1962. Reprinted with permission.

Changing the array of light-dark contrast in this figure will change its meaning. Pictorial representations are not composed of discrete atomic characters, so their meanings are not a function of an array of discrete components (as is the case with diagrams). However, there is a systematic relationship between the form of the character and the state of affairs it refers to (see table 1).Footnote 6

| System Type | Serial Format | Visual (2-Dimensional) Format |
|---|---|---|
| Linguistic: | ||
| Articulate syntax | Text, formulas | Molecular diagrams |
| Discrete atomic characters | ||
| Pictorial: | ||
| Not articulate | … | Electron micrographs Photographs |
| Dense set of characters and referents | MRIs, some graphs |
3. How Do Visual Representations Support Scientific Claims?
The two distinctions identified—between serial and visual formats and between linguistic and pictorial symbol systems—together allow for categorization of most figures that appear in scientific papers. I'll use these analytical tools to investigate how figures support hypotheses, by discussing two examples from research on the synthesis of ATP.
In the late 1950's investigators knew that ATP—the ‘energy currency’ of the cell—is produced in subcellular compartments called mitochondria, but they did not know how. Scientists interested in the enzyme that catalyzed the formation of ATP had a subset (or fraction) of mitochondrial components that produced ATP, but had not been able to isolate the enzyme from this mixture. Pullman et al. (Reference Pullman, Penefsky, Datta and Racker1960) claim to have isolated an enzyme that breaks down ATP into its precursors. This group of researchers simultaneously published a paper arguing that the ATPase is just the ATP synthesizing enzyme working in reverse (Penefsky et al. Reference Penefsky, Pullman, Datta and Racker1960).Footnote 7
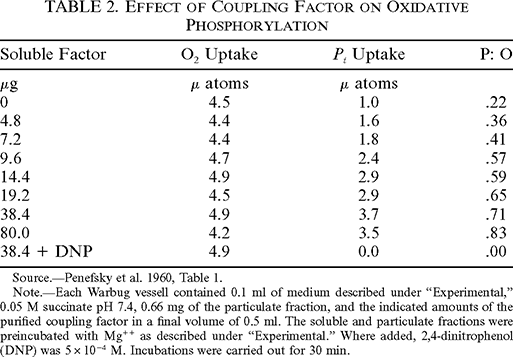
The authors present Table 2 to support the claim that ATP is synthesized by the purified ATPase. This table consists of spatially arranged linguistic terms. The categories listed in the top row identify the features tracked in the experiment, and the numerals below refer to measured quantities. The numbers on each row refer to different features of the same reaction. The values in the left column refer to micrograms of soluble factor(isolated ATPase) added in each. The numerals in the next three columns refer to quantities measured as results of the experiment, such as oxygen use.

| Soluble Factor | O2 Uptake | P i Uptake | P: O |
|---|---|---|---|
| μg | μ atoms | μ atoms | |
| 0 | 4.5 | 1.0 | .22 |
| 4.8 | 4.4 | 1.6 | .36 |
| 7.2 | 4.4 | 1.8 | .41 |
| 9.6 | 4.7 | 2.4 | .57 |
| 14.4 | 4.9 | 2.9 | .59 |
| 19.2 | 4.5 | 2.9 | .65 |
| 38.4 | 4.9 | 3.7 | .71 |
| 80.0 | 4.2 | 3.5 | .83 |
| 38.4 + DNP | 4.9 | 0.0 | .00 |
Source.—Penefsky et al. 1960, Table 1.
Note.—Each Warbug vessell contained 0.1 ml of medium described under “Experimental,” 0.05 M succinate pH 7.4, 0.66 mg of the particulate fraction, and the indicated amounts of the purified coupling factor in a final volume of 0.5 ml. The soluble and particulate fractions were preincubated with Mg++ as described under “Experimental.” Where added, 2,4-dinitrophenol (DNP) was 5×10⁻⁴ M. Incubations were carried out for 30 min.
The values presented in the table are grouped in two ways, corresponding to the two basic relations among those values. The first is that properties of the same reaction are presented along the same horizontal row. Second, rows are arranged in a vertical order according to the amount of soluble factor (and DNP), from the lowest quantity of soluble factor at the top, to the highest near the bottom. Looking vertically down columns, one can compare how increasing soluble factor relates to other features of the reactions, by comparing the relation among values in the column for amount of soluble factor to relations among values in another column. This is easily done, because the increase in soluble factor is reflected in the vertical arrangement of those values. There is no trend from the top to the bottom of the column for oxygen, so increasing soluble factor does not affect oxygen use. But the values for phosphate utilization and the P:O ratio do change—they increase down these columns. So phosphate use and P:O ratio are correlated with increase in soluble factor.
Inferences about higher-order relations between features of a set of values for one attribute (soluble factor) and features of another set (like phosphate use) are drawn from individual reaction properties; these inferences are facilitated by the visual format of the table. Spatial relations between the terms for quantities of some item correspond to relations holding between attributes of the reactions. Position in the far left column corresponds to amount of soluble factor, and because vertical position of all reaction data is correlated with that amount, the trends in other columns can easily be evaluated and compared to increase in soluble factor. The table is a format that facilitates inferences of relations that are of higher order than properties of one reaction, such as the relation between increasing quantity of soluble factor and increasing P i utilization. As a result the table supports the conclusion that the increase in P i uptake correlates with the increase in soluble factor.
Since features of the reactions are assumed to reflect aspects of physiological processes, relations among the measured quantities imply relations among the physiological processes and factors involved. Oxygen use indicates the occurrence of oxidation reactions, and P i use is a measure of phosphorylation. The authors express their conclusion with the statement that “the increase in phosphorylation was proportional to the concentration of the factor” (Penefsky et al Reference Penefsky, Pullman, Datta and Racker1960, 3332). This supports the overall conclusion of the argument, because it shows the isolated ATPase behaves like the phosphorylating enzyme.
To summarize: The table functions by arranging linguistic data in two dimensions, and using spatial relations to model relations among certain aspects of the data. This allows for use of spatial relations to identify other, higher order, relations among the data.
Spatial form is also essential to the support pictorial representations provide to hypotheses. Figure 1 is an electron micrograph from Fernández-Morán's Reference Fernández-Morán1962 study of mitochondrial membranes. This kind of image is made by staining a sample with a compound that does not mix with biological materials and also repels electrons. Electrons beamed at the sample are transmitted through biological structures and deflected by the surrounding stain. The transmitted electrons react with film or an electronic detector, producing an image whose form is the pattern in which electrons are transmitted—light areas on the figure correspond to unstained areas of the sample. So the form of the image corresponds to the shape of the biological material.
This system does not have articulate syntax. It is not always possible to determine whether two micrographs are identical or not. The system is also dense. Any change in form of the image corresponds to a change in the form of the structure represented by the micrograph.
The author presents this figure as support for linguistically expressed conclusions. He claims that the “electron-microscope studies consistently demonstrated the presence of uniform, round, or polyhedral particles, 80 to 100 Å in diameter, as the basic structural subunits encountered in all preparations of mitochondrial membranes” (Fernández-Morán Reference Fernández-Morán1962, 1049, italics removed). In asserting that his techniques demonstrate the presence of particles, he is drawing conclusions about the particles from the micrographs produced by those techniques; two inferential steps are involved.
The micrograph is a representation of a structural configuration of stained material. A pictorial representation of that state of affairs provides support for statements that are linguistic claims about the fact represented by the figure. If the state of affairs represented by the micrograph obtains, then a linguistic description of some aspect of that state of affairs is true (Perini Reference Perini2005). This micrograph represents a staining pattern, from which the author infers the spatial structure of the stained sample, including round shapes connected to elongated structures. So the first step in reasoning from the micrograph is an inference that draws a linguistically expressed conclusion about the structure of the sample from the micrograph—a pictorial representation of the structure of the sample.
A further inference can then be made from the structure of the biological material in the sample to the structure of the same components as they exist in live mitochondria: Spherical particles are attached to mitochondrial membranes.
The role that the micrograph plays in supporting the author's conclusion is not just a matter of its content. The epistemic warrant of the micrograph depends on the causal connections and reliability of this method in generating accurate representations. This is similar to perceptually grounded linguistic observation statements. Our belief in a speaker's capacity to produce true verbal reports of her observations is essential to belief that any one of her observation statements is true. The critical difference between a figure like a micrograph and a linguistically expressed observation claim is that the form of the figure is causally related to its content.
The causal process that produces electron micrographs is important to its capacity to support hypotheses for a second reason. Causal relations between the experimental system and the production of the image correlate the form of the micrograph with the structure of the sample. Since we are capable of interpreting the visible features of the micrograph as a representation of that structure, electron microscopy can produce images that represent structures never seen or thought of before. Electron micrographs can represent unfamiliar phenomena, without need to articulate hypotheses about results prior to the experiment. As in this case, figures that support the existence of unexpected structural features can be produced. This system can also represent very complicated structural properties, even when there are no linguistic terms for the same features. So the causal relation between visible form of the micrograph and the structure of the sample is a source of the credibility of the representations that are produced, and allows for representation of novel and complex phenomena.
4. Is a Representational Analysis of Figures Necessary to Account for Their Contribution to Supporting Hypotheses?
The analysis has shown that specific symbolic features of these figures are involved in the evidential support they provide. The distinctive two-dimensional format of visual representations, along with the distinction between linguistic and pictorial types of representations, has helped to explain why both the table and the micrograph are used as evidence. It is now time to evaluate the assumption that seems to underlie philosopher's lack of attention to visual representations, that understanding visual representations as such is not necessary to understanding the reasoning involved in arguments in which figures are presented. Is analysis of figures as representations really essential to understanding their role in confirmation?
There are two general ways to avoid analyzing figures as such, without simply ignoring their presence in scientific arguments: (a) translate figures into linguistic representations and analyze the translation rather than the figure, or (b) show that the role they play is actually not a representational role after all.
The first option is to translate figures into linguistic representations, and then show how the linguistic translations relate to the hypotheses they support. This approach depends on being able to express the content of figures with sentences and mathematical representations. The table contains only linguistic terms, so it is easy to translate it into a serially formatted, linguistic representation. One way to do it is to arrange the data in ordered tuples to express relations represented by the spatial relations on which the table is based. The most basic relation represented in the table is that of features of the same reaction. In this set of ordered tuples, the first term represents the quantity of soluble factor in the experiment, followed by four terms for the other variables of the experiment: oxygen uptake, phosphate uptake, P:O use ratio and a term to indicate the presence(1) or absence(2) of DNP. The experiment has the domain Dom E = {0.0, 4.8, 7.2, 9.6, 14.4, 19.2, 38.4, 80.0}. The relation can be represented in this set of ordered tuples: {〈0.0, 4.5, 1.0, 0.22, 0.0〉, 〈4.8, 4.4, 1.6, 0.36, 0.0〉, 〈7.2, 4.4, 1.8, 0.41, 0.0〉, 〈9.6, 4.7, 2.4, 0.57, 0.0〉, 〈14.4, 4.9, 2.9, 0.59, 0.0〉, 〈19.2, 4.5, 2.9, 0.65, 0.0〉, 〈38.4, 4.9, 3.7, 0.71, 0.0〉, 〈38.4, 4.9, 0.0, 0.0, 1.0〉, 〈80.0, 4.2, 3.5, 0.83, 0.0〉}.
The elements of this set have no particular order, but they can be ordered according to the values of their first and last terms in each 5-tuple. The set containing only the bracketed ordered 9-tuple above represents this relation. This representation captures the relations expressed by the spatial ordering of reactions in terms of increasing soluble factor (the two basic relations on which the data is organized in the table: reaction identity and increase in soluble factor). However, unlike the table, further manipulation is required to explain how the ordered data above supports claims of relations among different sets of values. The representation of relations holding among the different properties measured in the experiment can be generated by comparison functions of the set containing the 9-tuple above with sets defined by ordering the nine-element set of reaction 5-tuples on the values for oxygen uptake, P i uptake, or P:O ratio.
This procedure loses one advantage of the table, which allows for reference to all these different kinds of properties and relations in one concise representation. Furthermore, the results of such comparison functions will depend on the exact function used to relate sets. For example, the set ordered on values of phosphate will not be identical to that containing values ordered on soluble factor. How much similarity in the sequence of reaction 5-tuples should an appropriate comparison function require? An evaluative choice must be made; you might allow one mismatch, or specify a limit on the degree to which it can deviate from the trend. These ways of making inferences about the data involve first specifying evaluative functions, and then applying them to the data. The table presents the data in a format that does not require an additional evaluative step to relate data to hypothesis. The tabular format pre-sorts the data into ordered sets by using spatial relations to represent relations among sets of experimental values (features of the same reaction, and quantity of soluble factor). Relations within and among these sets can then be evaluated by using the spatial relations relevant to the table format to guide assessment of relations among sets of values.
So the translation approach falls short even for the table, a figure with linguistic syntax. Translation into a serial linguistic representation can account for the content of the table (no surprise, since it is composed of linguistic terms). But conversion to a serial format fails to capture an important factor in how the content of the table relates to the conclusions the table supports.
Translating the micrograph is a bigger problem. Can you give a linguistic representation of the same state of affairs that the micrograph represents? Because the form of pictorial symbols is correlated exactly with features of their referents, a dense range of extremely complicated properties can be expressed by a pictorial system. This kind of system is extremely useful in science because it allows for the representation of properties, whether or not the vocabulary exists to refer to those properties with linguistic representations. As a result, a verbal description of the shape of the figure will convey less specific information about the shape of the sample than the figure itself.
A more promising alternative is to scan the micrograph. That will generate a list of numerical representations that refer to the location and optical properties of small parts of the micrograph. The list is not a translation, because the picture represents spatial properties of the sample. A mathematical representation of the shape of the sample can be derived from the pixel data, but analysis is required. For example, contours can be identified by searching for transitions in optical density over contiguously located pixels. This requires some specification of what kinds of shifts in optical density over contiguous pixels are relevant.
But this is an additional evaluative step. For both figures, an explanation of how the content of the serial linguistic representations support the conclusions must be supplemented by an evaluative step that is not applied to the figures themselves. This means that analyzing a linguistic expression of a figure's content does not provide an adequate explanation of how the visually represented data supports the hypothesis. The kind of reasoning involved is not captured.
Besides translation, the other way to account for the use of figures without analyzing them as representations supporting the conclusion is to deny that they function as representations and identify some other role for them to play in confirmation. For example, you might claim that the micrograph is just an object to be observed, that statements about the micrograph operate in the argument, but that the micrograph is not actually part of the argument.
This approach would reconstruct the argument in this way:
P1. There exist circular light areas on the micrograph.
P2. Light areas on micrographs are produced as a result of electrons exposing film after having passed through the sample.
P3. Electrons pass through samples in greater density when they are not deflected by stain.
P4. The electron-dense stain used is excluded by biological structures.
C. There are spherical particles in mitochondria.
The conclusion, a linguistic reference to mitochondrial particles, is not drawn from the figure itself but from a series of statements, some of which refer to the figure. What role does the micrograph play? On this account the reproduction of the micrograph allows others to make their own observations of it, and so affirm the observation statements necessary to the reconstructed argument.
This reconstruction has yielded a linguistic argument supporting the claim that spherical particles are attached to mitochondrial membranes. But there is a problem. The reconstructed argument includes a statement that refers to perceptible features of the figure instead of incorporating the figure as a representation in the argument. The strength of the reconstructed argument depends on limiting observation statements about the figure to claims appropriate to the fact the figure represents. One could make lots of observations about this pattern of light and dark areas, but the perceptible features that are relevant to the argument are those used to understand the figure as a representation: the features that allow for identification of an image as an instance of a particular character and correlate that with its referent. It is only by understanding the electron micrograph as a representation of a scanned sample, that we could choose the visible features described in the reconstructed argument.
The interpretation that must be applied to electron micrographs in order to comprehend them as representations of sample structure is dependent on the causal relations correlating the image form with the structure of scanned samples. But the linguistic reconstruction account requires causal claims not just to function as premises in the argument as explicitly stated in the linguistic reconstruction, but also to direct observation of the figure in generating observation claims about the micrograph. This means that some premises (those representing the causal relations between figure and object, e.g., P2) are also determining which premises about perceptible features of the micrograph are significant. But they are not determined in the sense of entailment, a logical relation. Rather, some premises in the linguistic reconstruction are used to direct perception. The interpretation of visible form is essential to the evidential relevance of figures, because it is the interpretation that links the form of the figure with its content through the correlation of visible features (especially spatial relations) in the figure with features of the referent. This is essential to the evidential role of the figure, according to my representational approach. It is also essential to the reconstructive approach, because it is necessary to account for the strength of the linguistic reconstruction, since only those observations about the figure are evidentially relevant. This interpretation of visible form is explained by the symbol-referent relation but is not addressed by the linguistic reconstruction of the argument, which treats figures as if they were objects of observations but not representations. Thus the linguistic reconstruction approach is ultimately parasitic on treating figures as representations, because the proposed role as observed objects depends on their being comprehended as representations in the first place.
5. Conclusion
Analysis of visual representations as such is necessary, because the two-dimensional format, which correlates visible spatial relations in the figure with features of the referent, makes a distinct contribution to confirmation. The alternatives fail in capturing the content of figures, or in clarifying how that content is related to the conclusion. This method showed two ways the two-dimensional format of visual representations contributes to the role of figures as evidence. First, spatial relations in a figure are used to represent relations among parts of a referent of visual representations. This is exemplified clearly by Table 2—linguistic terms are put into spatial relations, which allows for the representation of relations holding between various components of the experiment. Second, the form of figures can be causally correlated with the referent, so that figures can play a role similar to that of observation claims: the representation of properties of particular individuals, which are justified in terms of the procedures used to produce them (Figure 1). Such figures are made as a result of causal interactions that link the form of the representation to its content.
Looking at how the representational features of figures contribute to confirmation is just a first step in explaining their role in scientific arguments. But it should be clear that the old saying that a picture is worth a thousand words is a red herring rather than an underestimate. It is not a reduction in number of representations that explains why figures are used rather than text, but the distinctive form of visual representations and its contribution to evidential support.