

1 Introduction
Cross-linguistically, labial (or rounding) harmony is subject to a number of restrictions (Steriade Reference Steriade1981, Kaun Reference Kaun1995, Reference Kaun2004, Walker Reference Walker2001). Most importantly, the class of trigger and target vowels is restricted by height and/or backness. Kaun (Reference Kaun1995, Reference Kaun2004) contends that the best triggers are perceptually weak, with harmony extending the temporal span of these weak contrasts. Thus vowels whose [round] feature is only weakly realised are more likely to trigger harmony; in her terms, ‘bad vowels spread’ (1995: 1).
In this paper I argue, like Kaun, that perceptual weakness motivates labial harmony. However, I contend that perceptual weakness is more appropriately defined in dispersion-based terms (Liljencrants & Lindblom Reference Liljencrants and Lindblom1972), rather than the feature-based representations used in Kaun's analysis. I present four kinds of evidence to justify this claim. First, using gradient labial harmony data from colloquial Kazakh, I show that the dispersion-based model outperforms Kaun's model in a Maximum Entropy Harmonic Grammar (Goldwater & Johnson Reference Goldwater, Johnson, Spenader, Eriksson and Dahl2003). Second, I show that the proposed model also accounts for categorical harmony in four non-Turkic languages. Third, I discuss labial harmony in Mayak (Andersen Reference Andersen1999), which cannot be accounted for under Kaun's analysis, but falls out naturally from the dispersion-based analysis. In Appendix C, I outline the typological predictions of the dispersion-based analysis, which provide new insight into the typology of labial harmony missed by Kaun's analysis.Footnote 1
The paper is organised as follows. In §2, I describe vowel harmony in colloquial Kazakh. In §3, I discuss previous work on labial harmony, in particular Kaun (Reference Kaun1995, Reference Kaun2004). In §4, I analyse Kazakh using Kaun's feature-based analysis, and in §5, I demonstrate that the dispersion-based analysis is superior. §6 extends the analysis to account for harmony in four non-Turkic languages, and §7 discusses data that is problematic for Kaun's analysis. In §8, I relate the proposed analysis to other dispersion-theoretic work, and in §9, I conclude the paper.
2 Kazakh vowel harmony
2.1 Background and vowel inventory
Kazakh, like most Turkic languages, exhibits both palatal (backness) harmony and labial harmony, which is the focus of this paper. Complex words are formed via suffixation. As a result, these two harmonies extend rightward from roots to suffixes.
Writers have disagreed on the number of vowel phonemes in the language, which ranges from eight to eleven (Menges Reference Menges1947, Dzhunisbekov Reference Dzhunisbekov1972, Kirchner Reference Kirchner1998, Kara Reference Kara2002, McCollum Reference McCollum2015, Muhamedowa Reference Muhamedowa2015). Writers typically agree, though, on a common set of eight vowels, often transcribed as /ɪ e ʏ ø ɑ ɯ ɔ ʊ/. I transcribe these vowels as /ɪ ɪː ʏ ʏː ɑː ə ɔː ɔ/, with a length distinction replacing what has traditionally been seen as a height distinction. I justify this with an acoustic analysis of the vowel inventory. Three additional vowels, /i æ u/, might be phonemic in the language. As these three vowels are lexically rare, and peripheral to the harmony system (Dzhunisbekov Reference Dzhunisbekov1972: 39–41, Kirchner Reference Kirchner1998: 322), they are excluded from further discussion.
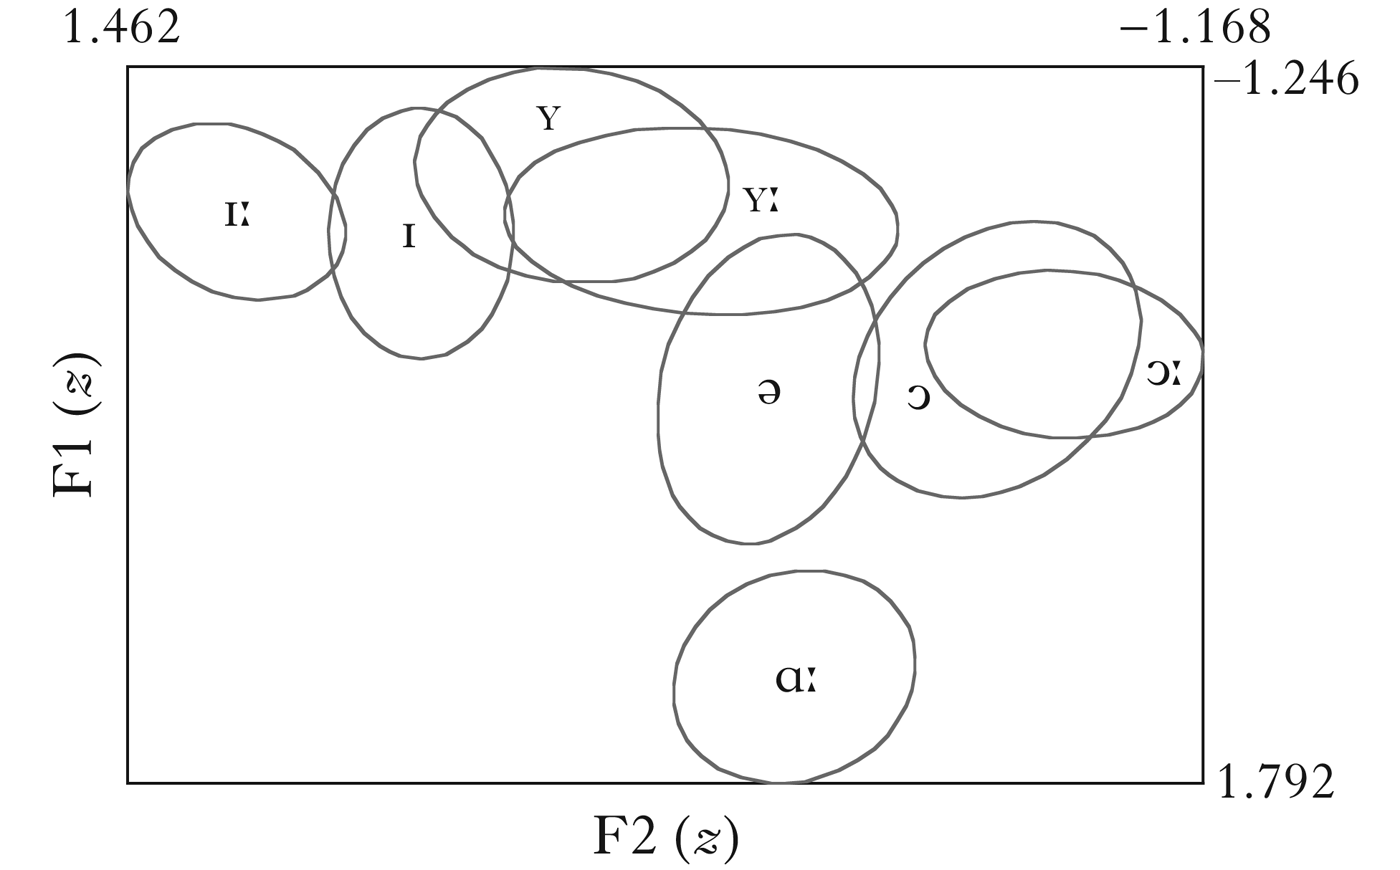
Data was collected from eleven native speakers (mean age 33.5, range 19–46) in southeastern Kazakhstan, using semi-formal, conversationally based elicitation in the target language. Acoustic data is presented below. Root vowel data was elicited to assess the general shape of the vowel space. Mean F1–F2 for the eight vowels under study is shown in Fig. 1.
Mean root vowel F1–F2 (z) with ellipses showing 1 SD (n = 2490).

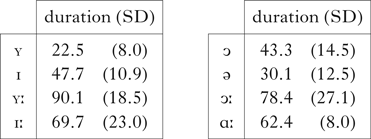
As noted above, the distinction between high and mid vowels in Turkic has been neutralised in colloquial Kazakh. The historically high vowels have lowered, resulting in a length distinction where historically mid vowels are long and historically high vowels are short (Johanson Reference Johanson1998: 94, Kara Reference Kara2002: 9). Figure 1 shows that vowel height, defined in terms of F1, is insufficient to differentiate these vowels. Instead, vowel length distinguishes the historical high from non-high vowels. The historical high vowels are significantly shorter (Dzhunisbekov Reference Dzhunisbekov1972: 75, Kirchner Reference Kirchner1998: 319, McCollum & Chen 2016, Washington Reference Washington2016). Table I presents duration data for eight vowels produced in analogous environments by Speaker 11.
Mean duration (ms), with SDs, of initial-syllable vowels in Kazakh (n = 32).

When averaged within the two putative lengths, mean duration was 35.9 ms for the short vowels, and 75.2 ms for the long vowels (see also McCollum & Chen Reference McCollum and Chen2018). The absolute duration of the Kazakh vowels is short, but the duration ratio of long-to-short vowels in the fieldwork data is 2.1:1, which parallels length contrasts in a number of other languages (Hadding-Koch & Abramson Reference Hadding-Koch and Abramson1964, Abramson & Ren Reference Abramson and Ren1990).
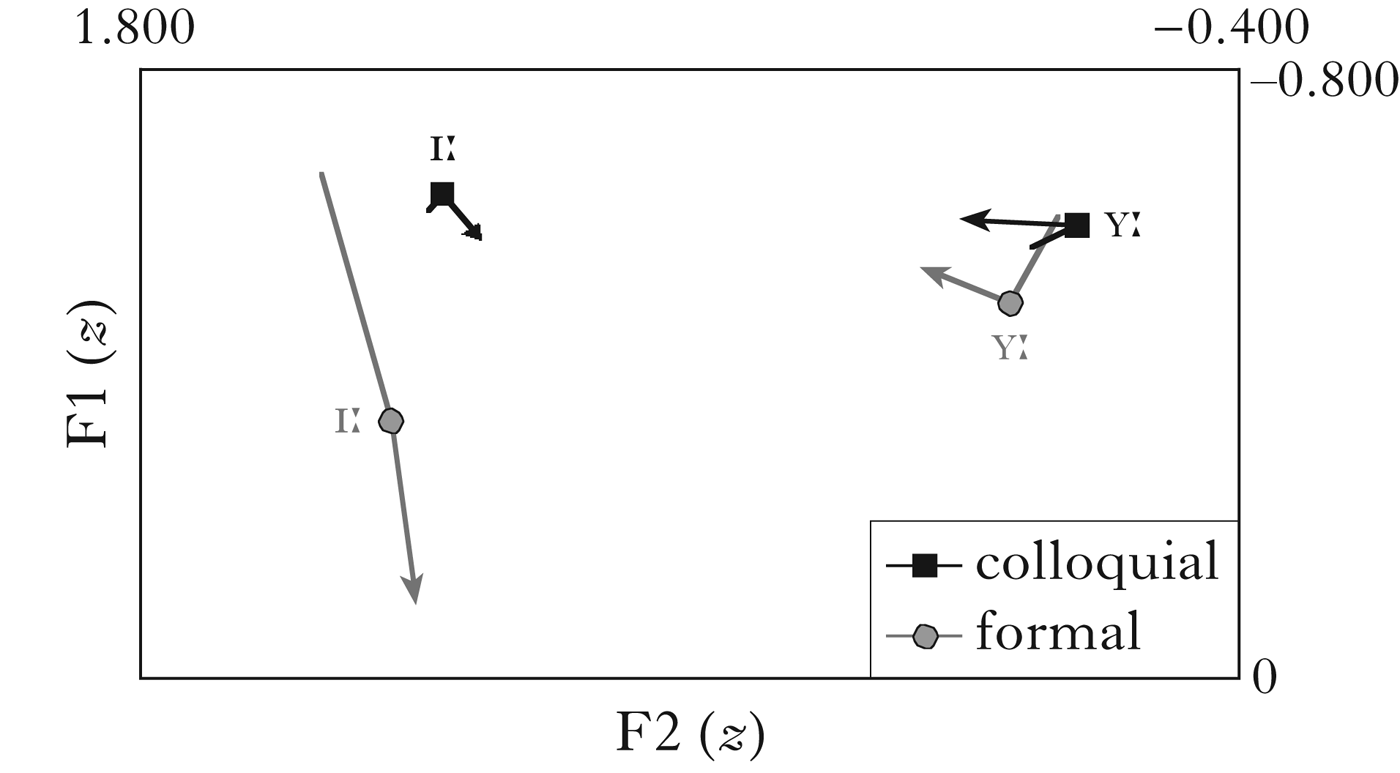
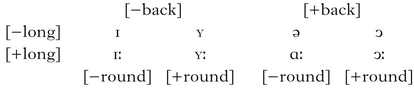
In formal registers, the long vowels /ɪː ʏː ɔː/ are reportedly distinguished from the short vowels by diphthongisation, particularly in word-initial position. In formal speech, /ɪː/ is realised as [jɪː], while /ʏː/ and /ɔː/ are realised as [wʏː] and [wɔː] (Dzhunisbekov Reference Dzhunisbekov1980: 21, Vajda Reference Vajda, Kaplan and Whisenhunt1994: 619–624). In colloquial speech, though, these vowels do not typically surface as diphthongs. Figure 2 compares the realisation of initial-syllable /ɪː ʏː/ in colloquial speech with formal speech collected in the UC San Diego phonetics lab. Vowels were measured in matching syllabic contexts, and measurements were taken at the 25, 50 and 75% points of each vowel. In colloquial speech, F1–F2 of both vowels show only slight movement, while in formal speech, the spectral properties of /ɪː/ are far more dynamic. With these facts in mind, I treat these vowels as monophthongs, and use the features [back], [round] and [long] to represent the eight vowels that participate in harmony, as shown in (1).
(1)

Initial-syllable /ɪː ʏː/ in colloquial and formal Kazakh.

2.2 Vowel harmony
2.2.1 Palatal harmony
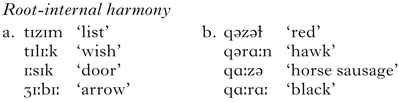
Kazakh words usually contain vowels from only one palatal set (exceptions include compounds, unassimilated loans and a few invariant morphemes). As palatality is determined by the root, and labiality is at least partially dependent on the root, only one feature, length, is fully contrastive in non-initial syllables. Tauto- and heteromorphemic palatal harmony are illustrated in (2) and (3), on the assumption that non-initial root vowels, like suffixes, are targets for harmony (Harrison & Kaun Reference Harrison and Kaun2000, Kabak & Weber Reference Kabak and Weber2013; cf. Clements & Sezer Reference Clements, Sezer, van der Hulst and Smith1982). In (2), all possible combinations of vowel length are exemplified for unrounded roots. Harmony among front vowels is shown in (2a), and among back vowels in (2b).
(2)
(3) shows harmony between unrounded roots and suffixes. In the locative suffix in (3a), long back [ɑː] alternates with long front [ɪː]. In the accusative suffix in (3b), short back [ə] alternates with short front [ɪ]. Iterative palatal harmony is exemplified in (3c).Footnote 2
(3)
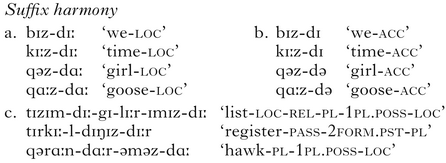
In summary, palatal harmony in Kazakh is iterative, and not sensitive to length restrictions. As will be evident in the next subsection, labial harmony is subject to restrictions not enforced on palatal harmony.
2.2.2 Labial harmony
Menges (Reference Menges1947: 59–64) and Korn (Reference Korn1969: 101–102) report that labial harmony is robust, but more recent writers have noted increasing restrictions on harmony (Dzhunisbekov Reference Dzhunisbekov1972, Kirchner Reference Kirchner1998, Kara Reference Kara2002, McCollum Reference McCollum2015).Footnote 3 Specifically, labial harmony in contemporary Kazakh is confined to a smaller domain of application (Balakaev Reference Balakaev1962: 100–105, Dzhunisbekov Reference Dzhunisbekov1972, Vajda Reference Vajda, Kaplan and Whisenhunt1994: 633–634, McCollum Reference McCollum2015; cf. Abuov Reference Abuov1994), and harmony occurs more consistently within roots than across morpheme boundaries (Vajda Reference Vajda, Kaplan and Whisenhunt1994, McCollum Reference McCollum2015).
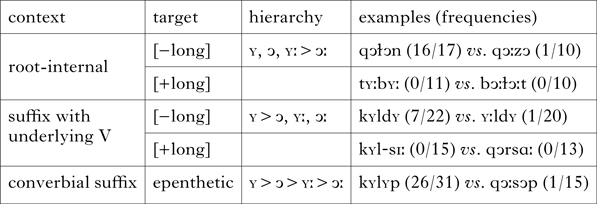
Within roots, several generalisations emerge from (4) below. First, the short vowels in (4a) are more likely to undergo harmony than the long vowels in (4b). Second, harmony is generally triggered by the front vowels /ʏ ʏː/ as well as by the short back vowel /ɔ/, but not by the long back vowel /ɔː/, as in the final form in (4a). The frequency data reported below are counts of impressionistic transcriptions after initial data collection. These judgements were then confirmed by comparing acoustic properties of non-initial vowels to those of underlying (i.e. initial) vowels (Zsiga 1997: 234–235). (In (4) and similar figures, the frequency column gives the number of occurrences of tokens with harmony and the total number of tokens in the data.)
(4)
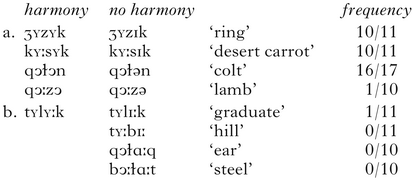
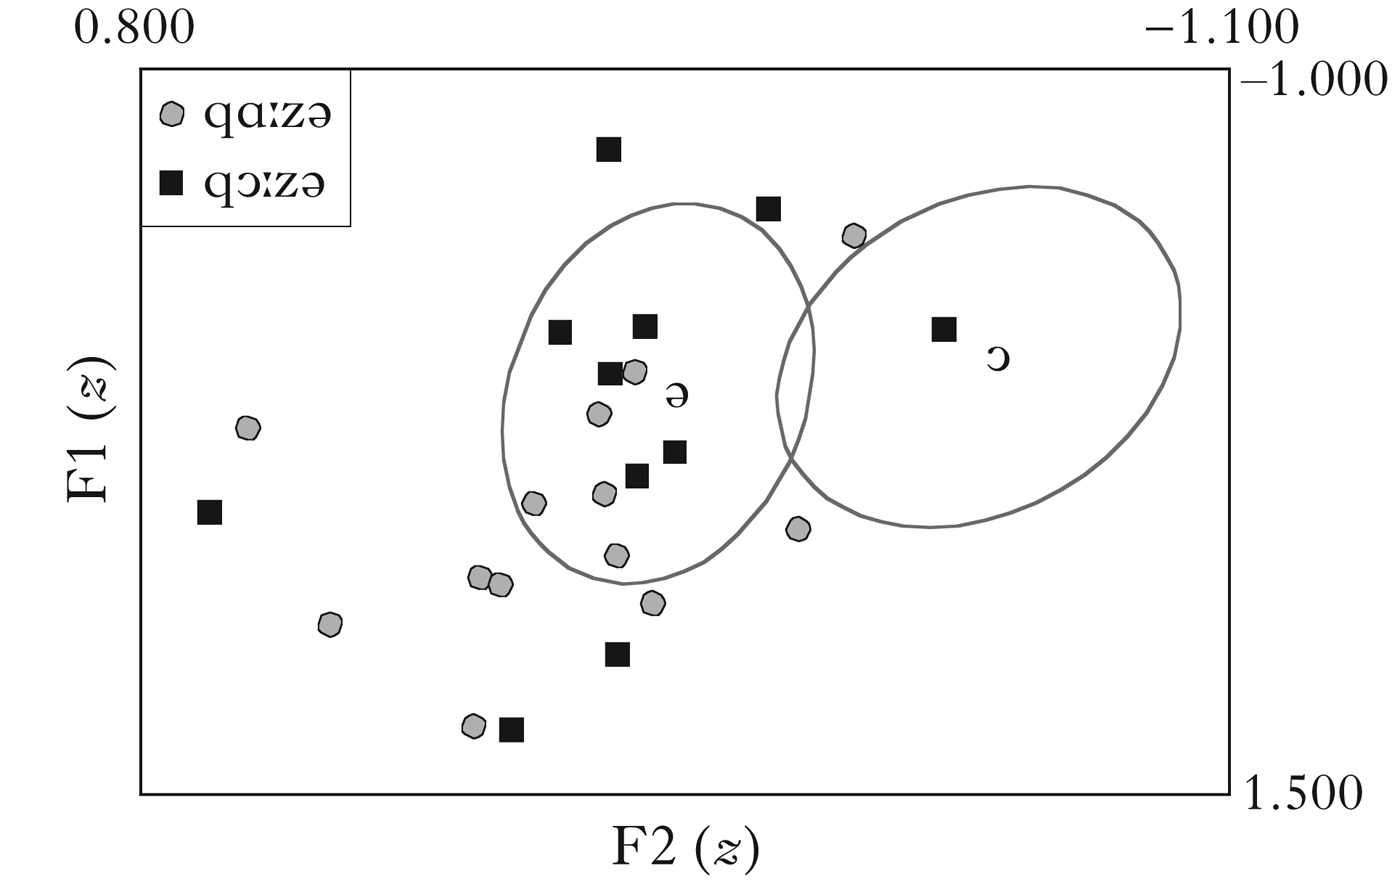
The inertness of /ɔː/ as a trigger for harmony is further shown below. Figure 3 plots F1–F2 of the second-syllable vowels in /qɑːzə/ and /qɔːzə/. Assuming that the F1–F2 values of vowels derived from harmony approximate those of underlying vowels, then with the input /qɔːzə/ we expect labial harmony to produce vowels more similar to /ɔ/ than /ə/.Footnote 4 However, in almost every case, F1–F2 of short back vowels after /ɔː/ more closely resemble initial /ə/. The second-syllable vowel after /ɔː/ approximates F1–F2 of initial /ɔ/ in only one case.
F1–F2 scatterplot of second-syllable /ə/ in [qɔːzə] and [qɑːzə] (n = 24) compared to mean initial-syllable /ə/ and /ɔ/, with ellipses showing 1 SD (n = 365).

Labial harmony on suffixes, shown in (5), is even more restricted. The short vowel of the past tense suffix in (5a, b) and the long vowel of the conditional suffix in (5c) typically surface as unrounded, regardless of initial vowel roundness. In the longer words in (5d), the same generalisations hold – outside of roots, harmony is infrequent, even after /ʏ/. If every surface [ʏ] vowel triggered harmony, we would expect the accusative to undergo assimilation in the first form in (5d), [ʒʏzʏktɪ]. Since it does not, harmony is triggered by the initial syllable only.
(5)
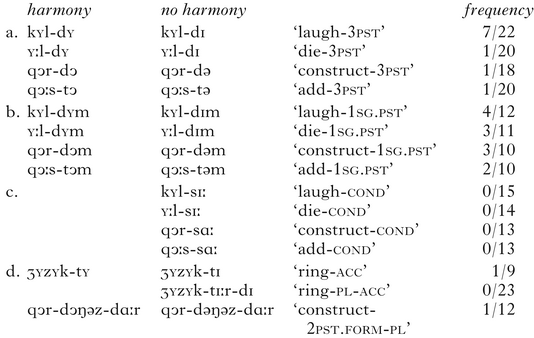
This data suggests a coarticulatory effect of labial consonants, since frequency of harmony increases in (5b), where the suffix is a labial consonant. However, labials do not, on their own, trigger harmony, as illustrated by words like [tɪzɪm] and [ʒɪːbɪː] in (2a) (cf. Clements & Sezer Reference Clements, Sezer, van der Hulst and Smith1982 for Turkish). More generally, the data in (4), along with Fig. 3, indicate that /ɔː/ does not usually trigger harmony. In contrast, /ʏ ɔ ʏː/ do trigger harmony to varying degrees.
Across morpheme boundaries, harmony is more frequently attested in the converbial and passive-reflexive suffixes, /-p/ and /-n~-l/ respectively. The converbial suffix is realised as [-p] in (6a, b). After consonant-final roots, this suffix results in an illicit coda cluster, which is repaired by epenthesis in (6b–d). The epenthetic vowel is always short, and agrees with the root in backness, and optionally in rounding, as in (6c).
(6)

Labial harmony thus typically applies to short vowels within roots, except after /ɔː/. Harmony applies less often to suffixes. Initial vowels exert varying degrees of assimilatory force, with /ʏ/ triggering harmony more often than /ɔ ʏː ɔː/. From the data presented above, summarised in Table II, the following strength hierarchy for triggers emerges: /ʏ/ > /ɔ/ > /ʏː/ > /ɔː/ (or perhaps /ʏ/ > /ɔ, ʏː/ > /ɔː/, since the difference between /ɔ/ and /ʏː/ is small). Generally, short vowels are better triggers than long vowels, and front vowels are better triggers than back vowels.
Synopsis of Kazakh data.

In the following section I relate these findings to the cross-linguistic asymmetries discussed in Kaun (Reference Kaun1995, Reference Kaun2004).
3 Background
3.1 Labial harmony
Most analyses of labial harmony have converged on two separate generalisations. First, labial harmony is parasitic, in that its application depends on the agreement of some other feature(s), in many cases, vowel height (Ultan Reference Ultan1973: 55, Steriade Reference Steriade1981, Cole & Trigo Reference Cole, Trigo, van der Hulst and Smith1988, van der Hulst & Smith Reference Hulst, Smith, Coopmans and Hulk1988, Cole & Kisseberth Reference Cole and Kisseberth1994: §5, van der Hulst & van der Weijer Reference Hulst, van de Weijer and Goldsmith1995: 523, Finley Reference Finley2008b: §9, Jurgec Reference Jurgec2011: ch. 8). For instance, in Kachin Khakass (Korn Reference Korn1969), labial harmony applies only when both trigger and target are high.
Second, phonetic grounding has factored significantly into numerous accounts of labial harmony (Kaun Reference Kaun1995, Reference Kaun2004, Walker Reference Walker2001, Reference Walker2011, Finley Reference Finley2008a). Kaun (Reference Kaun1995: 1) proposes a strong relationship between a vowel's perceptual weakness and its propensity to trigger harmony. Typologically, Kaun connects cross-linguistic patterns of labial harmony with the phonetic properties of round vowels (cf. Cole & Trigo Reference Cole, Trigo, van der Hulst and Smith1988, Nevins Reference Nevins2010, Ko Reference Ko2012 for analyses without functional grounding).
In many languages, restrictions on labial harmony are assumed to be featural, but Vaux (Reference Vaux1993) suggests that it is also constrained by systemic factors. He contends that harmony in Turkic targets non-high vowels in languages with three distinct vowel heights, but not in those with only two phonological heights. According to Vaux, the harmony pattern is in part derivable from the nature of the inventory. The use of systemic considerations will play a crucial role in the analysis presented in §5.
3.2 Typological generalisations
As noted above, Kaun argues that perceptually weak vowels are better triggers for harmony, and, conversely, that perceptually salient vowels are better targets. In this way, harmony serves to extend the temporal span of a weak contrast to improve chances of reliable discrimination (Suomi Reference Suomi1983). Kaun (2004: 92) proposes the five generalisations in (7) to account for cross-linguistic labial harmony patterns.
(7)
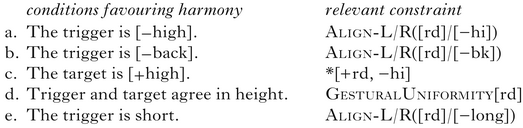
I will discuss Kaun's generalisations in order. Addressing the first two, Linker's (Reference Linker1982) articulatory study finds less lip compression and protrusion for front and non-high vowels, i.e. they are less rounded articulatorily than back and high vowels. Kaun also references two perception-related findings from Terbeek (Reference Terbeek1977), who reports, first, that high vowels were perceived as more rounded than non-high vowels, and, second, that back vowels were perceived as more rounded than front vowels. Kaun argues that where the articulatory lip rounding gesture is smaller in magnitude, its acoustic consequences are more subtle, leading to greater perceptual difficulty. In sum, because non-high and front vowels are produced with less lip rounding, they are perceptually less salient than high and back vowels, making them better triggers of harmony.
As for Kaun's third generalisation, (7c), she contends that, in contrast to trigger asymmetries, target asymmetries derive from perceptual salience. Since high rounded vowels involve more lip rounding, and are perceived as more rounded, Kaun argues that high vowels better cue the roundness of the triggering vowel.
Fourth, Kaun motivates the dispreference for cross-height labial harmony in (7d) in the phonetic implementation of the feature [round] (see also Steriade Reference Steriade1981: 5). She argues that labial harmony involves multiple linking of a single [round] feature, and because lip gestures differ according to vowel height, the phonetic modulation of the lips to accommodate these differences militates against cross-height harmony (1995: §5.6). The importance of this generalisation is corroborated by McCollum (Reference McCollum, Jesney, O'Hara, Smith and Walker2017), who demonstrates in a statistical analysis of 61 languages with labial harmony that the preference for same-height harmony is by far the most important of Kaun's typological generalisations. The other generalisations in (7) are genetically and areally more restricted, but this preference spans the typology.Footnote 5
In cases like Turkish labial harmony, there is no apparent preference for same-height harmony, since round vowels of both heights trigger harmony on high-vowel suffixes. However, in a study on harmony in loanwords in Turkish, Kaun (Reference Kaun1999: 97) finds that high vowels are better triggers for regressive labial harmony than non-high vowels (see also Yavaş Reference Yavaş1980, Clements & Sezer Reference Clements, Sezer, van der Hulst and Smith1982: 247). Kaun finds that, for all speakers, high vowels obligatorily triggered harmony, but non-high vowels obligatorily triggered harmony for only two of nine speakers. Kaun construes this as evidence for a same-height harmony preference in Turkish that is not manifest in the native lexicon.
Lastly, the length asymmetry noted in (7e) accounts for several length-based asymmetries reported in Li (Reference Li1996) and Harrison (Reference Harrison2000). In general, Kaun's generalisation may relate to phonetic studies by Bennett (Reference Bennett1968), Ainsworth (Reference Ainsworth1972) and Hillenbrand et al. (Reference Hillenbrand, Clark and Houde2000), which suggest that shorter vowels are more difficult to identify, particularly in crowded portions of the vowel space.
In sum, perceptual weakness undergirds trigger-related asymmetries, while perceptual salience motivates target asymmetries. In the next section, I analyse gradient labial harmony in Kazakh using the feature-based constraints in (7), which I then compare with an alternative, dispersion-based analysis in §5.
4 Feature-based analysis
4.1 Formal feature-based analysis
4.1.1 Constraint set
The data from §2.2.2 is intuitively amenable to Kaun's analysis, since both short and front vowels are better triggers for harmony. In Kaun (Reference Kaun2004), these preferences are encoded via conditional alignment constraints, in addition to the general alignment constraint in (8a) (Kirchner Reference Kirchner1993, McCarthy & Prince Reference McCarthy and Prince1993). Kaun makes alignment conditional upon the presence of certain features in the trigger. I use the features [−back] and [−long] to define the set of conditional alignment constraints necessary for a feature-based analysis (cf. Walker Reference Walker2011: 247–251). The constraint in (8b) encodes the preference for front vowel triggers; (8c) encodes the preference for short triggers.
(8)
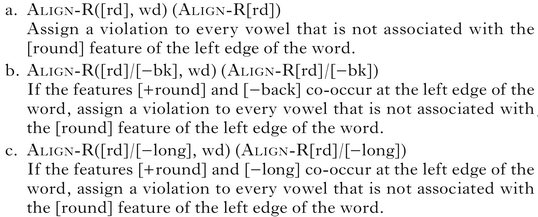
The three markedness constraints in (9) will also figure prominently in the analysis. First, CrispEdge([rd], morph) in (9a) bans the extension of a labial gesture across a morpheme boundary (Itô & Mester Reference Itô, Mester, Kager, van der Hulst and Zonneveld1999, Walker Reference Walker2011). Harmony processes are often sensitive to morphological boundaries. For instance, in Yeyi, a Bantu language of southern Africa, regressive assimilation of /i/ to [u] consistently obtains within roots, but is variable across a root boundary (Seidel Reference Seidel2008: 47–48). Further, categorical blocking by morphology is reported in a variety of languages (Archangeli & Pulleyblank Reference Archangeli, Pulleyblank and de Lacy2007: 365, Rose & Walker Reference Rose and Walker2011: §4.2.2). Additionally, there is evidence to indicate that articulatory gestures are more tightly coordinated within morphemes than across morphological boundaries (Cho Reference Cho2001).
(9)
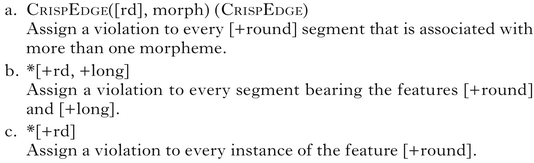
The second markedness constraint used in the analysis is *[+rd, +long] in (9b), which penalises long round vowels. In effect, this constraint replaces Kaun's *[+rd, −high] constraint in (7c), since the historically mid vowels are now long vowels. As in Kazakh, short vowels undergo harmony in Maltese (Puech Reference Puech1978), but long vowels do not.
Third, the general markedness constraint in (9c) against [+round] vowels penalises harmony on underlying as well as epenthetic vowels.
In addition to the above markedness constraints, the Ident constraint in (10) (McCarthy & Prince Reference McCarthy, Prince, Beckman, Dickey and Urbanczyk1995) is used in the analysis.
(10)

This constraint penalises harmony on underlying vowels, like that of the past tense suffix, but not on epenthetic vowels, like that of the converbial suffix.Footnote 6 Epenthetic vowels often pattern differently from underlying vowels in harmony systems (Vaux Reference Vaux1998: 169, Finley Reference Finley2008a). This is evident in the related language, Uyghur, where labial harmony targets epenthetic vowels only (Hahn Reference Hahn1991: 49–51).
4.1.2 Gradience and Maximum Entropy Harmonic Grammar
Gradience is problematic for classical Optimality Theory (Prince & Smolensky Reference Prince and Smolensky1993), since strict domination entails categorical outcomes. Early attempts to model gradience include Anttila (Reference Anttila, Hinskens, van Hout and Wetzels1997), which uses partial ordering of constraints, and Boersma & Hayes (Reference Boersma and Hayes2001), which gives each constraint a range of overlapping strictness bands. More recent work has used weighted constraints in Harmonic Grammar (HG; Legendre et al. Reference Legendre, Miyata and Smolensky1990, Pater Reference Pater2009) to derive probabilistic predictions (Goldwater & Johnson Reference Goldwater, Johnson, Spenader, Eriksson and Dahl2003, Coetzee & Pater Reference Coetzee and Pater2011, Boersma & Pater Reference Boersma, Pater, McCarthy and Pater2016). The particular version of HG used throughout the analysis is Maximum Entropy Harmonic Grammar (MaxEnt HG; Goldwater & Johnson Reference Goldwater, Johnson, Spenader, Eriksson and Dahl2003).
MaxEnt HG assigns each output candidate a harmony score, ℋ. The harmony of each candidate is calculated using the equation in (11) (Hayes & Wilson Reference Hayes and Wilson2008: 383).
(11)
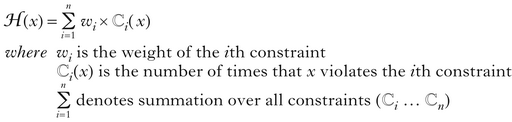
Thus the harmony score for each output candidate is the summed total of constraint violations multiplied by their respective weights. All constraint violations are assumed to be negative.
From the harmony score, ℋ(x), the probability of output candidate x, p(x), is calculated by taking the exponent of the harmony score normalised by the summed score of the exponents of all output candidates, y, Y1…Y M, in (12).
(12)
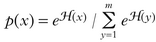
Harmony scores with more negative values produce smaller numerators, which result in lower probabilities. Thus, the ideal candidate would have a harmony score of zero, incurring no violations of faithfulness or markedness constraints. The relation between ℋ(x) and p(x) is contingent upon the set of output competitors under examination. Therefore, a harmony score of, for instance, −5 may represent a high-probability outcome if other outputs have significantly lower harmony scores, but an extremely low-probability outcome if other outputs have harmony scores greater than −5.
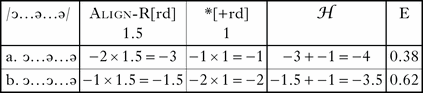
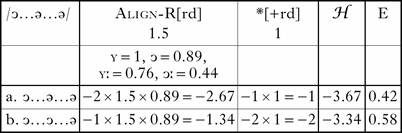
To exemplify how MaxEnt models compute probabilities, consider the illustrative tableau in (13). Candidate (a) violates Align-R[rd] twice, because two non-initial vowels do not undergo harmony, while (b) violates Align-R[rd] only once. These violations are multiplied by the weight associated with Align-R[rd], 1.5, which yields −3 and −1.5 respectively. (a) incurs one violation of *[+rd], while (b) incurs two. Since *[+rd] has been assigned a weight of 1, the candidates incur penalties of −1 and −2 respectively. The sum total of all penalties incurred from these two constraints gives each candidate's harmony score. The probability of each candidate is derived from the equation in (12): the probability of candidate (a) is e−4/(e−4 + e−3.5), i.e. 0.38, and the probability of (b) is e−3.5/(e−4 + e−3.5), i.e. 0.62. Thus (13) predicts that candidate (b) will surface 62% of the time.Footnote 7
(13)
4.2 Constraint weights
The constraints presented in (8)–(10) were used to assess input–output mappings. Each constraint was assigned a weight, in order to maximise log-likelihood of the model. The log-likelihood is the summed product of log probabilities, log(p(x)), and the attested frequencies of the candidates under examination, which results in a negative number with a large absolute value.Footnote 8 As the search space for MaxEnt models is free of local maxima (Della Pietra et al. Reference Pietra, Stephen and Lafferty1997), a variety of optimisation algorithms converge on one solution. Accordingly, I used Excel's Solver add-in (Fylstra et al. Reference Fylstra, Lasdon, Watson and Waren1998) to find the maximum (least negative) log likelihood, using the Generalised Reduced-Gradient algorithm.Footnote 9 In Wilson & George's (Reference Wilson and George2009) MaxEnt Grammar Tool, constraint violations can only be integers, limiting the precision of the calculations in §5, which rely on non-integer values.
The optimal weights assigned to the training data are shown in (14).
(14)

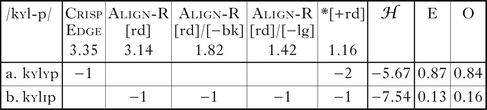
Given the weights in (14), the analysis is exemplified by the two tableaux below. In (15), Kaun's model fits the [kʏlʏp] ~ [kʏlɪp] data remarkably well, diverging from the actual probability by only 0.03.
(15)
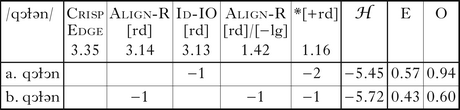
In (16), the output forms from the input /qɔɫən/ are considered. In contrast to (15), the fit from Kaun's analysis differs substantially from the observed frequency. Harmony obtains 94% of the time in this word, rather than the predicted 57% in Kaun's analysis.
(16)
One significant idealisation was made – only two output candidates were evaluated, following McPherson & Hayes (Reference McPherson and Hayes2016). In a fuller analysis, additional (highly weighted) constraints against unrounding root vowels and complex codas would penalise the potential but unattested forms [kɪlɪp] and [kʏlp].
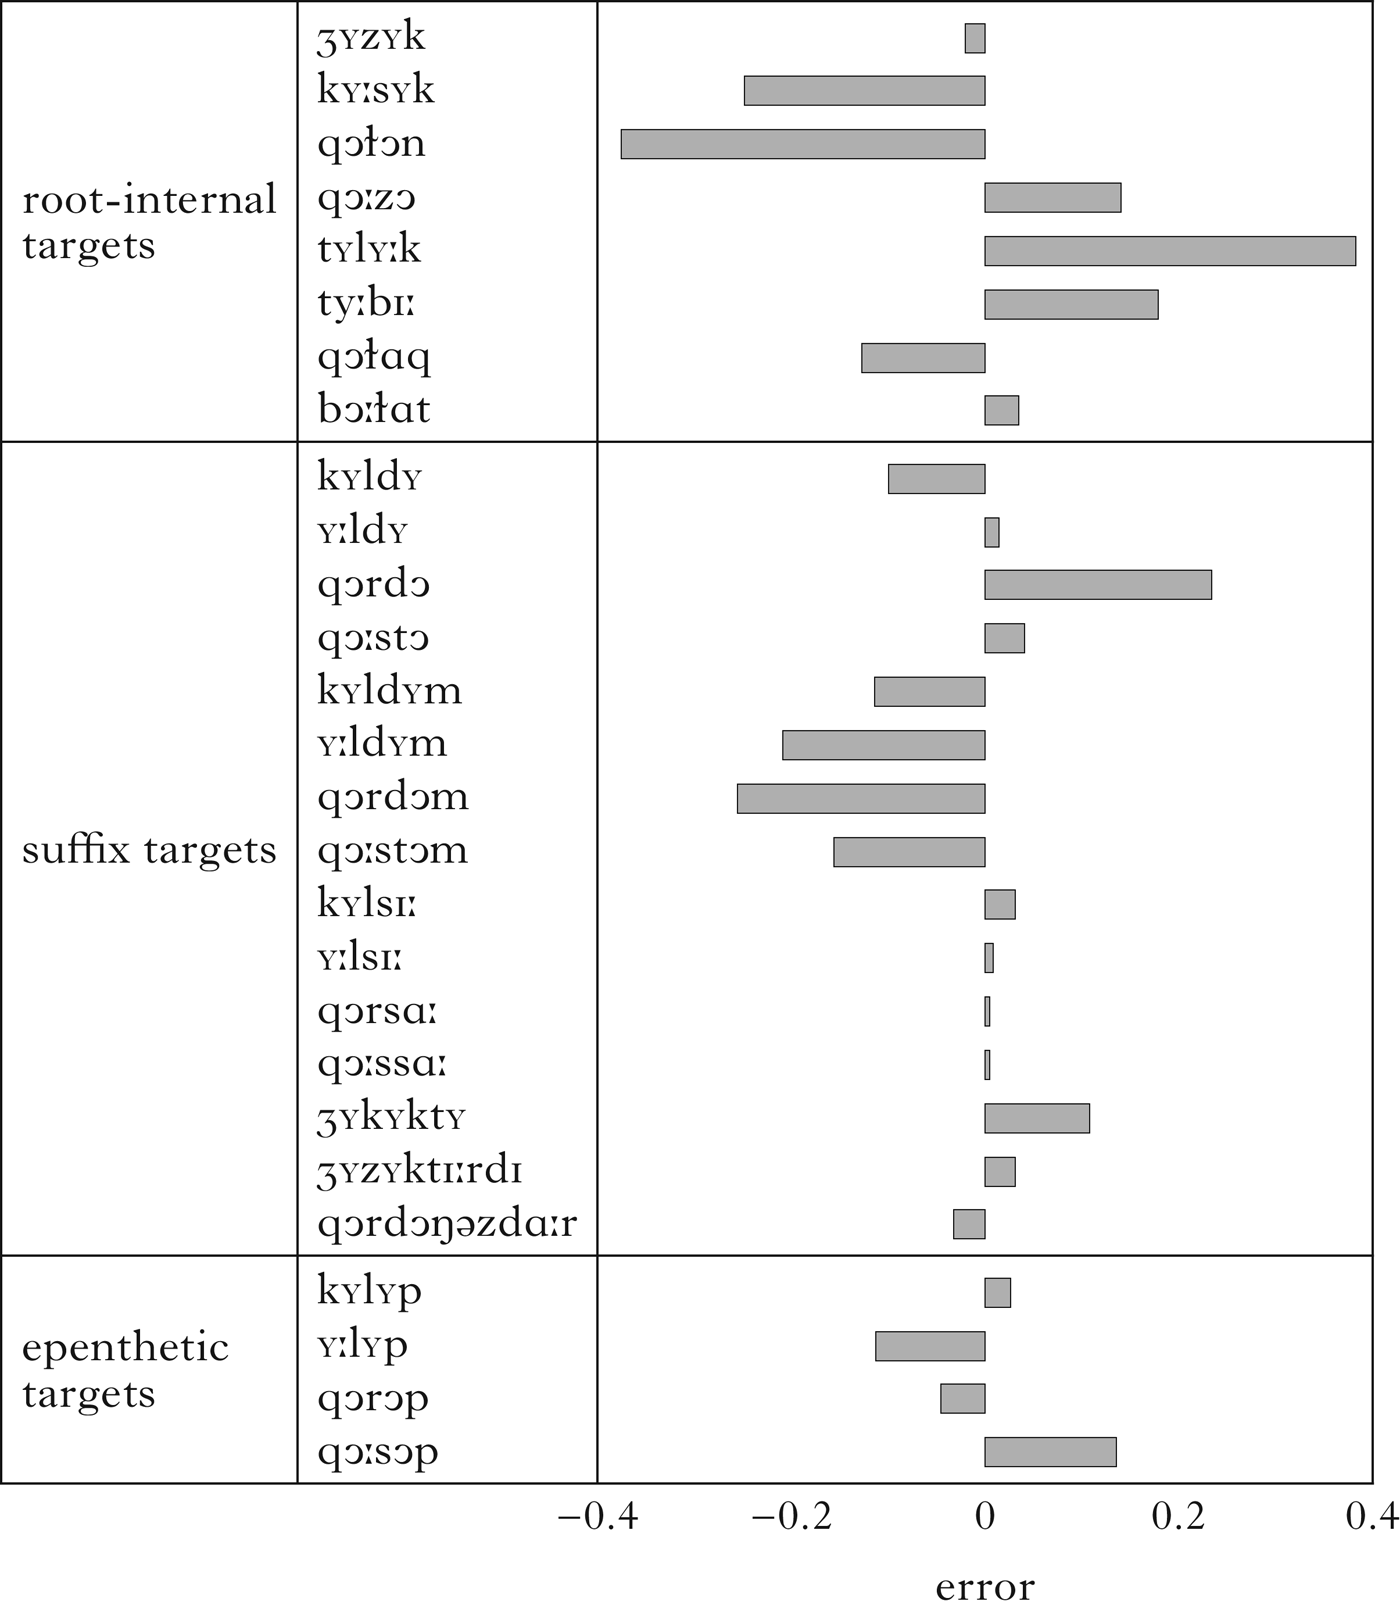
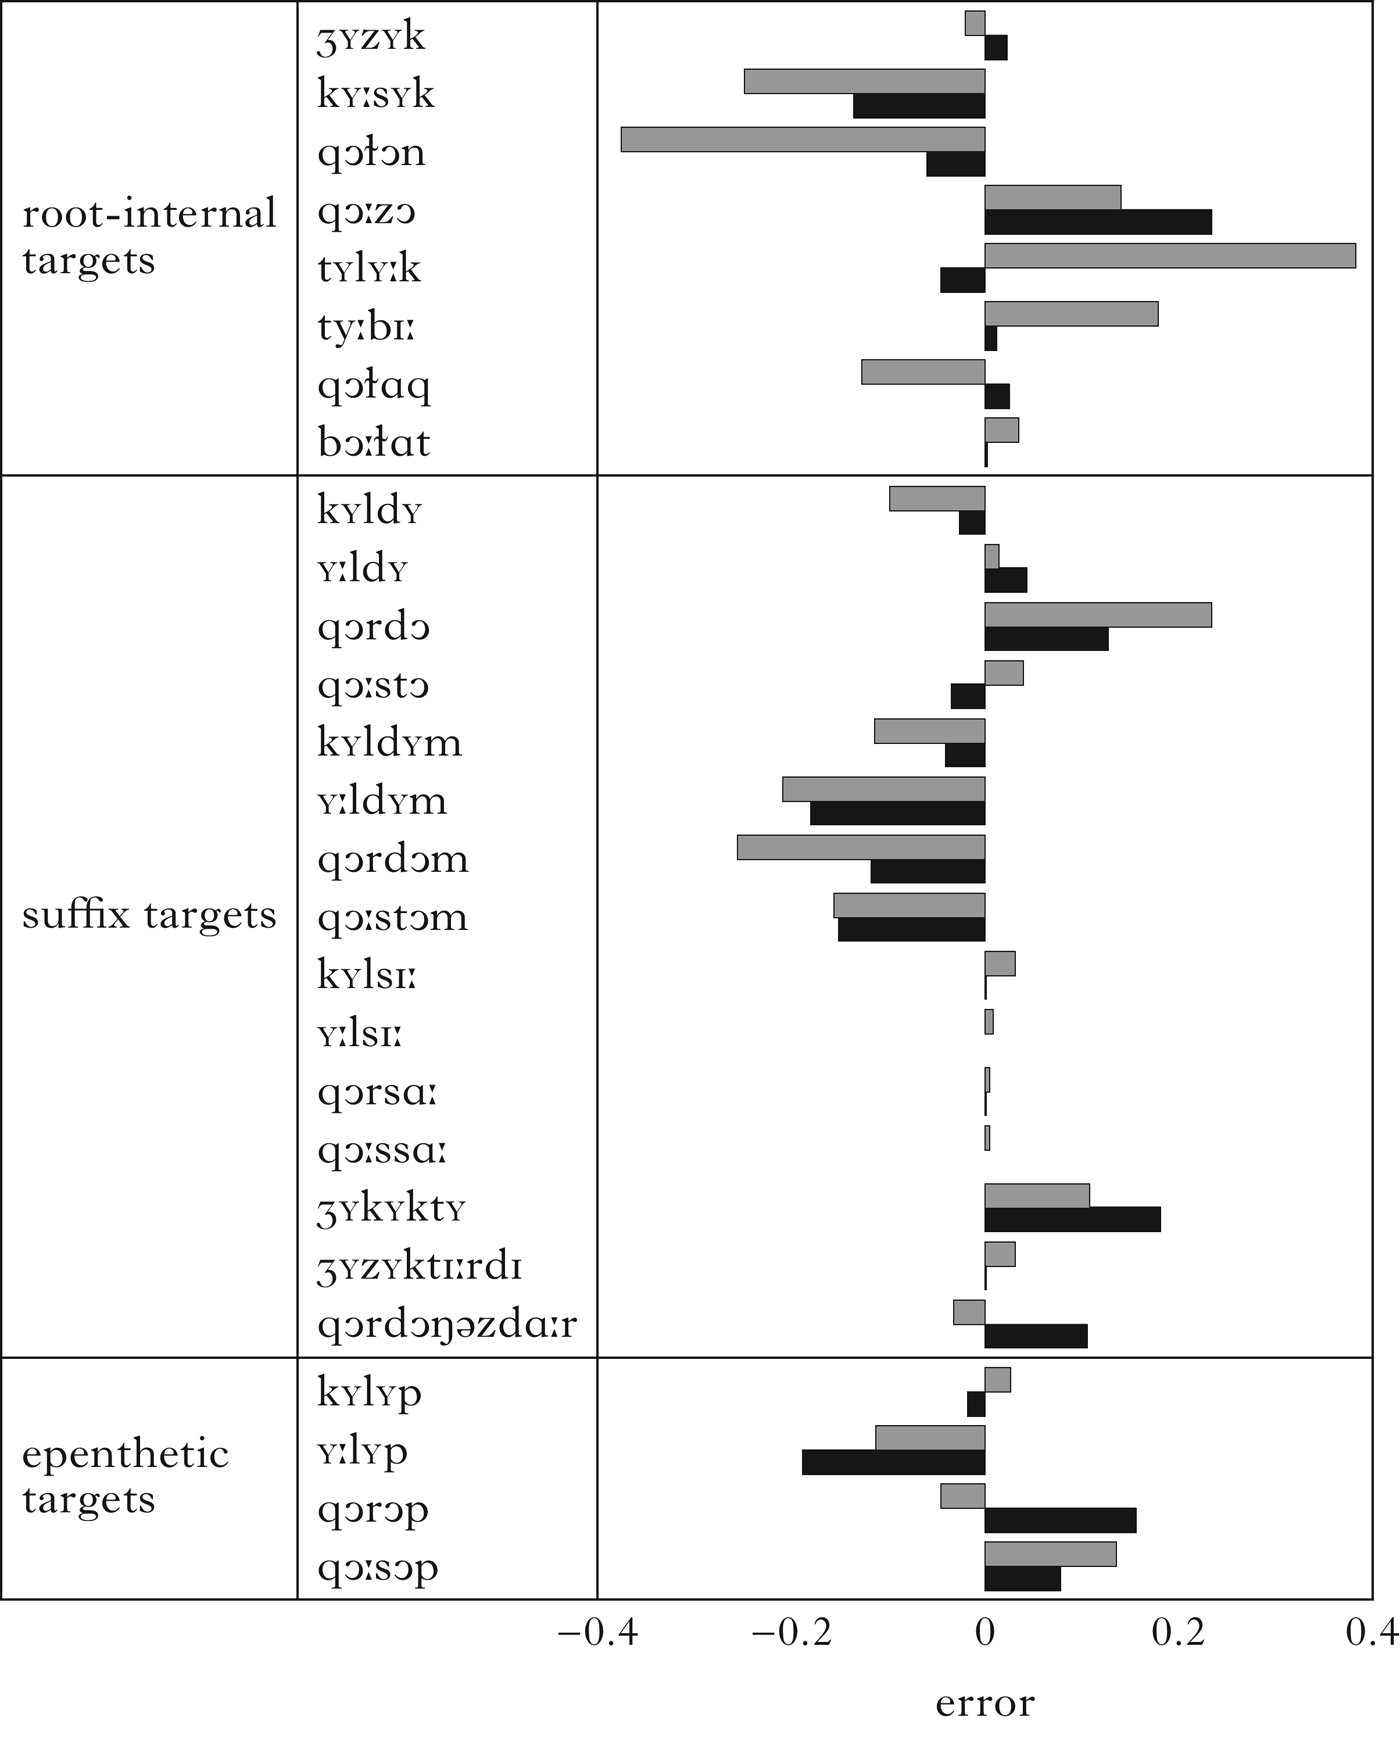
Figure 4 shows the error for Kaun's analysis, with under/overpredicted probabilities represented by horizontal bars, while Table III summarises the global fit of the feature-based model. A null model was created to assess pseudo-r 2 (Nagelkerke 1991), an indicator of variance explained by a logistic model (e.g. MaxEnt). While the feature-based analysis accounts for a good portion of the data, it does not tightly fit a number of items, which is evident in Fig. 4.Footnote 10
By-word error of the feature-based analysis. The length of each bar shows the error on each word.

Summary of the feature-based analysis (k = number of parameters).

In the next section I present a dispersion-based analysis that more successfully accounts for the Kazakh data than Kaun's analysis.
5 Dispersion-based analysis
This section argues that dispersion provides a better operationalisation of perceptual similarity than features, using dispersion-based perceptual weakness to motivate an alternative analysis. In §5.1, I introduce Dispersion Theory (Liljencrants & Lindblom Reference Liljencrants and Lindblom1972, Lindblom Reference Lindblom, Ohala and Jaeger1986). In §5.2, I compute perceptual distances for the Kazakh inventory. These distances then inform the analysis presented in §5.3.
5.1 Dispersion Theory
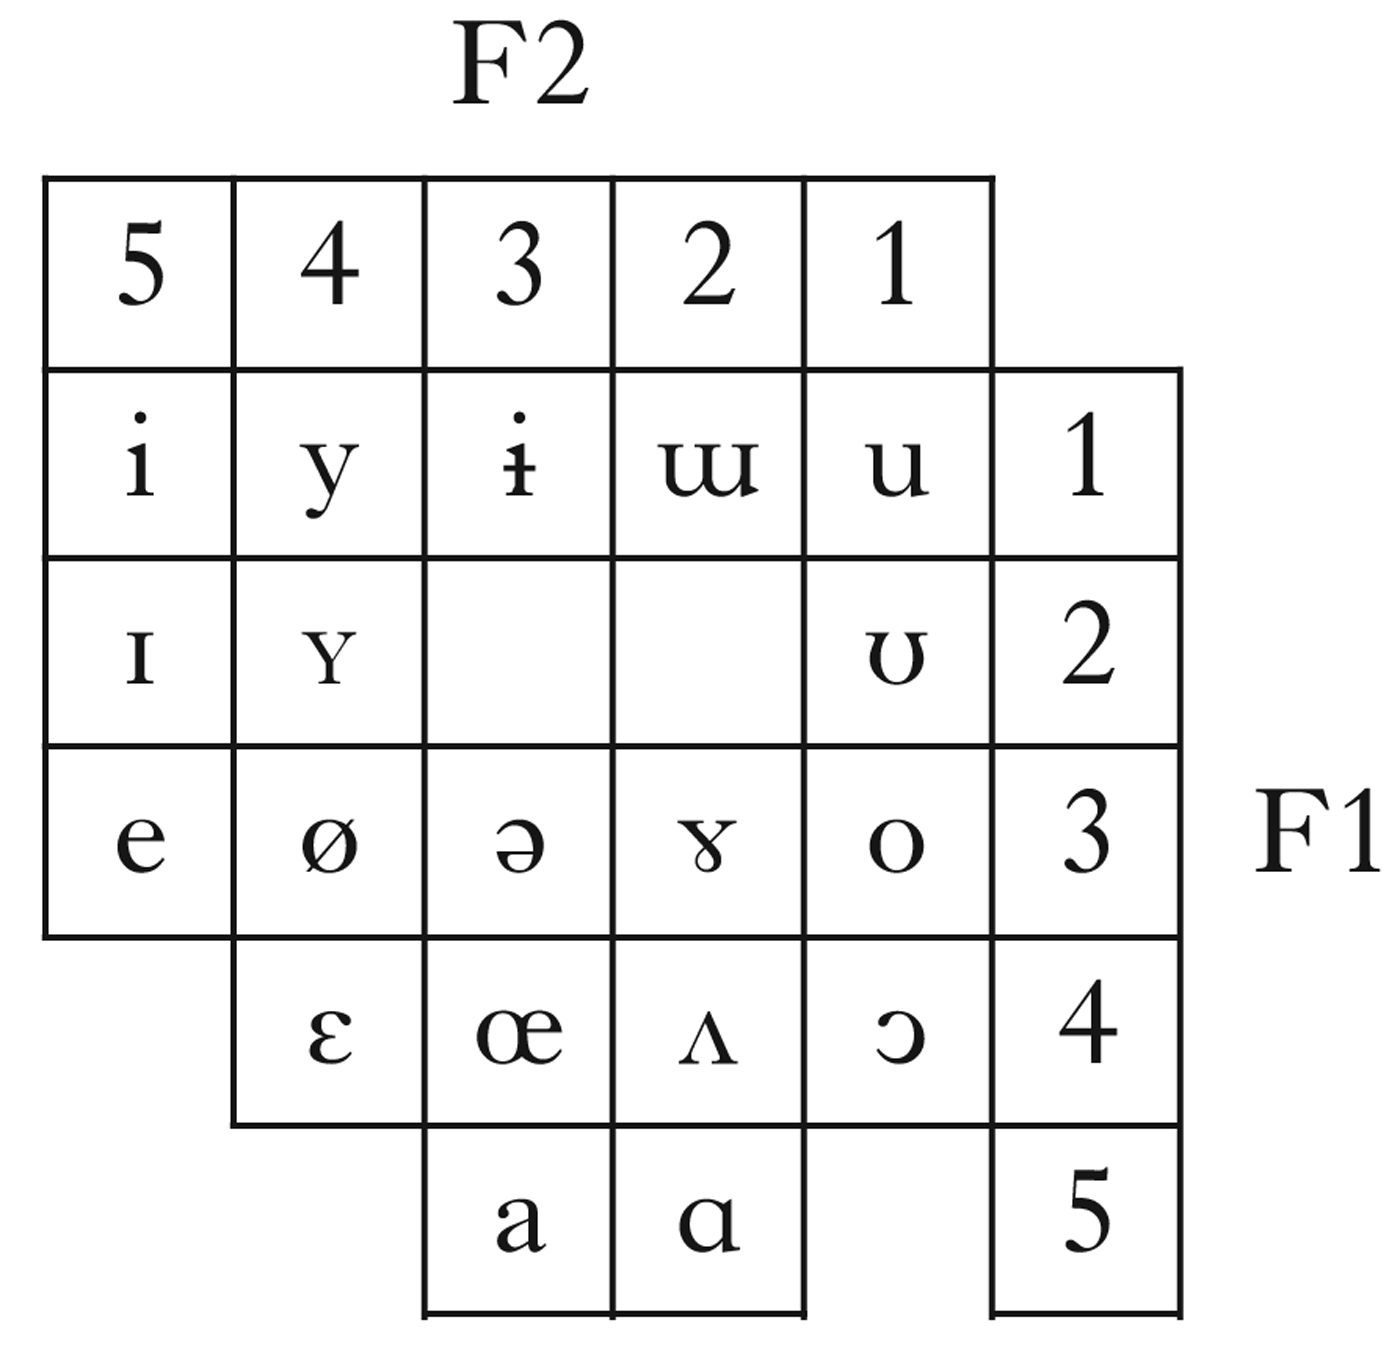
Dispersion Theory (henceforth DT; Liljencrants & Lindblom Reference Liljencrants and Lindblom1972, Lindblom Reference Lindblom, Ohala and Jaeger1986) attempts to model the shape and typological frequency of inventories rather than individual segments. It models the vowel space without explicit reference to features, arguing instead that vowels should be maximally dispersed, and uses the formant values of each phonemic vowel to assess the fitness of an inventory. Following Liljencrants & Lindblom (Reference Liljencrants and Lindblom1972), most work in DT has sought to explain the particular shapes that vowel inventories often take (Lindblom Reference Lindblom1975, Reference Lindblom, Ohala and Jaeger1986, Schwartz et al. Reference Schwartz, Boë, Vallée and Abry1997, Flemming Reference Flemming2002). For example, the frequency of three-vowel systems containing /i a u/ is explained by the large distances between the three vowels in these systems. In Flemming (Reference Flemming2002), this motivation is formalised with a set of optimality-theoretic constraints favouring large distances between contrasts, rather than constraints maximising the number of contrasts. The interaction of these conflicting constraints defines the shape of the vowel space for a given language. Whereas previous work used dispersion to predict inventories, Flemming (Reference Flemming2002, Reference Flemming2004, Reference Flemming2008) assumes that speakers synchronically access prototype-like representations. Figure 5 shows Flemming's (Reference Flemming2002) representational system. Perceptual distances are calculated in spatial rather than featural terms, by counting grid spaces between vowels. For instance, /ɪ/ and /ʏ/ differ by one F2 grid space, while /ɑ/ and /ɔ/ differ by one F1 as well as one F2 grid space.
Flemming's (Reference Flemming2002: 30) vowel space.

Within Optimality Theory, DT has also been used to account for phenomena beyond inventory structure. Padgett (Reference Padgett2004) uses an ERB (Equivalent Rectangular Bandwidth) scale to define the Russian vowel space, with Space constraints militating against category prototypes insufficiently dispersed in the acoustic space. Flemming (Reference Flemming2008) addresses positional markedness, enhancement and surface phonotactics within a dispersion-based framework. The analysis here extends the influence of DT into another realm of phonology, vowel harmony.
5.2 Perceptual distance
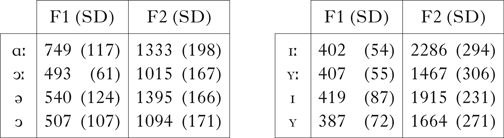
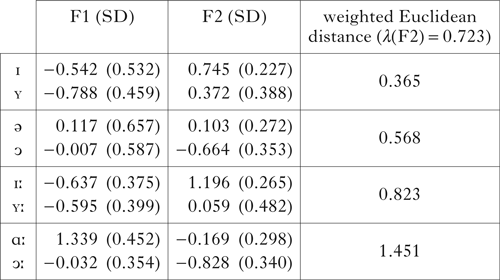
In this section, I apply the methodologies used in previous DT work to the Kazakh vowel inventory, in order to compute perceptual distances for pairs that alternate in harmony. The perceptual distances calculated below are used to operationalise perceptual weakness, where weaker (i.e. more similar) contrasts correspond to smaller weighted Euclidean distances between harmonic counterparts. By-vowel mean F1–F2 values are given in Table IV.Footnote 11
Mean root vowel F1–F2 (Hz), with one SD.

First, raw formant values were transformed into ERB using the equation provided in Reetz & Jongman (Reference Reetz and Jongman2009: 245–246).Footnote 12 After conversion to ERB, data was normalised (Lobanov Reference Lobanov1971) to reduce interspeaker physiological differences, allowing for between-speaker comparisons. Results from this transformation are shown in Table V.
Mean normalised root vowel F1–F2 (z), with one SD.

After normalisation, the vowel space was warped using the parameter λ from Schwartz et al. (Reference Schwartz, Boë, Vallée and Abry1997), such that the ratio of F2-to-F1 ranges was 0.75–0.5:1 (see also de Boer Reference Boer2000, Padgett Reference Padgett2004 and Padgett & Tabain Reference Padgett and Tabain2005 for discussion of λ). As in Lindblom (Reference Lindblom1975), this weights F1 over higher formant contrasts, since differences in F1 are more salient than differences in F2 (Flanagan Reference Flanagan1955). Warping the vowel space reflects this asymmetry in perception. To achieve the 0.625:1 midpoint in this range, λ was set to 0.723.Footnote 13 Note that Flemming (Reference Flemming2002: 29–32) uses a 1:1 vowel space, in tandem with constraints favouring F1 contrasts over F2. Although the dimensions are different in Flemming's analysis, the constraints ranking F1 over F2 differences accords with other DT results.
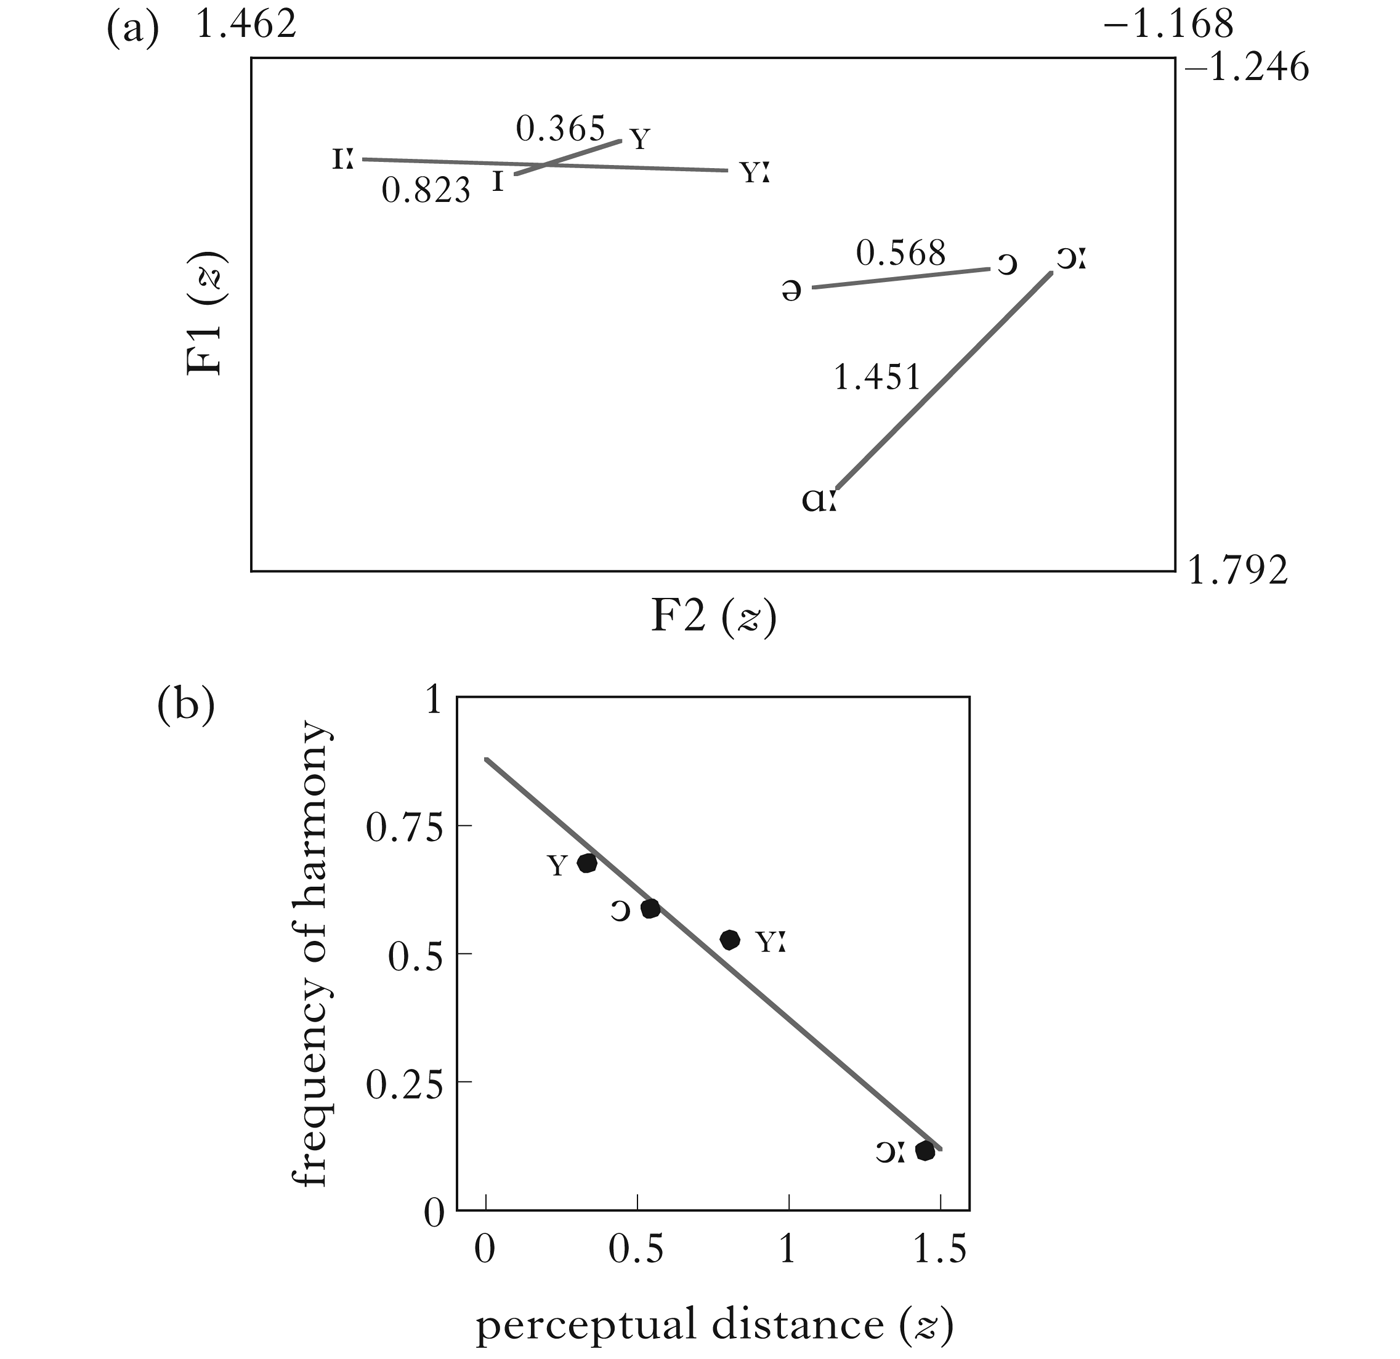
In Table V, the perceptual distance between the harmonic counterparts /ɪ/ and /ʏ/ is 0.365, much smaller than all other distances. Moreover, the relative distances between all four harmonic pairs correspond to the trigger strength hierarchy described in §2.2.2, /ʏ/ > /ɔ/ > /ʏː/ > /ɔː/.
The trigger strength hierarchy, after conversion to ERB, normalisation and warping, differs from the hierarchy obtained from raw formant values. The perceptual distances calculated on the basis of raw formant values, without any transformations, are as follows: /ɪ-ʏ/ = 253.2, /ə-ɔ/ = 302.7, /ɑː-ɔː/ = 408.5, /ɪː-ʏː/ = 819.1. This difference in the relative distance between /ɑː-ɔː/ and /ɪː-ʏː/ derives from the independently motivated transformations discussed above. These transformations highlight the difference between the acoustic and perceptual properties of vowels, which underlies the change in the relative rankings between these two vowel pairs.
Fig. 6a depicts the vowel space in Kazakh, along with the weighted Euclidean distances between each harmonic pair. Recall from the discussion above that /ʏ/ is the best trigger of harmony, and /ɔː/ the worst, with /ɔ/ and /ʏː/ somewhere in between. This empirical generalisation lines up with the distances in Fig. 6a and their correlation with frequency of harmony in Fig. 6b.
(a) Perceptual distances between labial harmonic counterparts. (b) Correlation between trigger perceptual distance and frequency of harmony on target short vowels, averaged across morphological contexts (/ʏ/ = 0.37z, /ɔ/ = 0.57z, /ʏː/ = 0.82z, /ɔː/ = 1.45z).

5.3 Formal dispersion-based analysis
5.3.1 Scalar alignment
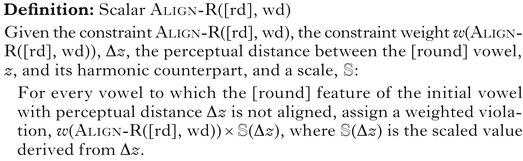
The perceptual distances just calculated provide one simple metric for comparison. Perceptual distance is formally implemented with one scalar alignment constraint, which replaces the three constraints in the feature-based analysis. Scalar constraints necessitate only a slight modification to HG (see e.g. Hsu & Jesney Reference Hsu and Jesney2016). In HG, all constraints are assigned weights. A scalar constraint multiplies the penalty incurred by that constraint in relation to some metric, like sonority, sequential distance or, in this case, perceptual distance. This introduces a new mechanism,  , into the equation from (11) used to determine harmony scores, as shown in (17).
(17)
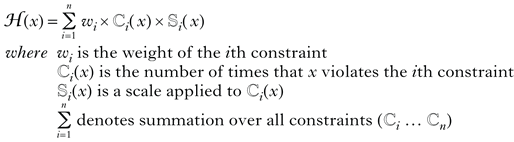
Thus, for the relevant constraint, Align-R[rd], constraint violations are multiplied by its general weight (1.5), and by the scaled weight assigned to each trigger vowel, using the perceptual distances calculated in §5.2, as in (18).
(18)
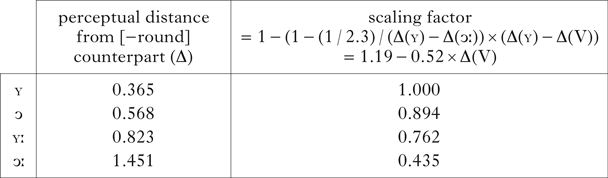
To implement this constraint, it was first necessary to determine the optimal scale. Through trial and error, this turned out to be 2.3:1. As shown in Table VI, the weight of Align-R[rd] after /ʏ/, 1, was 2.3 times greater than after /ɔː/, 0.44. Using the scaling factor in Table VI, the values weights associated with the two intermediate vowels, /ɔ/ (0.89) and /ʏː/ (0.76), were linearly interpolated between the two endpoints, /ʏ/ and /ɔː/. Thus the only free parameter is the slope of the scale, 2.3, with 1.19 and −0.52 being derived entirely from the scale's slope and the perceptual distances.
Scaled weights for each vowel.

One conceptual idealisation made throughout the analysis is that harmonic pairings are assumed. Since featural specifications are not used to derive harmonic counterparts, some tool, either representational or grammatical, must exist to maintain the correct pairings. Throughout the paper I abstract away from this issue, but it deserves a fuller analysis.
Returning to the example from (13), given the scalar alignment constraint in (18), then the probability of candidate (19b), with partial harmony, is 0.58 rather than 0.62, because the weight of Align-R[rd] is scaled by 0.89, the value derived in Table VI for /ɔ/.
(19)
5.3.2 Formal analysis
Using the perceptual distances and their implementation in a scalar alignment constraint, this subsection presents the dispersion-based analysis, arguing that it is superior to the feature-based analysis in §4.
Recall that the feature-based analysis used the seven constraints defined in §4.1.1. The dispersion-based analysis presented below uses the same set of constraints, except that the three conditional alignment constraints are replaced by the scalar alignment constraint introduced in the previous section. Thus the analyses differ only in their harmony-driving constraint(s). Since all other factors are kept constant, we can readily compare the different results derived from Kaun's three feature-based Align constraints with my single dispersion-based scalar constraint.
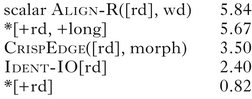
Five constraints, scalar Align-R[rd], *[+rd, +long], CrispEdge, *[+rd] and Ident-IO[rd], were optimised to fit the observed frequencies in the data. The weights assigned to each constraint are shown in (20).
(20)
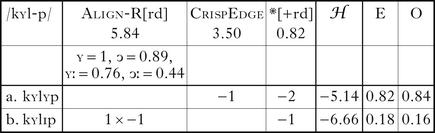
In (21), the dispersion-based model predicts the frequency of harmony for the input /kʏl-p/ with reasonable accuracy. The number of violations is multiplied by the relevant weights, giving harmony scores −5.14 and −6.66. The exponents of these two scores result in the probabilities 0.82 and 0.18 for [kʏlʏp] and [kʏlɪp] respectively, corresponding fairly well with the attested frequency. For this particular example, the dispersion-based analysis is slightly more accurate than the feature-based analysis, with errors of approximately 0.02 for /kʏl-p/.
(21)
Recall that the feature-based analysis failed to accurately predict the frequency of harmony from the input /qɔɫən/. In (22), the harmonic candidate, [qɔɫɔn], violates Id-IO[rd] once and *[+rd] twice. The disharmonic candidate, [qɔɫən], incurs one violation of both scalar Align-R[rd] and *[+rd]. The two candidates’ resulting harmony scores are −4.04 and −6.02. From these values, the model predicts harmony 88% of the time. This is far closer to the actual frequency of harmony than the feature-based prediction in (16), 57%.
(22)
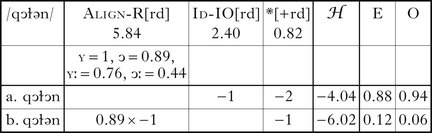
Figure 7 compares the under/overpredicted probabilities of the data in (2)–(4) for each analysis. The overall length (error) of the black bars is smaller, which indicates that the dispersion-based model fits the data better than the feature-based model. Of the 27 items compared, the dispersion-based analysis is more accurate on 20, while Kaun's analysis is more accurate on seven.
By-word error of the the feature-based (grey) and dispersion-based analyses (black).

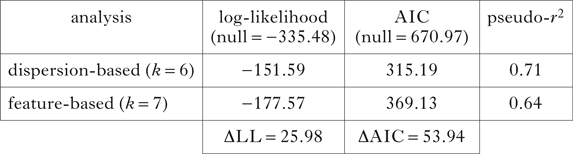
In Table VII, the differences in model fit shown in Fig. 7 are compared using log-likelihood, AIC (Akaike Information Criterion) and pseudo-r 2. Significantly, AIC is a log-likelihood-derived measure of model fit that is affected by model complexity. The dispersion-based model is simpler, using five constraints, including one alignment constraint, plus a scale, whereas the feature-based analysis uses seven constraints, including three alignment constraints. This increase in complexity is penalised by AIC. Burnham & Anderson (Reference Burnham and Anderson2004: 270–271) suggest that in model comparison a difference in AIC (ΔAIC) of less than 2 is insignificant, 4 or more is significant and more than 10 is highly significant.
Model comparisons (k = number of parameters).

On every metric in Table VII, the dispersion-based analysis outperforms the feature-based analysis. In particular, the ΔAIC of the two analyses is over 50, evidence of the superiority of the dispersion-based analysis. The dispersion-based analysis is simpler, and accounts for more data than Kaun's analysis. The relative complexity of the feature-based model results in an AIC increase of 2. The remaining ΔAIC comes from the difference in model accuracy. To illustrate this, if the number of model parameters were held constant, the log-likelihood necessary for the featural model to fare better than the dispersionary analysis would be −150.59, a difference of 26.98 from the actual model. Viewed alternatively, if log-likelihoods were held constant, any dispersion-based analysis with fewer than 33 parameters would result in a lower AIC than the feature-based analysis.
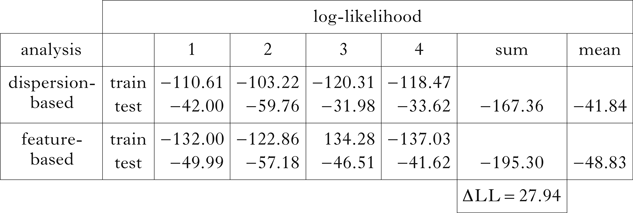
I also used cross-validation to compare the two models and check for overfitting the data. A model may learn to describe the data well, but perform poorly when asked to predict outputs from unseen data. It is thus common to separate the dataset into training and test sets, to assess the model's ability to predict probabilities of novel data. I randomly assigned 25% of the dataset to test, and used the remaining 75% for training. Four runs were conducted, with each data point occurring in exactly one test set. Results from the trial are shown in Table VIII. See Appendix A for a full list of training and test items.
Cross-validation results for the two analyses.

This additional method for model comparison corroborates the results in Table VII. In all but one run, Test 2, the dispersion-based analysis outperformed Kaun's analysis. Summed log-likelihoods in Table VIII show a similar difference to that in Table VII, suggesting the dispersion-based analysis is a superior predictive model.
Why did the dispersionary analysis perform poorly on Test 2? Actually, both analyses performed poorly. The log-likelihood of both models on the training set was far better than other training sets. When the tightness of training fit is compared to poorer performance on test data, it seems clear that both analyses overfit the training data. The weight of *[+rd, +long] in Test 2 for the dispersionary model was 16.68, far higher than any other constraint in any of the other trials. I reduced the weight of *[+rd, +long] to 5 after running Solver, resulting in a log-likelihood of −104.48 on training, only a slight decrease in performance from the original −103.22. I then substituted 5 for 16.68 on test data, producing a marked increase in performance, from −59.76 to −49.20.
Importantly, these two analyses derived output mappings from inputs with non-initial vowels specified as [−round]. The richness of the base hypothesis, however, argues that the set of possible inputs is not constrained by the grammar, which is subverted if non-initial inputs are obligatorily [−round] (Prince & Smolensky Reference Prince and Smolensky1993). To test the effect of non-initial [+round] inputs, I ran each model again, once with all non-initial inputs specified as [+round], and twice with [+round] randomly assigned to 50% of non-initial inputs. Throughout, I maintained the same partition of training and test items. The dispersion-based model outperformed the feature-based model on the test data in all trials, even though on two runs the dispersion-based model performed more poorly on the training data. Thus I conclude that the present analysis does not benefit unduly from the assumption that non-initial vowels are underlyingly specified as [−round], although this contravenes richness of the base.
As one reviewer notes, the dispersion-based analysis performs better because it captures a more salient generalisation than the feature-based analysis. Within the feature-based analysis, the probability of harmony depends on the additive structure of featural representations. The probability of harmony after each vowel is dependent on the weight, w, of Align-R[rd] plus the weights of the other two harmony-driving constraints, Align-R[rd]/[−bk] and Align-R[rd]/[−long], in (23). The vowel /ʏ/ is both front and short, so all three alignment constraints motivate harmony. In contrast, harmony after the long back vowel /ɔː/ is only motivated by Align-R[rd], so harmony is less frequent.
(23)
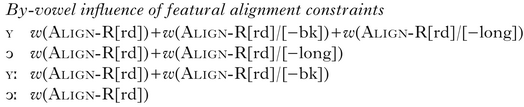
Crucially, because the featural analysis encodes a length distinction, the difference between /ʏ/ and /ɔ/ is assumed to be equal to the difference between their long counterparts, /ʏː/ and /ɔː/. However, the difference in the rate of harmony, as seen in Fig. 6b, is far greater for the long vowels. In contrast, these differences are highly correlated with perceptual distance, which is central to the dispersion-based analysis.
We should note that neither analysis accounts for all the variance encountered in the data. Other factors, including age, gender and education, were found to play a contributing role in explaining the remaining variance, but are not relevant for comparing these two analyses.
In summary, the dispersion-based analysis fits the Kazakh data better than Kaun's feature-based analysis, providing evidence for a dispersion-based reinterpretation of perceptual weakness. The next two sections extend this argument to other languages, demonstrating that the dispersion-based account can account both for other data in Kaun (Reference Kaun1995, Reference Kaun2004) and for data that is exceptional under her analysis.
6 Testing the analysis
Whereas the previous sections focused exclusively on Kazakh, this section demonstrates that the dispersion-based analysis can account for data from four languages with harmony patterns that are significantly different from that in Kazakh.
In languages that restrict harmony in some way, two distinct subtypes based on vowel height emerge from Kaun's typology: the [+high] target type, where targets are [+high] irrespective of trigger height, and the [−high] trigger-target type, where both trigger and target are obligatorily [−high]. Most Turkic languages exemplify the [+high] target type, although [+high] has been reinterpreted as [−long] in Kazakh. The [−high] trigger-target type is attested in Mongolic and Tungusic languages, as well as a number of African languages (Essegbey & McCollum 2018). This section demonstrates that the dispersion-based analysis can also account for the [−high] trigger-target pattern, using data from four Altaic languages.
Before examining the four languages used to test the analysis in this section, it is important to note that harmony in all four is reported to be categorical, in contrast to the less categorical harmony found in Kazakh. These differences likely require a different formal treatment. To that end, Appendix B: §1 contains discussion of categorical dispersion-based constraints using perceptual thresholds. The differences between optional and categorical constraints are not crucial for this section. Instead, these four languages test the prediction that the least dispersed [round] vowel pairs will also be the best triggers and targets of harmony, while the most dispersed [round] vowel pairs will be the poorest triggers and targets of harmony. The dispersion-based claim is thus corroborated if the vowels that trigger and surface via harmony are those that are separated by the smallest perceptual distance. However, the proposed analysis is falsified if participating vowels in these languages are not less dispersed than [round] vowel pairs that do not participate in harmony.
6.1 Khalkha Mongolian
Khalkha Mongolian has seven phonemic vowels, /i e a ɔ o ʊ u/. Labial harmony in Khalkha is triggered by non-high vowels, and targets only non-high vowels (Svantesson Reference Svantesson1985: 318–320, Kaun Reference Kaun1995: 48–53), as shown in (24). Non-high suffix vowels surface as unrounded after unrounded or high round vowels (24a, b), but undergo rounding after non-high round vowels (24c, d).
(24)
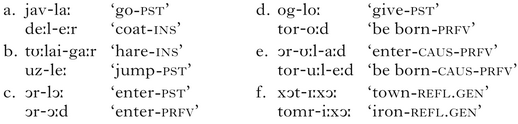
The high unrounded vowel /i/, like its [−ATR] allophone [ɪ], is transparent to harmony (24f), but the high round vowels /u ʊ/ block harmony (24e). As the high round vowels do not trigger harmony, (24b), nor do they surface via harmony from underlying /i/, the dispersion-based analysis predicts that the perceptual distance between /u/ and /i/ should be greater than the perceptual distances between /e/ and /o/ and between /a/ and /ɔ/.
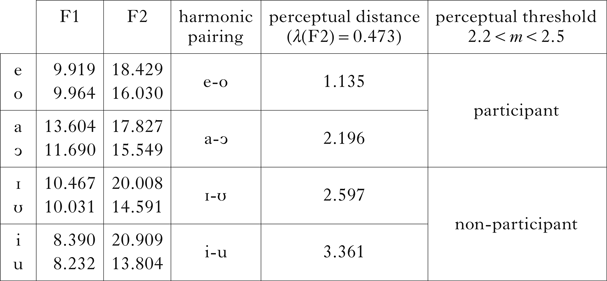
Svantesson (Reference Svantesson1985: 290–291) recorded three repetitions of each long phonemic vowel in initial position from one Khalkha speaker. Using the procedures detailed in §5.2, I calculated perceptual distances between each relevant vowel pair from Svantesson's data (as in §5.2, F3 was ignored for calculating perceptual distances). Only attested (i.e. ATR and [high] harmonic) pairings were considered.
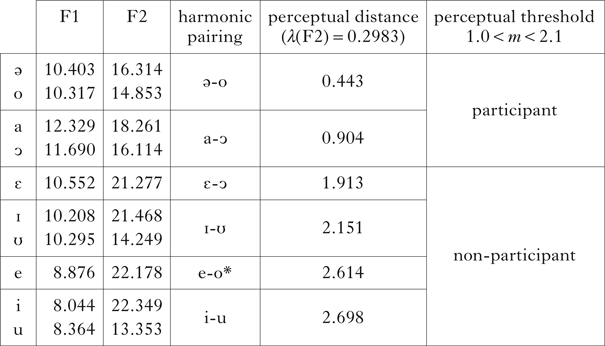
Mean F1–F2 and corresponding perceptual distances for each harmonic pair are shown in Table IX. Since non-high vowels trigger and surface via harmony, the distances for /a-ɔ/ and /e-o/ should be smaller than those for /ɪ-ʊ/ and /i-u/, and this is confirmed in Table IX. Within these possible alternations, the attested labial harmony alternations, as predicted, are those separated by the smallest perceptual distances, /a-ɔ/ and /e-o/.
Mean F1–F2 (ERB) and perceptual distances in Khalkha.

6.2 Inner Mongolian dialects
In dialects of Mongolian spoken in China, as in Khalkha, non-high vowels trigger harmony on following non-high vowels. However, in these Shuluun Höh dialects (Kaun Reference Kaun1995: 53–58), the vowel inventory is larger than the Khalkha inventory. In addition to the seven phonemic vowels of Khalkha, these dialects have the vowels /æ œ ø ə/. Svantesson suggests that these vowels derive from historical umlaut, but finds no evidence for /ø/ (1985: 290).
One interesting complication to labial harmony in Inner Mongolian dialects is the prohibition on front rounded vowels in suffixes, exemplified in (25). In (25a), /œ/ triggers labial harmony on the instrumental suffix, which is always [+back]. In (25b), harmony does not obtain with an underlyingly [−back] suffix, such as the comitative. In these cases, disharmony occurs, due to the restriction that suffixal [+round] vowels must be [+back].
(25)

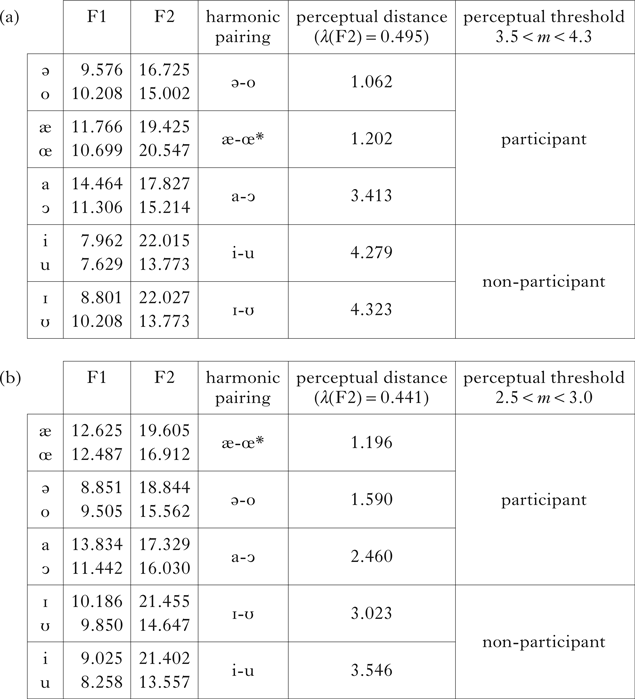
Svantesson (Reference Svantesson1985: 290–291) presents acoustic data from two Inner Mongolian dialects, Baarin and Šiliingol. As in Khalkha, the distances between the non-high round vowels and their harmonic counterparts should be smaller than the distances between the high vowel pairs. Mean F1–F2 and perceptual distances are shown in Table X. Once again, the high vowel pairs are separated by greater perceptual distances than the non-high vowel pairs in both dialects. The relative distance between the two high vowel pairings differs across dialects, but in both dialects they are the most dispersed.
Mean F1–F2 (ERB) and perceptual distances in (a) Baarin and (b) Šiliingol. The asterisks indicate that /œ/ only occurs within roots, so does not alternate for harmony.

6.3 Solon
In addition to the Mongolian dialects above, Svantesson (Reference Svantesson1985: 296) presents acoustic data from one speaker of Solon, a Tungusic language spoken in China. The Solon inventory consists of ten vowel phonemes, /i ɪ e ε a ə ɔ o ʊ u/. Labial harmony in Solon, demonstrated in (26) (Li Reference Li1996: 104, Tsumagari Reference Tsumagari2009), is similar to Khalkha. High vowels do not trigger or undergo harmony (26a). The non-high back vowels both trigger and undergo harmony (26e). Unlike the other three languages, Solon has non-high vowels that do not participate in harmony. All such vowels are [−back, −round], so they cannot trigger harmony (26c), but they also do not undergo harmony (26d) (no instances of short /e/ were found in the descriptions used). High vowels can occur non-initially, regardless of initial vowel roundness (26b).
(26)
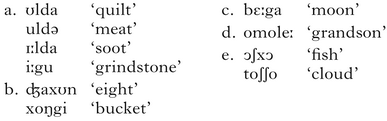
Based on the harmony pattern, the back non-high vowel pairs, /ə-o/ and /a-ɔ/, should be less dispersed than the high vowel pairs, as well as the potential but unattested pairings /e-o/ and / ε-ɔ/. Table XI shows mean F1–F2 and perceptual distances for Solon. As for the three languages discussed above, this prediction is borne out by the perceptual distances calculated from Svantesson (Reference Svantesson1985) – the back non-high pairs are less dispersed than other harmonic pairs, both actual and potential.
Mean F1–F2 (ERB) and perceptual distances in Solon. The asterisk indicates that the harmony is potential, but unattested.

One reviewer questions the typological consequences of allowing λ to differ between languages, as it does here. In each language, the dimensions of the vowel space differ, so λ is set to create a normalised 0.625:1 perceptual space, based only on each language's range of F2:F1 contrasts. It seems relatively clear that F1 must have a higher weight than F2, both for psycholinguistic and typological reasons (see Schwartz et al. Reference Schwartz, Boë, Vallée and Abry1997: §4). It is not clear, however, exactly how much higher F1 should be weighted. Schwartz et al. suggests a range of 0.5–0.75:1, because their model performs better under this assumption (Padgett & Tabain Reference Padgett and Tabain2005). If λ were fixed, it would allow inventories to exhibit a wide range of shapes. Fitting each vowel space's F2:F1 contrast ratio to 0.625:1 doesn't involve changing a parameter, but rather holding a parameter constant (the ratio of F2:F1 contrasts), which requires changing λ, since λ is just a function of that ratio and the language-specific vowel space. This is similar to the uniform auditory space used in Flemming (Reference Flemming2002), whose uniformity and proposed universality would be undermined if λ did not vary across languages. Since it is an open question how much λ should vary, if at all, I recalculated the perceptual distances in this section using 0.723, the λ value from §5.2; the results did not differ.
§5 demonstrated that the dispersion-based analysis more successfully accounts for the Kazakh data, and this section has extended the scope of the dispersion-based claim to four non-Turkic languages. The best test of the proposal would be languages with gradient harmony, more similar to Kazakh. In the absence of such data, the categorical patterns examined in this section provide corroboration for the results from Kazakh. The next section argues that the dispersion-based analysis can account for data that is exceptional under Kaun's analysis.
7 Problematic cross-height harmony
In this section, I consider three languages with labial harmony patterns that are exceptional under Kaun's analysis, but receive a straightforward analysis under the dispersion-based analysis. Further, I argue that existence of these patterns significantly undermines the larger typological predictions of Kaun's analysis. While this section discusses only data that is exceptional under Kaun's analysis, the typological predictions that fall out from the analysis developed in this paper are available in Appendix C.
Following Steriade (Reference Steriade1981), Kaun's typology makes one claim very clearly: cross-height harmony targeting a non-high back vowel is highly marked. An implicational universal emerges from Kaun (Reference Kaun1995): if cross-height harmony targets a non-high back vowel, then harmony is unrestricted. Recall from §3.2 the five constraints used in her analysis, given in (7).
If labial harmony in a given language, like Akan (Dolphyne Reference Dolphyne1988), is unrestricted, then a general Align[rd] constraint outranks all relevant markedness and faithfulness constraints. If, however, harmony is restricted in some way, then it must either target front vowels or high vowels, or must occur only when trigger and target agree in height. If harmony is unrestricted among front vowels, as in older descriptions of Kazakh (Korn Reference Korn1969: 101–102), this is generated by the ranking Align[rd]/[−bk] ⪢ *[+rd, −hi]). This ranking allows harmony on non-high vowels despite the markedness constraint *[+rd, −hi]. If harmony targets only high vowels, as in Turkish, then *[+rd, −hi] ⪢ Align[rd]. In both cases, harmony does not target non-high back vowels. If it targets non-high back vowels, then trigger and target must both be [−high]. The [−high] trigger-target patterns in §6 derive from the ranking GesturalUniformity[rd] ⪢ Align[rd]/[−hi] ⪢ *[+rd, −hi]. Crucially, there is only one ranking that generates cross-height harmony on a non-high vowel, and that is the unrestricted pattern, where Align[rd] ⪢ *[+rd, −hi], as in Akan.
7.1 Mayak
Mayak, a western Nilotic language spoken in South Sudan, has the eight phonemic vowels /i ɪ ε ʌ a ɔ ʊ u/, with two additional surface vowels, [e o] (Andersen Reference Andersen1999). Mayak exhibits both bidirectional ATR harmony and optional regressive labial harmony. In (27a), a following /u/ optionally triggers assimilation of /ʌ/ to [o]. In contrast, /i/ does not undergo harmony in the same environment (27b). None of the [−ATR] vowels trigger or undergo harmony (27c). In short, /u/ is the only trigger and /ʌ/ is the only target of harmony. Harmony is thus cross-height, and targets only a non-high back vowel.
(27)
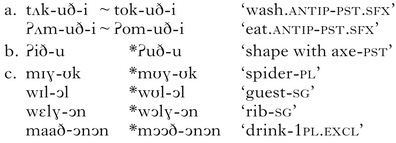
There is no ranking of Kaun's constraints that can motivate the assimilation of /ʌ/ to [o] before /u/, since harmony in Mayak is not unrestricted. The context that Steriade (Reference Steriade1981) and Kaun (Reference Kaun1995) explicitly exclude from the typology, cross-height harmony on a non-high back vowel, is thus attested in Mayak. If we modify Kaun's analysis, either with an additional alignment constraint favouring [+high] triggers or with a constraint favouring [−high] targets, then the restrictiveness of Kaun's analysis is undermined. Crucially, every featural combination of triggers and targets is possible, since Mayak fills the one gap excluded by Kaun's analysis.
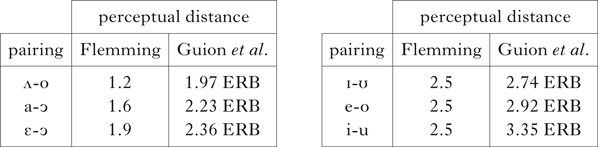
Given a pattern like Mayak, we are either forced to conclude that there are no substantive restrictions on labial harmony, or that these restrictions cannot be expressed via features. If there are no restrictions on harmony, there is no explanation for the overwhelming similarity between labial harmony patterns in unrelated languages. If we maintain that there are real restrictions on harmony, then cases like Mayak demonstrate that these restrictions cannot be featural in nature. McCollum (Reference McCollum, Jesney, O'Hara, Smith and Walker2017) shows, using both the auditory representations in Flemming (Reference Flemming2002) and phonetic data from related Maa (Guion et al. Reference Guion, Post and Payne2004), that the Mayak pattern falls out from a dispersion-based restriction on targets. Conceived in this way, all [+round] vowels may trigger harmony, but a restriction on salient [round] alternations limit the set of targets to /ʌ/. Perceptual distances from both calculations are shown in Table XII.Footnote 14 Observe that the only attested alternation, /ʌ-o/, is the least salient one. The Mayak pattern, like those in Kazakh and in the four languages in §6, falls out from perceptual weakness, defined in systemic dispersionary terms.
Perceptual distances in Mayak, based on Flemming (Reference Flemming2002) and Guion et al. (Reference Guion, Post and Payne2004).

7.2 Nkonya
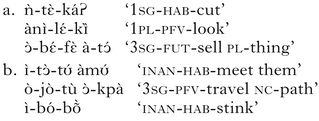
In addition to Mayak, at least two other languages instantiate this general cross-height harmony pattern. First, Kurmuk (Andersen Reference Andersen2007), a Nilotic language closely related to Mayak, exhibits a pattern almost identical to that in Mayak. Outside of the Nilotic family, Nkonya (Peacock Reference Peacock2007), a Kwa language spoken in Ghana, displays a similar harmony pattern. Nkonya has a nine-vowel inventory, /i ɪ e ε a ɔ o ʊ u/, and the habitual, perfective and future prefixes undergo rounding from following round vowels and consonants. The habitual and future prefixes are both [−high], yet undergo harmony from vowels of all heights (as well as consonants). Kaun predicts that if a language restricts harmony in some way, and a [−high] vowel undergoes harmony, then the trigger must be either [−back] or [−high], as in (7) above. Yet in Nkonya, the round vowel triggers are all [+back], and may also be [+high].
In (28a), the habitual, perfective and future prefixes all surface with [ ε] preceding [−ATR, −round] roots. In (28b), though, these prefixes surface with either [ɔ] or [o], depending on the [ATR] value of the following [+round] root.Footnote 15 Also note that [+high] prefixes do not undergo harmony. Nkonya, like Mayak and Kurmuk, counterexemplifies Kaun's typology, because in these languages cross-height harmony targets non-high vowels, but not high vowels. Kaun's typology cannot account for this without wholesale reformulation of her core analysis.
(28)
Thus far we have seen that the dispersion-based analysis outperforms the feature-based analysis for Kazakh. We have also seen that the dispersion-based analysis can account for harmony in non-Turkic languages. This section has argued that the dispersion-based account can handle data from Mayak, as well as from two other languages, Kurmuk and Nkonya, that is exceptional under Kaun's analysis. An outline of the typology of labial harmony derived from the proposed analysis is presented in Appendix C: §2.
8 Discussion
Traditionally, DT has been used to model vowel inventories. Within Optimality Theory, though, it has been used to account for phenomena beyond inventory structure. It is employed by Padgett (Reference Padgett2004) to analyse vowel reduction in Russian, and by Flemming (Reference Flemming2008) to address positional markedness, enhancement and surface phonotactics. This paper continues OT work, extending the influence of DT into another realm of phonology.
Given the similarity between Flemming's work and the present analysis, it is important to consider how they differ. Using Flemming's grid of auditory representations (cf. Fig. 5 above), we could position the Kazakh vowels as in Fig. 8.
Vowel space for Kazakh (Flemming Reference Flemming2002).

Recall that the distance between a contrastive pair is equal to the number of gridlines between each member of the pair for a given acoustic dimension (e.g. F1 or F2). Thus /ɪː/ and /ʏː/ differ in F2 by 2, while /ɪ/ and /ʏ/ differ by only 1. Among the back vowels, /ə/ and /ɔ/ are also separated by only one gridline, whereas /ɑː/ and /ɔː/ differ by one F2 gridline and two F1 gridlines. The Euclidean distance between /ɑː/ and /ɔː/ is approximately 2.2. We then have the general hierarchy /ʏ, ɔ/ > /ʏː/ > /ɔː/, because the distances between the long vowels are greater than those differentiating the short vowels, but the distance between /ɪ/ and /ʏ/ is identical to that between /ə/ and /ɔ/. Flemming's representational schema captures the same general insight, but is constrained by the granularity of its representations. By using greater acoustic detail, the present work is able to capture crucial generalisations that are not observable from featural or discretised auditory representations (see also Padgett Reference Padgett2004), like the increased frequency of harmony after /ʏ/ relative to /ɔ/.
In Flemming (Reference Flemming2008), dispersion-based constraints not only drive inventory selection, but also interact with surface-oriented markedness and faithfulness constraints in the phonology. In this paper, however, I have chosen, like Padgett (Reference Padgett2004), to address surface phonological processes without reference to how the inventory is shaped. For various reasons, vowel inventories don't always appear optimal, and the complex interaction of forces that underlie other aspects of contrast maintenance is beyond the purview of this paper.
While this work diverges from Flemming's work representationally, it fundamentally agrees that perceptual distance is active in the synchronic grammar. Although Lindblom's (Reference Lindblom, Ohala and Jaeger1986) formulation of DT is couched in evolutionary terms, both Flemming's analysis and this paper maintain that speakers access dispersion synchronically. This has been contested by various authors (e.g. Boersma & Haman Reference Boersma and Hamann2008, Hall Reference Hall2011, Vaux & Samuels Reference Vaux and Samuels2015). These authors object to the teleological underpinnings of Flemming's MinDist and Padgett's Space constraints, instead arguing for non-phonological factors in the development of vowel spacing. The accessibility of perceptual distances in the grammar, though, does not necessarily entail a causal relationship between dispersion and harmony. The learner may establish a correlation between observed perceptual distances and rates of harmony without any attempt to optimise their vowel space.
9 Conclusion
In this paper I have presented novel data from colloquial Kazakh. Using this data, I proposed a novel framework to articulate Kaun's observation that ‘bad vowels spread’. This paper, though, operationalises perceptual weakness in systemic, dispersionary terms rather than vowel-intrinsic, feature-based terms. I demonstrated that dispersion-based constraints outperform Kaun's featural constraints in a MaxEnt analysis of colloquial Kazakh, and examined four Altaic languages, showing that, in each case, the dispersion-based predictions were borne out in each language's labial harmony pattern. I then argued that this analysis provides an account for data from Mayak that is problematic for Kaun's analysis. In general, the dispersion-based analysis offers new typological insights, as well as a testable means by which to evaluate the present claims in order to further our understanding of vowel harmony, as well as the types of representations accessible to the grammar.
Supplementary materials and methods
The supplementary material for this article can be found at https://doi.org/10.1017/S0952675718000052