Introduction
Fluted pumpkin (Telfairia occidentalis Hook F.) is listed as one of the underutilized and neglected indigenous crops with significant potential to contribute to food security in sub-Saharan Africa (Jamnadass et al., Reference Jamnadass, Mumm, Hale, Hendre, Muchugi, Dawson, Powell, Graudal, Yana-Shapiro, Simons and Van Deynze2020; Metry et al., Reference Metry, Adeyemo, Grünig and Parisod2023). It is a nutritionally and medicinally valuable cucurbitaceous leafy vegetable commonly cultivated in the tropical wet coastal regions of West Africa (Fayeun et al., Reference Fayeun, Omikunle, Famogbiele and Oyetunde2018). While T. occidentalis of West Africa and Telfairia pedata of East Africa are the two well-known species in the Telfairia genus, a third species, Telfairia batesii previously found in the wild in Equatorial Guinea and Cameroon is now almost extinct (Ajayi et al., Reference Ajayi, Dulloo, Vodouhe, Berjak and Kioko2004). Fluted pumpkin is predominantly grown in Nigeria, Ghana, Benin, Cameroon and Sierra Leone. However, it is thought to be native to Nigeria, where it is extensively cultivated across the southern region of the country (Ajayi et al., Reference Ajayi, Dulloo, Vodouhe, Berjak and Kioko2004; Uguru and Onovo, Reference Uguru and Onovo2011; Airaodion et al., Reference Airaodion, Ogbuagu, Airaodion, Ekenjoku and Ogbuagu2019). Fluted pumpkin is a dioecious species (2n = 2x = 22); although sporadic monoecious forms have been reported (Akoroda, Reference Akoroda1990). It exhibits a creeping habit and bears three to five lobed leaves with twisted tendrils that extend over the soil (Horsefall and Spiff, Reference Horsefall and Spiff2005). The plant grows rapidly, trailing the trunk of trees up to a height of over 30 m, producing profusely branched vines that bear large droopy fruits enclosing many seeds (Ajayi et al., Reference Ajayi, Dulloo, Vodouhe, Berjak and Kioko2004; Nwangburuka et al., Reference Nwangburuka, Denton LA and Oyelana2014). In several areas of southern Nigeria, it is commonly cultivated adjacent to walls, fences, trees or underneath trellised platforms which allow the vine to creep undisturbed (Okoli and Mgbeogu, Reference Okoli and Mgbeogu1983). Fluted pumpkin is mainly grown for its seeds, succulent shoots and leaves (Odiaka et al., Reference Odiaka, Akoroda and Odiaka2008). The pleasant, tasty leaves and tender shoots are picked continuously, chopped and added to soups solely or combined with other leafy vegetables (Okoli and Mgbeogu, Reference Okoli and Mgbeogu1983). Mature vines of fluted pumpkin constitute an essential source of fibre in animal fodder (Chukwudi and Agbo, Reference Chukwudi and Agbo2016). A concoction prepared from the fresh leaves is administered to remedy acute anaemia and impotence in men (Ajayi et al., Reference Ajayi, Dulloo, Vodouhe, Berjak and Kioko2004; Anchal et al., Reference Anchal, Kiran and Nitisha2014; Famuwagun et al., Reference Famuwagun, Odunlade, Taiwo, Gbadamosi, Oyedele, Adebooye, Taiwo, Akponikpe and Aluko2017; Ogwu et al., Reference Ogwu, Osawaru and Obahiagbon2017). The leaves are rich in essential amino acids, minerals, vitamins and proteins (Cyril-Olutayo et al., Reference Cyril-Olutayo, Agbedahunsi and Akinola2019). Oils derived from the seeds have been documented as potential feedstock for the manufacture of vegetable oils, margarine, soaps, candles and lubricants (Agatemor, Reference Agatemor2006; Odiaka et al., Reference Odiaka, Akoroda and Odiaka2008). The cultivation of fluted pumpkin constitutes a significant commercial activity that generates a high monthly revenue of NGN145,309.1 (approximately USD 350) for many small-holder farmers in southern Nigeria (Ajayi et al., Reference Ajayi, Dulloo, Vodouhe, Berjak and Kioko2004; Odiaka et al., Reference Odiaka, Akoroda and Odiaka2008; Chukwudi and Agbo, Reference Chukwudi and Agbo2016; Aisida et al., Reference Aisida, Ugwu, Nwanya, Bashir, Nwankwo, Ahmed and Ezema2021; Osuji et al., Reference Osuji, Munonye, Olaolu, Onyemauwa, Tim-Ashama, Ibekwe, Obasi, Obike, Ebe, Onu and Obi2022).
Genetic diversity offers plant species the capability to tolerate changing environmental conditions (Pandey et al., Reference Pandey, Khan, Isik, Turkmen, Acar, Seymen and Hakki2019). Therefore, a more in-depth understanding of the extent of intraspecific genetic relationships and population structure of a species aid in determining its status and vulnerabilities, and could therefore give baseline information for fashioning suitable management and conservation approaches (Jena and Chand, Reference Jena and Chand2021). Additionally, having a good knowledge of the genetic relationship in germplasm collections is essential for selection and development of new varieties in crop improvement programmes (Jena and Chand, Reference Jena and Chand2021). The advent of DNA or molecular markers has dramatically enhanced the efficiency of selecting accessions in conventional crop breeding. Molecular markers have been extensively exploited in assessing genetic diversity, identifying quantitative trait loci for genetic mapping and marker-assisted breeding (Shayanowako et al., Reference Shayanowako, Shimelis, Laing and Mwadzingeni2018; Ghimire et al., Reference Ghimire, Yu, Kim and Chung2019; Salgotra and Stewart, Reference Salgotra and Stewart2020). Unlike morphological markers, DNA markers are not prone to interactions with the environment (Jena and Chand, Reference Jena and Chand2021). Advancements in plant genomics have propelled the development of a broad spectrum of molecular marker technologies (Etminan et al., Reference Etminan, Pour-Aboughadareh, Noori, Ahmadi–Rad, Shooshtari, Mahdavian and Yousefiazar–Khanian2018). These marker techniques differ according to characteristics such as the degree of polymorphism detected, genomic distribution, locus specificity, reproducibility, cost and technical demand (Jena and Chand, Reference Jena and Chand2021). Molecular markers may be categorized as hybridization-dependent, polymerase chain reaction (PCR)-assisted and sequence-based (Jena and Chand, Reference Jena and Chand2021). Hybridization-dependent molecular marker systems which make use of the hybridization of a labelled probe of known sequence to enzyme-digested DNA, followed by visualization of the DNA segments include restriction fragment length polymorphisms (Dhutmal et al., Reference Dhutmal, Mundhe and More2018; Nadeem et al., Reference Nadeem, Nawaz, Shahid, Doğan, Comertpay, Yıldız, Hatipoğlu, Ahmad, Alsaleh, Labhane and Özkan2018). The PCR-enabled markers, namely inter-simple sequence repeats, start codon-targeted (SCoT) polymorphism, amplified fragment length polymorphism (AFLP), random-amplified polymorphic DNA (RAPD) and simple-sequence repeats (SSRs), are designed to select and rapidly amplify specific target sequences of genomic DNA in an exponential chain reaction to produce amplicons of the targeted DNA (Green and Sambrook, Reference Green and Sambrook2019). Sequence-based markers rely on DNA sequencing technologies to detect variations in the genome and include expressed sequence tags, single-nucleotide polymorphism (SNP) and sequence-related amplified polymorphism (Dhutmal et al., Reference Dhutmal, Mundhe and More2018).
More recently, there has been a shift from using arbitrary PCR-based markers like RAPD that targets random regions of the genome to SCoT markers that target coding regions (Rajesh et al., Reference Rajesh, Sabana, Rachana, Rahman, Jerard and Karun2015; Srivastava et al., Reference Srivastava, Gupta, Shanker, Gupta, Gupta and Lal2020). The SCoT markers do not require prior genomic information on the species to be analysed, and are low cost, simple and highly reproducible (Collard and Mackill, Reference Collard and Mackill2009). The markers are designed to anneal single primers to the short-conserved stretch of nucleotides flanking the start codon, ATG, adjacent to genes in plants (Rajesh et al., Reference Rajesh, Sabana, Rachana, Rahman, Jerard and Karun2015; Jedrzejczyk, Reference Jedrzejczyk2020; Srivastava et al., Reference Srivastava, Gupta, Shanker, Gupta, Gupta and Lal2020; Mostafavi et al., Reference Mostafavi, Omidi, Azizinezhad, Etminan and Badi2021). Their applicability has been demonstrated in genetic diversity evaluation, DNA fingerprinting, cultivar recognition, quantitative traits mapping and marker-assistant selection (Mostafavi et al., Reference Mostafavi, Omidi, Azizinezhad, Etminan and Badi2021).
Expansion of fluted pumpkin hectarage amidst climate change remains a challenge due to the unavailability of improved varieties (Fayeun et al., Reference Fayeun, Ojo, Odiyi, Adebisi, Hammed and Omikunle2016; Osuji et al., Reference Osuji, Munonye, Olaolu, Onyemauwa, Tim-Ashama, Ibekwe, Obasi, Obike, Ebe, Onu and Obi2022). Considering that the crop provides nutrition for over 100 million people, coupled with its industrial and economic potentials, the need to develop improved cultivars becomes necessary (Fayeun and Odiyi, Reference Fayeun and Odiyi2015). In order to efficiently select and breed for improved or new genotypes, breeders must leverage available genetic diversity in germplasm collections of fluted pumpkin (Fayeun et al., Reference Fayeun, Omikunle, Famogbiele and Oyetunde2018). The selection of unique fluted pumpkin variants could guarantee increased production, yield and revenue for small-holder farmers (Chukwudi et al., Reference Chukwudi, Agbo, Ene, Uba and Enyi2017). Most of the existing literature on diversity in fluted pumpkin has been directed at estimating phenotypic variability, with relatively little known about genetic relationship and population structure in the species at the molecular level (Fayeun et al., Reference Fayeun, Odiyi, Makinde and Aiyelari2012, Reference Fayeun, Ojo, Odiyi, Adebisi, Hammed and Omikunle2016, Reference Fayeun, Omikunle, Famogbiele and Oyetunde2018; Odiyi et al., Reference Odiyi, Fayeun, Makinde and Adetunji2014; Chukwudi and Agbo, Reference Chukwudi and Agbo2016; Chukwudi et al., Reference Chukwudi, Agbo, Ene, Uba and Enyi2017; Ezenwata et al., Reference Ezenwata, Onyemeka, Makinde and Anyaegbu2019). Although recent studies have assessed genetic variation in fluted pumpkin landraces using RAPD (Adeyemo and Tijani, Reference Adeyemo and Tijani2018) and double-digested restriction site-associated DNA sequencing (Metry et al., Reference Metry, Adeyemo, Grünig and Parisod2023), each marker system targets different genomic regions and as such, possess different resolving power (Nayak et al., Reference Nayak, Naik, Acharya, Mukherjee, Panda and Das2005). Moreover, data generated using a different marker can reveal information that are valuable for germplasm management, including the categorization of accessions using known allelic composition and identification of duplicate collections (Rao and Hodgkin, Reference Rao and Hodgkin2002). For these reasons, we present a first attempt at the use of SCoT markers to assess genetic diversity and population structure in a fluted pumpkin collection from southern Nigeria.
Materials and methods
Collection and cultivation of accessions
Thirty-two fruit genetic resources of fluted pumpkin were collected from 12 states of southern Nigeria, representing three geographical regions: south-west, south-south and south-east (online Supplementary Fig. S1). The collection sites were separated by at least 5 km according to Wada et al. (Reference Wada, Feyissa, Tesfaye, Asfaw and Potter2021). Forty landraces were initially collected for the study; however, 32 landraces were employed due to the recalcitrant nature (sensitivity to desiccation and chilling, and propensity of the seeds to germinate within the pod) of fluted pumpkin and storage of planting materials. The landraces were assigned unique codes that highlighted the species' scientific name and collection areas. The landraces included: ToOg001, ToOg002, ToOg003, ToOg004, ToLg001, ToLg002, ToOn001, ToOn002, ToOn003, ToOy001, ToDt001, ToDt002, ToDt003, ToEd001, ToEd002, ToEd003, ToEd004, ToEd005, ToRv001, ToRv002, ToRv003, ToCr001, ToCr002, ToIm001, ToIm002, ToIm003, ToEn001, ToEn002, ToEn003, ToAn001, ToAn002 and ToAb001. Seeds of fluted pumpkin were extracted from the fruits, and subsequently washed and air-dried for 24 h before planting in plots laid out at the Experimental Farm of the Department of Biological Sciences, College of Science and Technology, Covenant University, Ota, Nigeria (6°40′25.272″N longitude, 3°9′22.80288″E latitude and an altitude of 47 m above sea level).
DNA extraction, quality check and quantification
Fresh young leaves were harvested from 3-week-old seedlings of each landrace and preserved in air-tight plastic zip-lock bags containing silica gel before DNA isolation. The leaf samples were lyophilized for 14 h prior to DNA extraction. Genomic DNA isolation from the lyophilized leaf samples was performed according to the previously described cetyltrimethylammonium bromide protocol (Doyle and Doyle, Reference Doyle and Doyle1990). The extracted DNA samples were then stored in tris-ethylenediaminetetraacetic acid buffer for 4 h before use. The quality of extracted DNA was confirmed on agarose gel (1.0% w/v) and viewed under ultraviolet light provided by a gel documentation system (Labnet, New Jersey, USA). The purity and concentration of the DNA samples were assessed by computing the absorbance ratio at 260–280 nm using a Nanodrop™ 2000/2000c spectrophotometer (ThermoFisher Scientific, Massachusetts, USA). For each sample, working solutions of 100 ng/μl were prepared for use in SCoT-PCR.
Optimization of SCoT markers and PCR
Ten SCoT primers (Inqaba Biotechnical Company [Pty] Ltd., Pretoria, South Africa) initially from Ezzat et al. (Reference Ezzat, Adly and El-Fiki2019) were screened for PCR amplification across the 32 fluted pumpkin collection. However, only 8 primers (online Supplementary Table S1) generated visible, polymorphic bands across the collection. The PCR was executed in a 25 μl volume comprising 1 μl of 5 pmol of each SCoT primer pair, 2.5 μl of 10× Taq buffer (BIOLINE, Massachusetts, USA), 1.5 μl of 50 mM of MgCl2, 1 μl of DMSO, 2.0 μl of 2.5 mM of DNTPs, 0.15 μl of 5 unit Taq DNA polymerase (BIOLINE, Massachusetts, USA), 13.85 μl of ultra-pure water and 2 μl of 100 ng/μl of template DNA. The reaction cocktail was loaded into a Veriti 96-well thermal cycler (Applied Biosystems, USA) programmed to implement an initial denaturation of 94°C for 5 min, followed by nine cycles of 94°C for 15 s, annealing at 60°C for 20 s and extension at 72°C for 30 s. Each cycle's annealing temperature was set to decrease by 1°C, with a final 35 cycles of 94°C for 15 s, 50°C for 20 s, 72°C for 30 s and a final extension of 72°C for 7 min.
Gel electrophoresis of SCoT-PCR amplification product
An 8 μl aliquot of the SCoT-PCR products were resolved on ethidium bromide (0.5 mg/ml) pre-stained tris-borate ethylenediaminetetraacetic acid agarose gel (2% w/v), and electrophoresed for 90 min at 100 V. A 5.0 μl of standard size Quick-Load Purple 50 bp DNA Ladder (New England BioLabs Inc., Massachusetts, USA) was loaded alongside the SCoT-PCR products on the agarose gel to estimate the size of the amplicons. Following electrophoresis, the SCoT amplification products were viewed and photographed (online Supplementary Fig. S2) under ultraviolet light in a gel documentation system (Labnet, Massachusetts, USA).
Data analysis
SCoT marker diversity
A binary data matrix of the SCoT marker profile across all the landraces was entered in Excel 2019 (Microsoft Corporation, Washington, DC, USA) by manually scoring clear and distinct bands as either absent (0) or present (1). The matrix produced was used to compute polymorphic information content (PIC), the number of alleles per locus, major allele frequency (MAF) and gene diversity of the SCoT markers in PowerMarker (version 3.25) (Liu and Muse, Reference Liu and Muse2005). Microsoft Excel 2019 was used to evaluate the total band number, polymorphic band number, monomorphic band number and polymorphic band percentage.
Hierarchical clustering and principal component analysis (PCA)
The SCoT binary matrix was used to generate pairwise genetic dissimilarities by computing Jaccard's coefficients with 1000 bootstrap iterations in DARwin software (version 6.0.21) (Perrier and Jacquemoud-Collet, Reference Perrier and Jacquemoud-Collet2006). Using the Ward's method, pairwise Jaccard's dissimilarity coefficients were employed to build a dendrogram. The variance-covariance matrix generated in DARwin software was imported to the adegenet package of the R program (Agung et al., Reference Agung, Saputra, Zein, Wulandari, Putra, Said and Jakaria2019) to perform multivariate PCA.
Population genetic diversity and differentiation
Landraces collected from the same geographical zone were grouped into populations (south-west, south-east and south-south) and comparatively analysed for genetic diversity indicators such as observed number of different alleles (N a) (Brown and Weir, Reference Brown, Weir, Tanksley and Orton1983), effective number of alleles (N e) (Brown and Weir, Reference Brown, Weir, Tanksley and Orton1983), Nei's gene diversity (H) (Nei, Reference Nei1972) and Shannon's information index (I) (Shannon and Weaver, Reference Shannon and Weaver1949) using GenAlEx version 6.1 (Peakall and Smouse, Reference Peakall and Smouse2012). The mean genetic diversity was computed by averaging H across all the populations. Nei's genetic distance and identity matrix among pairs of populations were calculated in GenAlEx. Additionally, a dendrogram was built based on the unweighted pair group method with arithmetic mean (UPGMA) using the Nei's genetic distance of the populations. Total percentage variability among and within the populations was determined by implementing an analysis of molecular variance (AMOVA) and significance determined using 999 random repetitions of the data in GenAlEx software. PhiPT value (analogous to F ST fixation index) for genetic differentiation of the three populations was computed in GenAlEx using 999 permutations.
Population structure
Population structure analysis was performed using cluster analysis based on the Bayesian model in STRUCTURE software version 2.3.4 (Pritchard et al., Reference Pritchard, Stephens and Donnelly2000). The software is designed to group landraces into an ideal number of populations (K) using the multilocus SCoT data by running a Markov chain Monte Carlo (MCMC) algorithm (Falush et al., Reference Falush, Stephens and Pritchard2003), and thereafter identify the cluster membership of the landraces. The STRUCTURE program was executed with an initial burn-in period of 10,000 iterations, followed by 10,000 MCMC iterations. Simulations based on the admixture model were performed by completing five separate runs for each K (from 1 to 5). The optimum number of populations was plotted by computing a ΔK value which relies on a change in the mean probability function for each K (Evanno et al., Reference Evanno, Regnaut and Goudet2005). The optimum value of the K was deduced from STRUCTURE HARVESTER version 6.0 (Earl and VonHoldt, Reference Earl and VonHoldt2012).
Results
SCoT marker diversity
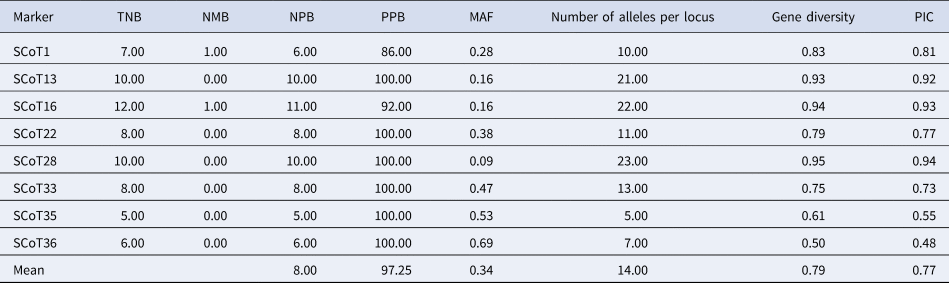
A total of 66 bands were amplified by eight SCoT markers (Table 1). The number of amplified bands per locus for the SCoT markers varied from 5.00 (SCoT35) to 23.00 (SCoT28). The polymorphic bands detected spanned from 5.00 (SCoT35) to 11.00 (SCoT16), with a mean of eight bands. The PIC values spanned from 0.48 (SCoT36) to 0.94 (SCoT28) with a mean of 0.77. The MAF varied from 0.09 to 0.69 in SCoT28 and SCoT36, respectively, with a mean of 0.34 (Table 1). Gene diversity spanned from 0.50 (SCoT36) to 0.95 (SCoT28) with a mean value of 0.79. SCoT16 exhibited a maximum number of polymorphic loci (11), whereas SCoT35 had the minimum (5) among the accessions. Percentage polymorphic loci varied from 86.00% in SCoT1 to 100.00% (SCoT13, SCoT22, SCoT28, SCoT33, SCoT35 and SCoT36) with an average of 97.25% (Table 1).
Diversity parameters of the SCoT markers

PIC, polymorphic information content; MAF, major allele frequency; PBP, polymorphic band percentage; PBN, polymorphic band number; MBN, monomorphic band number; TBN, total band number.
Hierarchical clustering and PCA
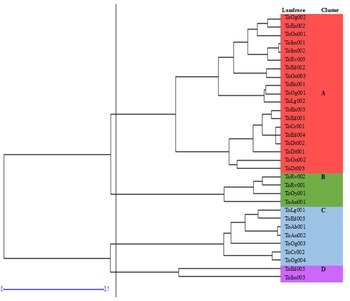
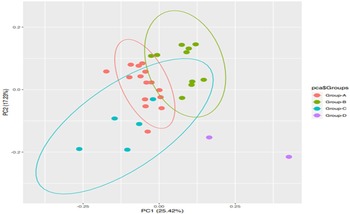
At the level of individual landraces, hierarchical cluster analysis according to Ward's method using the Jaccard's dissimilarity coefficients, divided the 32 landraces into four groups, namely A, B, C and D (Fig. 1). Cluster A was composed of ToOg002, ToEn002, ToOn001, ToIm001, ToIm002, ToRv003, ToEd002, ToOn003, ToEn001, ToOg001, ToLg002, ToEn003, ToEd001, ToCr001, ToEd004, ToDt002, ToDt001, ToOn002 and ToDt003 landraces. Cluster B was comprised of the landraces ToRv002, ToRv001, ToOy001 and ToAn001. The landraces ToLg001, ToEd003, ToAb001, ToAn002, ToOg003, ToCr002 and ToOg004 were grouped into cluster C. Only two landraces were assigned to cluster D (ToEd005 and ToIm003). An admixed cluster membership pattern was observed, with no apparent affiliation to provenance or areas of the collection (Fig. 1). The PCA of 32 landraces revealed that the first two principal components (PCs) contributed a cumulative percentage variation of 42.65%, with PC1and PC2 accounting for 25.42 and 17.23%, respectively. In the PCA, the landraces were grouped into four clusters with no apparent relationship to their collection areas. Landraces in groups A, B and C were overlapped for a few individuals (Fig. 2), while those in group D formed outliers and were the farthest on the PCA plot.
Dendrogram of genetic relationships among the 32 T. occidentalis landraces based on Jaccard's dissimilarity coefficients using the 8 SCoT markers.

PCA of the 32 T. occidentalis landraces based on PC1 versus PC2.

Population genetic diversity and differentiation
The number of alleles (N a) spanned from 1.89 ± 0.05 in the south-south population to 1.621 ± 0.080 in the south-east population, with a mean of 1.77 ± 0.04. The number of effective alleles (N e) varied from 1.53 ± 0.05 in the south-west population to 1.43 ± 0.04 in the south-east population, with an average of 1.48 ± 0.03 (Table 2). For all the populations, N e was consistently less than N a values. Shannon's information index ranged from 0.45 ± 0.03 in the south-west to 0.39 ± 0.03 in south-east population, with a mean of 0.43 ± 0.02. The Nei's gene diversity varied from 0.26 ± 0.02 in the south-east to 0.31 ± 0.02 in the south-west, with a mean of 0.28 ± 0.01. The populations exhibited similarity in the allelic parameters, N a and N e (Table 2).
Population-wise genetic diversity parameters generated from 32 T. occidentalis landraces based on the 8 SCoT primers

H, Nei's gene diversity; I, Shannon's information index; N e, number of effective alleles; N a, number of different alleles.
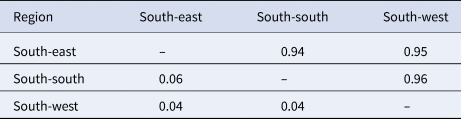
The Nei's genetic distance varied from 0.06 to 0.04, while the genetic identity between populations varied from 0.96 to 0.94. A maximum genetic distance of 0.061 was observed among the south-south and south-east populations, with the south-south and south-west populations recording a minimum of 0.040. Conversely, a minimum genetic identity of 0.94 was observed between south-south and south-east populations while a maximum genetic identity of 0.96 was recorded between south-south and south-west populations (Table 3). A dendrogram based on the UPGMA using the Nei's genetic distance grouped the three populations into two clusters, one comprising south-west and south-south, and the other south-east only (online Supplementary Fig. S3). The AMOVA partitioned 1% variation among populations, whereas the majority of the variability was within the populations. A low ϕ PT value of 0.014 suggests of a very weak differentiation between the populations (online Supplementary Table S2).
Nei's pairwise genetic distance and identity of the 32 T. occidentalis landraces based on the 8 SCoT markers

Nei's genetic distance (below diagonal) and genetic identity (above diagonal).
–, no value.
Population structure
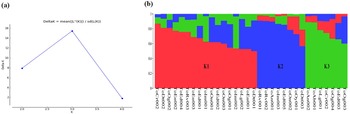
The ΔK maximum-likelihood value was detected at K = 3 (Fig. 3(a)), suggesting that the landraces could be clustered into three subpopulations. Using membership probabilities of ⩾0.50, the STRUCTURE plot assigned the 32 landraces to three groups with each landrace displaying varying degrees of allele admixtures (Fig. 3(b)). In the STRUCTURE output, each column describes a landrace, and a variegated colour motif depicts genetic admixture in a particular landrace. A well differentiated population structure could not be identified, as the landraces were not clearly demarcated according to their geographical origin as with the case of the cluster dendrogram. This demonstrates clearly that most of the landraces (17) were allocated to subpopulation K1 and consisted of ToEn001, ToEn002, ToEn003, ToIm001, ToIm002, ToCr001, ToDt001, ToDt002, ToEd001, ToEd002, ToEd004, ToRv003, ToLg002, ToOg001, ToOg002, ToOn001 and Toon003 accessions. Eight landraces namely ToAn001, ToIm003, ToDt003, ToEd005, ToRv001, ToRv002, ToOn002 and ToOy001 were assigned to subpopulation K2. The third subpopulation, K3 comprised of seven landraces that included ToAb001, ToAn002, ToCr002, ToEd003, ToLg001, ToOg003 and ToOg004 (Fig. 3(b)).
STRUCTURE analysis of the 32 T. occidentalis landraces: (a) estimated membership fraction for K = 3 in the 32 T. occidentalis landraces based on the 8 SCoT markers and (b) membership coefficients of the 32 T. occidentalis landraces determined at K = 3 in STRUCTURE analysis based on the eight SCoT markers. A vertical bar split into coloured sections is used to depict a landrace. The coloured segments correspond to the estimated membership proportions in the three subpopulations K1, K2 and K3.

Discussion
Genetic diversity assessment using an appropriate marker system is crucial to the identification of unique accessions, management, improvement and utilization of plant germplasms (Igwe et al., Reference Igwe, Afiukwa, Ubi, Ogbu, Ojuederie and Ude2017). The total number, range and mean number of detected alleles per locus in the study differed from those of Etminan et al. (Reference Etminan, Pour-Aboughadareh, Noori, Ahmadi–Rad, Shooshtari, Mahdavian and Yousefiazar–Khanian2018), Igwe et al. (Reference Igwe, Afiukwa, Ubi, Ogbu, Ojuederie and Ude2017) and Samarina et al. (Reference Samarina, Malyarovskaya, Reim, Yakushina, Koninskaya, Klemeshova, Shkhalakhova, Matskiv, Shurkina, Gabueva and Slepchenko2021). This discrepancy could be attributed to several factors, including the heterogeneity of the plant material used, methodology deployed for polymorphic loci detection and the number of landraces employed (Adu et al., Reference Adu, Awuku, Amegbor, Haruna, Manigben and Aboyadana2019; An et al., Reference An, Jo, Oh, Jang, Kong, Sung, So and Chung2019, Merheb et al., Reference Merheb, Pawełkowicz, Branca, Bolibok-Brągoszewska, Skarzyńska, Pląder and Chalak2020), annealing sites present in the genome, as well as the primer sequence (Moniruzzaman et al., Reference Moniruzzaman, Saiem, Emon, Haque, Saha, Malek and Khatun2019). The SCoT markers revealed an average percentage polymorphism of 97.25% and PIC value of 0.77, which is suggestive of a high discriminability and informativeness of the marker system (Shekhawat et al., Reference Shekhawat, Rai, Shekhawat and Kataria2018; Yang et al., Reference Yang, Xue, Kang, Qian and Yi2019). The mean percentage polymorphism and PIC values obtained were higher than 62.82% and 0.251 detected by SCoT markers among Cucurbita pepo landraces (Xanthopoulou et al., Reference Xanthopoulou, Ganopoulos, Kalivas, Nianiou-Obeidat, Ralli, Moysiadis, Tsaftaris and Madesis2015), 92.20% and 0.45 among Trichosanthes dioica accessions (Kumar and Agrawal, Reference Kumar and Agrawal2019) and 74.85% and 0.62 among quinoa genotypes (El-Moneim et al., Reference El-Moneim, ELsarag, Aloufi, El-Azraq, Alshamrani, Safhi and Ibrahim2021). High polymorphisms detected by molecular markers may be linked to the presence of CA, AC, GA and AG repeat motifs (Igwe et al., Reference Igwe, Afiukwa, Ubi, Ogbu, Ojuederie and Ude2017). DNA markers with higher PIC values possess considerable capabilities for discriminating accessions (Feng et al., Reference Feng, He, Lu, Jiang, Shen, Jiang, Wang and Wang2016). While a PIC value higher than 0.5 is judged as very informative, values that range from 0.25 to 0.5 are considered as moderately informative, with values less than 0.25 are regarded as slightly informative (Eltaher et al., Reference Eltaher, Sallam, Belamkar, Emara, Nower, Salem, Poland and Baenziger2018; Luo et al., Reference Luo, Brock, Dyer, Kutchan, Schachtman, Augustin, Ge, Fahlgren and Abdel-Haleem2019; El-Moneim et al., Reference El-Moneim, ELsarag, Aloufi, El-Azraq, Alshamrani, Safhi and Ibrahim2021, Khodaee et al., Reference Khodaee, Azizinezhad, Etminan and Khosroshahi2021). Most of the loci revealed PIC values greater than 0.5. A similar observation was reported by Jedrzejczyk (Reference Jedrzejczyk2020), thus substantiating the utility of SCoT markers in the evaluation of genetic diversity (Moniruzzaman et al., Reference Moniruzzaman, Saiem, Emon, Haque, Saha, Malek and Khatun2019) in underutilized species like fluted pumpkin. The variation observed in the MAF suggests the influence of PIC values. This is not surprising as a positive correlation between the two parameters has been previously reported (An et al., Reference An, Jo, Oh, Jang, Kong, Sung, So and Chung2019). The mean gene diversity of the SCoT primers (0.79) was higher than from a previous study in summer squash landraces (Xanthopoulou et al., Reference Xanthopoulou, Ganopoulos, Kalivas, Nianiou-Obeidat, Ralli, Moysiadis, Tsaftaris and Madesis2015). Strong association has been reported between gene diversity, PIC and the number of alleles detected per locus, such that markers with very high PIC values detected a greater number of alleles and gene diversity (Al-Tamimi and Al-Janabi, Reference Al-Tamimi and Al-Janabi2019; Gasim et al., Reference Gasim, Abuanja and Abdalla2019; Kumar and Agrawal, Reference Kumar and Agrawal2019; Moniruzzaman et al., Reference Moniruzzaman, Saiem, Emon, Haque, Saha, Malek and Khatun2019).
The cluster dendrogram assembled the landraces into four groups without any relationship to geographical collection areas. Similar observations were reported in a study involving 32 sesame genotypes from germplasm collections in Venezuela using AFLP markers (Laurentin and Karlovsky, Reference Laurentin and Karlovsky2006), 192 accessions of Ethiopian durum wheat using SNP markers (Alemu et al., Reference Alemu, Feyissa, Letta and Abeyo2020), 139 Coix lacryma-jobi accessions in south-west China using AFLP (Fu et al., Reference Fu, Yang, Meng, Liu, Shen, Zhou and Ao2019) and 190 Cypriot tomato germplasms using SSR markers (Athinodorou et al., Reference Athinodorou, Foukas, Tsaniklidis, Kotsiras, Chrysargyris, Delis, Kyratzis, Tzortzakis and Nikoloudakis2021). The observed clustering pattern could be due to fluted pumpkin breeding system or the existence of historical and current germplasm exchange among farming communities in the different regions (Ren et al., Reference Ren, Ray, Li, Xu, Zhang, Liu, Yao, Kilian and Yang2015; McBenedict et al., Reference McBenedict, Chimwamurombe, Kwembeya and Maggs-Kölling2016; Alemu et al., Reference Alemu, Feyissa, Letta and Abeyo2020). In Africa, farmer seed exchange is a widespread practice (Fayeun et al., Reference Fayeun, Omikunle, Famogbiele and Oyetunde2018). Odiaka et al. (Reference Odiaka, Akoroda and Odiaka2008) alluded to farmers in the middle belt region of Nigeria obtaining seeds of fluted pumpkin from the south-eastern part of the country. As stated by McBenedict et al. (Reference McBenedict, Chimwamurombe, Kwembeya and Maggs-Kölling2016), famers in the communal areas of Zimbabwe source 80% of their seeds from neighbouring communities, while an estimated 60% travel long distances to buy or exchange propagules to maintain crop vigour. The landrace ToOg004, which originated from Cotonou in Benin Republic, but was collected in Idiroko in Ogun state, Nigeria clustered with other landraces of Nigerian origin. Seeds are frequently traded between Nigeria and Benin, as the two countries share a border and are not too far apart. Such clustering patterns may therefore reflect historical trade routes (Ndjiondjop et al., Reference Ndjiondjop, Semagn, Gouda, Kpeki, Dro Tia, Sow, Goungoulou, Sie, Perrier, Ghesquiere and Warburton2017). An ethnobotanical survey carried out by our research team (data not shown) lends credence to this observation, as farmers interviewed in the south-west region of Nigeria remarked that they source their seeds from Calabar in the south-south region, claiming that the seeds produced more vigorous vines and broad leaves with high market value. This germplasm movement between regions is associated with the ease of propagation and socio-economic value of fluted pumpkin. Similar to the cluster dendrogram, the PCA grouped the landraces into four clusters without geographical affiliation. Landraces in clusters A, B and C of the PCA plot overlapped, suggesting that they share a common ancestry (Elhaik, Reference Elhaik2021). The distribution of group D landraces on the PCA plot indicates some degree of diversity.
Genetic variation is a significant indicator of population diversity and it primarily discloses the disparity between different loci (Xu et al., Reference Xu, Böttcher and Chou2020). The observed number of alleles were higher than the number of effective alleles in all the populations. Similar observations were documented in species like Zanthoxylum (Kalpana et al., Reference Kalpana, Choi, Choi, Senthil and Lee2012), apricot (Wang et al., Reference Wang, Kang, Liu, Gao, Zhang, Li, Wu and Pang2014) and mango (Jena and Chand, Reference Jena and Chand2021). The Nei's gene diversity is a vital index that is used to quantify genetic variation in populations (Zhao et al., Reference Zhao, Solís-Montero, Lou and Vallejo-Marín2013). In this study, the overall mean Nei's gene diversity or expected heterozygosity (0.28) and Shannon diversity index value (0.43 ± 0.02) of T. occidentalis from the south-east, south-south and south-west populations were generally low suggesting that the landraces were of a narrow genetic base. The Shannon diversity index obtained in this study was less than 1.5. Shannon diversity index typically varies from 1.5 to 3.5 (McBenedict et al., Reference McBenedict, Chimwamurombe, Kwembeya and Maggs-Kölling2016). This result contradicts the fair level of diversity reported by Adeyemo and Tijani (Reference Adeyemo and Tijani2018) using RAPD markers. This discrepancy may be attributed to differences in the type of marker employed to evaluate genetic diversity. While RAPD marks random regions of the genome, SCoT markers target coding regions (Rajesh et al., Reference Rajesh, Sabana, Rachana, Rahman, Jerard and Karun2015; Srivastava et al., Reference Srivastava, Gupta, Shanker, Gupta, Gupta and Lal2020). The high level of genetic diversity observed in the south-west population may be explained by the reasoning that the south-west is probably the centre of origin of fluted pumpkin or: (1) fluted pumpkin is a facultative perennial (Okoli and Mgbeogu, Reference Okoli and Mgbeogu1983; Akoroda, Reference Akoroda1990) and such status confers increased chances to accumulate certain microstructures or mutations in diverse populations due to biotic processes. Perennial plants are known to conserve variants between generations, thereby increasing the genetic diversity in populations (Yang et al., Reference Yang, Xue, Kang, Qian and Yi2019; Li et al., Reference Li, Chappell and Zhang2020). (2) In recent times, the fluted pumpkin has attracted increased attention as an economically and medicinally valuable vegetable, thus bringing about farmer-to-farmer seed movement (Fatokun et al., Reference Fatokun, Girma, Abberton, Gedil, Unachukwu, Oyatomi, Yusuf, Rabbi and Boukar2018), storage and cultivation of diverse germplasm from outside of the south-west region, thereby leading to increased diversity. And (3) panmictic crossings resulting from the cultivation of mixed genotypes in farmer's fields, as well as diverse agricultural practices by farmers may have contributed to the observed diversity (Akoroda, Reference Akoroda1990; Alemu et al., Reference Alemu, Feyissa, Letta and Abeyo2020). The populations exhibited low allelic diversity or similarity in N a and N e parameters, suggesting strong connectivity among the populations owing to commonality in a number of alleles at several loci (Popoola et al., Reference Popoola, Bello, Olugbuyiro and Obembe2017). This observation was further supported by the estimated genetic distance and identity of the landraces. The three populations showed a high level of genetic identity and a low degree of genetic differentiation, even though the landraces were geographically distinct. This low-genetic distance among the landraces may suggest that the fluted pumpkin is a noncentric or oligocentric crop (Uba et al., Reference Uba, Oselebe, Tesfaye and Abtew2021). Also, the low-genetic distance observed among the south-south and south-west populations may have resulted from their geographical proximity, similar climatic conditions and sharing of more similar alleles, hence the close relationship. The clustering results based on the Nei's genetic distance of the three populations revealed two clusters: the south-west and south-south populations in one cluster and the south-east population in the other (online Supplementary Fig. S3), suggesting that the south-west landraces were more closely related to the south-south landraces.
A greater portion of the genetic variation in the landraces occurred within the populations, with a lower percentage between the populations. This result indicates very weak genetic differentiation between populations. Kimani et al. (Reference Kimani, Wachira and Kinyua2012) obtained a similar result in five populations of Kenyan Lablab bean accessions using AFLP. This observation could be attributed to natural adaptation (Uba et al., Reference Uba, Oselebe, Tesfaye and Abtew2021) or extensive seed exchange among farmers across large geographical distances (Kimani et al., Reference Kimani, Wachira and Kinyua2012; Minnaar-Ontong et al., Reference Minnaar-Ontong, Gerrano and Labuschagne2021) or because of the common genetic background of the populations, which might have resulted from the continuous use of the same seeds by fluted pumpkin cultivators without the introduction of new ones. In Nigeria, sources of fluted pumpkin come from seeds saved by farmers from previous planting season, market purchases and seed exchange. There is a possibility that this could result in a heterogeneous population of landraces (Uba et al., Reference Uba, Oselebe, Tesfaye and Abtew2021). PhiPT and F ST are equivalent standardized estimates for deciphering genetic differentiation between populations. The values for both parameters can range from 0 (no differentiation) to 1 (no alleles shared) (Mohammed and Hamza, Reference Mohammed and Hamza2018). A low PhiPT value of 0.014 was observed suggesting that very weak differentiation existed among the population. Fluted pumpkin exhibits outcrossing. Higher levels of genetic diversity within populations than among populations have been well documented in a number out-crossing species (Huang et al., Reference Huang, Chu, Lu and Wang2019; Yang et al., Reference Yang, Xue, Kang, Qian and Yi2019; Alemu et al., Reference Alemu, Feyissa, Letta and Abeyo2020).
The application of a Bayesian model-based clustering approach in STRUCTURE software is useful for the detection of population structure, assignment of accessions to populations and identification of admixed accessions (Admas et al., Reference Admas, Tesfaye, Haileselassie, Shiferaw and Flynn2021). There is a dearth of report on population structure in cucurbits using the Bayesian model (Alhariri et al., Reference Alhariri, Behera, Jat, Devi, Boopalakrishnan, Hemeda, Teleb, Ismail and Elkordy2021; Zhu et al., Reference Zhu, Zhu, Li, Wang, Wu, Li, Zhang, Wang, Hu, Yang, Yang and Sun2021). The STRUCTURE analysis grouped the 32 fluted pumpkin landraces into three subpopulations that exhibited varying levels of allelic admixture. Abdin et al. (Reference Abdin, Arya and Verma2017) and Agarwal et al. (Reference Agarwal, Gupta, Haq, Jatav, Kothari and Kachhwaha2019) documented the admixture of alleles in populations of bottle gourd and rose germplasms analysed using SCoT markers. Similarly, Ramakrishnan et al. (Reference Ramakrishnan, Ceasar, Duraipandiyan, Al-Dhabi and Ignacimuthu2016) identified three subpopulations with the allelic admixture and no pure line among 128 finger millet genotypes based on SSR markers. Some authors have advanced that admixture, which is indicative of allele sharing may occur from incomplete lineage sorting of historically close populations (Huang et al., Reference Huang, Chen, Tsang, Chung, Chang and Hwang2015; Cheng et al., Reference Cheng, Kao and Dong2020). Furthermore, admixture may result from the exchange of plant seeds between regions. It is noteworthy that fluted pumpkin is an outcrossing species (Fayeun et al., Reference Fayeun, Ojo, Odiyi, Adebisi, Hammed and Omikunle2016) and as such, cross-pollination among a mix of landraces cultivated in farmers’ field could result in admixture of alleles (Annicet et al., Reference Annicet, Louise, N'da Désiré, Paul, Konan and Arsene2016; Zheng et al., Reference Zheng, Xu, Liu, Zhao and Liu2017), thereby narrowing the genetic base (Nkhata et al., Reference Nkhata, Shimelis, Melis, Chirwa, Mzengeza, Mathew and Shayanowako2020).
Conclusion
This study throws light on fluted pumpkin genetic diversity and population structure in southern Nigeria. The SCoT markers were very informative in distinguishing the fluted pumpkin landraces. Hierarchical cluster analysis and PCA grouped the landraces into four clusters, with no apparent relationship to geographical regions of the collection. The two landraces, ToIm003 and ToEd005 formed an out-group in the PCA plot and may be considered for breeding purposes. Generally, population genetic diversity analysis revealed a narrow genetic base for the three fluted pumpkin populations. This was further supported by a close genetic identity and the distance between the populations. The south-west population exhibited higher diversity than the south-east and south-south populations. Evaluation of population structure divided the landraces into three subpopulations that exhibited varying degrees of allelic admixture. An AMOVA indicated that the populations displayed very weak differentiation. The narrow genetic background may likely pose a significant hurdle to improving fluted pumpkin from local plant propagules. Therefore, to facilitate future exploitation and improvement, broadening and enriching the genetic base of cultivated fluted pumpkin particularly through CRISPR-Cas 9 gene editing and advanced backcross quantitative trait loci technology are strongly recommended. Safety measures for the future, including ex situ conservation is recommended in addition to on-farm conservation. The results of the study have significant implications in the characterisation, conservation, improvement and utilization of fluted pumpkin.
Supplementary material
The supplementary material for this article can be found at https://doi.org/10.1017/S1479262123000308.
Acknowledgements
This research was supported by the International Foundation for Science (IFS), Stockholm, Sweden, through a grant (No. C/6317-1) to O. S. A.
Author contributions
O. S. A., J. O. P. and O. O. O. conceived and designed the study; O. S. A. and J. O. P. collected the plant materials; O. S. A. performed the research; O. S. A. and R. P. analysed the data; O. S. A. wrote the first draft of the manuscript; O. S. A., J. O. P., R. P. and O. O. O. read, contributed to and approved of the final draft.
Conflict of interest
The authors declare that no conflict of interests exist concerning this publication.