

Online, self-completed surveys are growing in popularity. The reduced cost of collecting data via online surveys has opened up data collection for hundreds of researchers who otherwise would not have been able to collect their own data. While the use of self-completed surveys has grown over the last decade, few studies address purely the mode differences between in-person interviewing—as happens on the phone or in a face-to-face interview—and self-complete surveying. What are the differences between a respondent’s answer to the same question when it is posed by another person compared with when it is read on a computer screen? Several analyses of internet surveys aimed at addressing this question have been done, but comparative studies routinely conflate sampling method with mode of interview, making it impossible to discern what is driving the differences in the data. As a result, our ability to make inferences about the effects on survey responses due only to mode are limited. A clearer path to causal identification comes from randomly assigning the mode of interview after a sample has been drawn and a respondent’s participation has been guaranteed. In this paper, we attempt to go beyond observational comparisons of survey data collected via different modes by recruiting people to take a survey and then randomly assigning them to a mode of interview after they agree to complete the survey. In this way, we isolate the effects of mode alone and learn about the potential effects of switching between these modes of interview.
We offer findings on one of the key differences in survey response between the modes—the rate of item non-response. We also illustrate the role that a person’s level of cognitive ability plays in exacerbating the difference in non-response by mode. For nearly every item on the survey, we find more item non-response in the in-person interview relative to the self-complete mode. Moreover, moving from high to low levels of cognitive ability, an otherwise average respondent can be up to six times more likely to say “I don’t know” in a face-to-face interview than in a self-completed survey.
To isolate these effects, we randomly assigned 1010 adult respondents who agreed to complete a survey to one of two methods: either a face-to-face or online survey. The surveys (N=505 people/mode) had identical questions and were administered immediately after the randomization was completed. This process rules out any differences due to sampling method or sample composition, which is important as it allows for a test purely of differences due to mode of interview, not one that conflates sampling method, response rates, or sampling frame with mode effects. The design also eliminates confounds related to sampling or selection bias associated with the mode of survey administration. It isolates differences due to mode and helps illustrate the ways in which answering questions with an interviewer in the room may generate systematically different responses, on average, than answering questions on a computer, holding as much else equal as possible. Future work should allow response contexts to vary in ways that mimic respondents’ typical settings (allowing the self-completed survey to be taken on a home computer, e.g., or at times when the respondent wants to complete it), but the goal of this project was to isolate as completely as possible the effect of only the survey mode as a first cut at understanding the differences that emerge across data sets collected by both methods.
Survey Mode and Non-Response
The theoretical underpinnings of survey non-response can be characterized generally by cognitive elaboration models (Schwarz et al. 1994; Bless et al. 1994; Sudman et al. 1996) and more specifically by satisficing theory (Krosnick 1991), both of which broadly assume that a survey response requires a sufficient level of cognitive skill or motivation. Respondents first decipher the meaning and purpose of a question, find relevant information in their minds, condense that information into a summary report, and then try to make that summary report fit within the limitations of the question design (see also Krosnick 2010; Strack, Schwarz and Wanke 2010; Tourangeau, Rips and Rasinski Reference Tourangeau, Rips and Rasinski2000; Schwarz and Bohner Reference Schwarz and Bohner2001). For many respondents, this response process comes naturally, but for subsets of the sample, a shortcut might be the easiest response to a question deemed difficult, which can lead to satisficing, primacy, or recency effects (Converse Reference Converse1976; Coombs and Coombs Reference Converse1976; Bradburn and Sudman Reference Bradburn and Sudman1988; Feick Reference Feick1989; Krosnick 1991; Oppenheim Reference Malhotra and Krosnick1992). Influences on these effects include the respondent’s ability and motivation, and the difficulty of the question (Carmines and Stimson 1980; Krosnick 1991; Mondak and Davis Reference Mondak and Davis2001), but satisficing, specifically with a non-response, is also attributed to lower cognitive skill (Krosnick 1991; Krosnick et al. Reference Krosnick, Holbrook, Berent, Carson, Hanemann, Kopp, Mitchell, Presser, Ruud, Smith, Moody, Green and Conaway2002). Socio-economic characteristics may also contribute to non-response including race, gender, income, and education (Francis and Busch Reference Francis and Busch1975; Converse Reference Converse1976; Rapoport Reference Rapoport1982; Althaus Reference Acree, Ekstrand, Coates and Stall2003).
Given these underpinnings of non-response, there are many reasons to expect both response and non-response differences due to survey mode, and a small group of scholars have investigated these differences across various modes of interview with fruitful results (Sudman and Bradburn Reference Sudman and Bradburn1974; Kiesler and Sproull Reference Kiesler and Sproull1986; Bishop et al. Reference Bishop, Hippler, Schwarz and Strack1988; De Leeuw Reference de Leeuw1992; Gano-Phillips and Fincham Reference Gano-Phillips and Fincham1992; Fowler, Roman and Xiao Reference Fowler, Roman and Xiao Di1998; Acree et al. Reference Althaus1999; Heerwegh Reference Heerwegh and Loosveldt2009; Heerwegh and Loosveldt Reference Heerwegh2008; Chang and Krosnick Reference Carroll2010; Ansolabehere and Schaffner Reference Ansolabehere and Schaffner2014; Atkeson, Adams and Alvarez Reference Atkeson, Adams and Alvarez2014). No study to date, however, has directly compared in-person interviewing with self-completed surveys using an adult population with random assignment to mode after respondents agree to participate in the survey. As a result, we know very little about non-response differences across these two modes in non-student populations. Chang and Krosnick (Reference Carroll2010) offer the only other post-acceptance randomized mode experiment comparing self-complete with interviewer-assisted modes. They randomly assigned college students to complete a survey on a computer or answer questions asked by an interviewer heard over an intercom. Their findings motivate our search for interactions based on cognitive skill levels, as they found students with lower standardized test scores (information gleaned from their admissions files) engaged in more item non-response in the interviewer-assisted intercom mode than the self-administered mode. A few other studies compare outcomes of in-person interviews to outcomes from online surveys, but these projects cannot separate the effects of survey mode from sampling methodology (Malhotra and Krosnick Reference Mondak2007; Sanders et al. Reference Sanders, Clarke, Stewart and Whiteley2007). Recent work (Atkeson, Adams and Alvarez Reference Atkeson, Adams and Alvarez2014) holds the sampling frame constant, but not the sampling method, which leads to compositional differences that are adjusted through post-stratification. By randomizing people to a mode of inquiry once the sample is complete we avoid these potential confounds. We expect cognitive skill, question wordings and topics, and the mode of inquiry to affect levels of non-response, as previous work has demonstrated.
A rich literature on the psychology of survey response also helps guide our search for differences between modes. A primary pattern in survey response investigations is that reports of behaviors show no differences by mode relative to questions about attitudes or beliefs. Existing theories of survey response explain this pattern by suggesting that people remember things they experience first-hand better than things they learn about second hand. Activities and descriptors like voting in elections, going to the dentist, annual income, smoking cigarettes, or reading the newspaper are part of what social psychologists call an “ongoing autobiographical narrative” and thus memory of such things, and survey responses drawing on those memories, are aided by things like sensory detail and other psychological processes (Tourangeau, Rips and Rasinski Reference Tourangeau, Rips and Rasinski2000, 65). The answers to these questions are “real” to respondents and thus easy to recall. Remembering and reporting on these autobiographical details is routine for most people, thereby increasing the stability of responses to these types of questions across surveys over time. By extending this line of reasoning from within to across subjects, we believe the same mechanism may explain a comparability, on average, of behavioral reports across our two modes of interview: first-hand experiences are easy for people to recall and thus other factors that usually make answering survey questions difficult are less relevant, regardless of mode.
Responses to questions about attitudes and beliefs, on the other hand, may be quite different from first-hand memories. Tourangeau, Rips and Rasinksi write that, “attitude questions pose special problems” for respondents because people may never have considered the topic in question prior to hearing the survey question (Reference Tourangeau, Rips and Rasinski2000, 62). Increased response instability over time (and we believe mode of inquiry, too) is one result of the higher level of cognitive burden associated with questions about attitudes and beliefs, relative to those about behaviors and demographics. Tourangeau, Rips and Rasinksi (Reference Tourangeau, Rips and Rasinski2000, 179) detail the mechanisms from which the instability arises in their belief-sampling model of survey response. The model traces response differences on attitude questions to variations in respondents’ retrieval and judgment processes across survey settings. Which considerations a respondent retrieves and places weight on depends on the momentary accessibility of each consideration, which according to the model, is influenced by many factors, some chronic and some temporary. The accessibility of such considerations, it seems, can also be context—or mode—dependent. Tourangeau, Rips and Rasinski (Reference Tourangeau, Rips and Rasinski2000, 180) consider this exact possibility, writing that judgments about considerations may also be affected by momentary fluctuations, including things like the presence of an interviewer.
In summary, differences across mode in responses to questions about attitudes, beliefs, and knowledge, may differ depending on the extent to which respondents consider the same information in both modes and construe that information in the same way across modes. In this experiment, the differences in context include the presence of the interviewer in the face-to-face setting, the need to process information either aurally or visually, and the required use of a keyboard in the self-completed mode.
Ultimately, our findings are consistent with the purely experimental work on mode by Chang and Krosnick (Reference Carroll2010) and echo the above findings on non-response and survey responses generally. Like Carmines and Stimson (1980), Krosnick (1991), and Mondak and Davis (Reference Mondak and Davis2001), we also find that challenging questions generate increased levels of non-response and add that this pattern interacts with mode of interview. We find little support for mechanisms of recency or primary in driving these patterns.
The pattern of results we present suggests that it may not be sample composition that makes respondents in online panels look more interested and knowledgeable than those in expensive face-to-face settings, but instead may be the self-completed mode of interview that drives these findings.
A Randomized Mode Experiment
We conducted these experiments in mock living rooms and offices at Television City, the CBS research facility inside the MGM Grand Hotel in Las Vegas, Nevada.Footnote 1 We randomized people into the two treatment conditions by blocking on three demographic indicators: age, race, and sex. The blocking design ensured that demographic covariates were not collinear with the mode assignments (see Green and Gerber 2012, 72–9 for a complete description of this method). By randomizing within each block, we eliminated the possibility that, just by chance, an imbalance of demographics occurred across treatment groups.Footnote 2 Respondents were grouped according to observed demographics by research staff after agreeing to participate in the survey but before randomization. We sorted respondents into three age groups (below 30, 31–59, and 60 plus), three race categories (white/Asian, African American, and Hispanic), and sex.Footnote 3
An Overview: Differences by Mode and Question Type
We start by providing an overview of non-response for every question in the survey. The survey draws upon many canonical election study questions such as those used by the American National Election Study (ANES) and the General Social Survey (GSS).Footnote 4 The survey was also written to cover a variety of configurations with respect to non-response and the construction of question stems and outcome categories, much like these well-known surveys do.
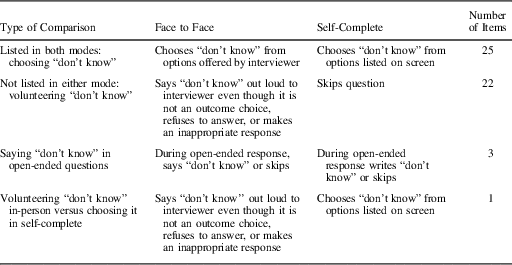
For this test, we constructed four types of non-response comparisons across the modes, as detailed below:
∙ Explicit “don’t know” outcome listed in both modes. In many cases, a don’t know outcome was available in writing in the self-complete survey and was offered out loud by the interviewer in the face-to-face survey. This describes 25 of the questions on the survey and offers a direct means of comparison with respect to non-response.
∙ “Don’t know” outcome not listed in either mode. In some cases (22 questions) we did not offer “don’t know” as a listed outcome. In many cases, we allowed interviewers to record when respondents voluntarily offered a don’t know response. In the self-complete survey, however, volunteering an outcome was impossible. Respondents were told at the start of both surveys that they could skip any questions they did not want to or could not answer.Footnote 5
∙ Open-ended non-response. The survey included three open-ended questions on which respondents could say whatever they liked. Interviews recorded exactly what respondents said in the in-person survey and respondents typed whatever they wanted in the self-complete survey. Respondents could type or say don’t know explicitly or they could leave the question blank or say nothing.
∙ Voluntary “don’t know” versus explicit “don’t know.” In one case, we allowed interviews to record voluntary don’t know responses in the face-to-face interview while offering the category explicitly in the self-complete survey. This combination of outcomes is well-documented and produces a well-known response pattern (more people will choose the outcome if it is offered as an option than otherwise, regardless of mode), thus we did not apply this scenario to many questions (see Delli Carpini and Keeter Reference Delli Carpini and Keeter1996; Mondak 2001; Mondak and Davis Reference Mondak and Davis2001).
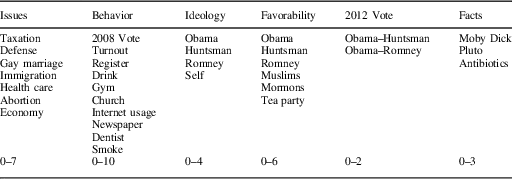
Table 1 summarizes the four comparisons made throughout the survey and details the way responses were determined to be a non-response for each of the four groupings. In some cases, it is quite easy—we offered “I don’t know” or “I haven’t thought much about this,” in both modes and people selected it. In other cases, we do not offer these options and respondents must either volunteer their uncertainty or skip the question. The complete list of ways a person could give a non-response is in Table 1.
Classification of Survey Responses into “Don’t Know” or Non-Response Outcomes

Note: Refusing to answer or skipping is always classified as a non-response regardless of whether “don’t know” was listed as an outcome choice.
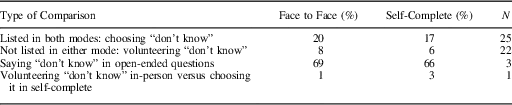
Table 2 presents average rates of non-response across all the questions for each of the four groupings in Table 1. Average rates of non-response across the modes differed by several points, with some questions exhibiting extremely large and significant differences—always in the direction of increased non-response in the in-person interview. Notice that when “don’t know” or a similar non-response outcome is offered explicitly in both modes, more people choose it than when it is not explicitly offered (compare the levels in the first two rows of Table 2). In the in-person interview, on average across all the questions, 20 percent of the respondents said “I don’t know” while 17 percent checked that box in the self-complete interview. Compare these numbers with 8 and 6 percent, respectively, who took the same actions on questions for which the non-response option was not listed as a choice. Still more people, on average, said they were not sure of the outcome when the question was open-ended (the third row of Table 2).
Average Rates of Non-Response by Mode and Question Format

Note: Total number of respondents is 1010, split evenly between the treatment groups. Differences across the modes are significant at conventional levels (α≤0.05) for row one and two in the table, the listed and unlisted groups.
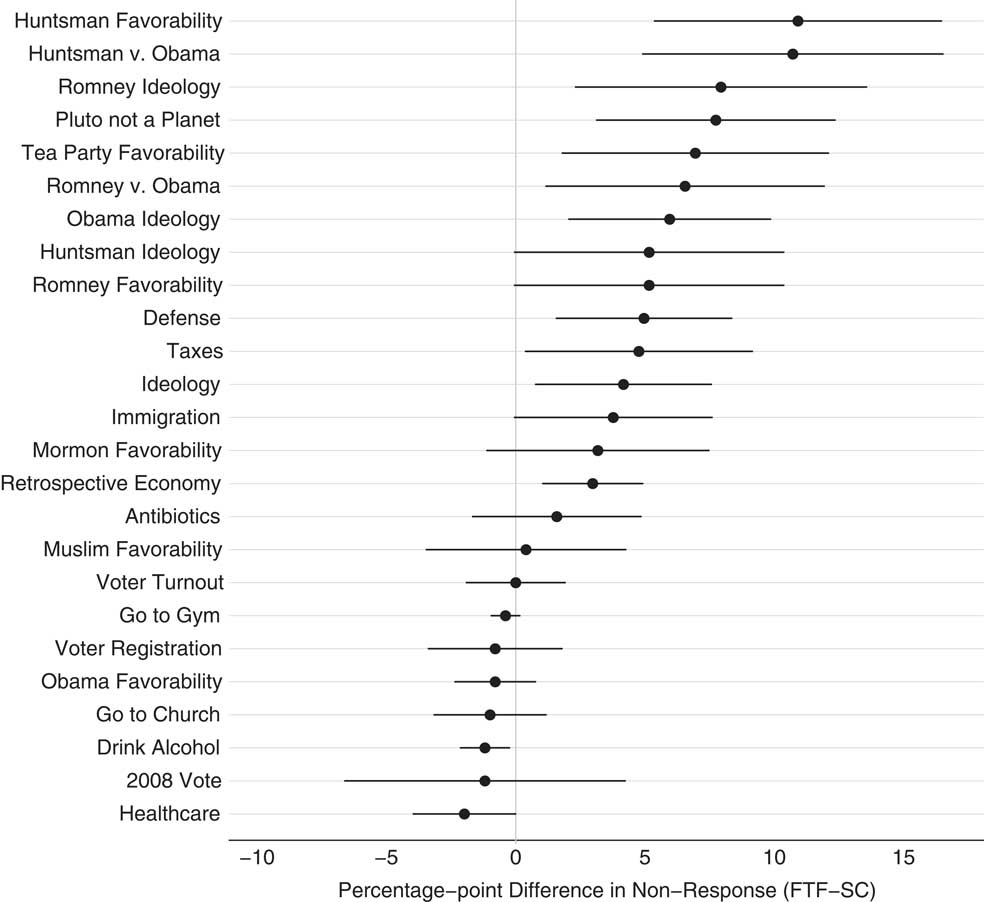
Digging a little more deeply in to each of the question formats reveals details about the robustness of the patterns of non-response with respect to mode of inquiry. For example, of the 25 questions for which “don’t know” was explicitly listed as an outcome choice in both modes, 40 percent of the questions exhibited a significantly greater non-response in the in-person mode. If there were truly no differences in non-response between the modes of surveying we would expect most of the questions to show a lack of difference between the modes (with a handful of expected errors placing some questions outside the “no difference” boundaries). For example, we might expect 95 percent of the cases to fall in the “no difference” category while two-and-a-half percent of the questions lined up on either side.
The pattern we show in Figure 1 is quite different from this expected one. Figure 1 shows the percentage-point difference in non-response (with 95 percent confidence intervals) by mode for each of the 25 questions that make up the listed group. To estimate the treatment effect we subtract the self-complete non-response from the in-person non-response, thus positive values indicate higher levels of non-response in the face-to-face treatment. For 40 percent of the questions there is a significantly higher level of non-response in the face-to-face interview relative to the self-completed interview when “don’t know” is listed as an option in both modes.Footnote 6 This is in contrast to the roughly two-and-a-half percent we would expect to find under conventional levels of uncertainty if in reality there were no differences between the modes.
Differences in non-response between face-to-face and self-completed surveys on questions with listed “don’t know” options Note: Plotting symbols are the percentage-point difference in non-response (FTF-SC) for each question. The solid bars are 95 percent confidence intervals.

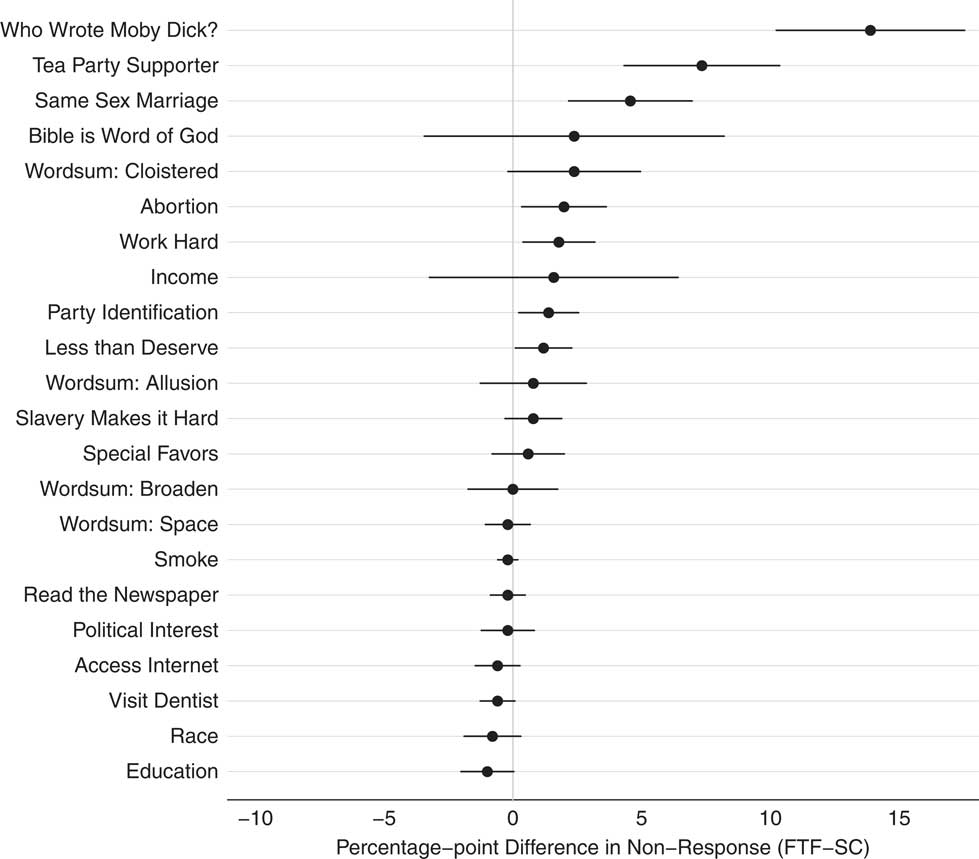
We turn now to an investigation of the same pattern for the 26 questions in the second category of comparison—those for which “don’t know” was not listed in either mode. Although the overall rates of non-response in this group are much lower than when “don’t know” is listed explicitly (see Table 2), there are still notable and significant differences by mode for many questions—and for 32 percent of the questions in this group we find higher non-response in the in-person interview. No questions exhibited the opposite result.
The single largest mode difference in non-response is found in the unlisted set of questions. Following a Pew Research Center poll that asked people who they thought wrote the novel Moby Dick, we administered a few fact-based questions to be sure the differences we might observe were not due to the sometimes sensitive nature of political questions. There was a 15-point increase in non-response in the face-to-face mode relative to the self-complete mode on the question about authorship of Moby Dick. This large difference was followed by another large difference of roughly 12 points on the open-ended question asking people to name the current Vice President of the United States. We present these results in Figure 2.
Differences in non-response between face-to-face and self-completed surveys on questions without listed “don’t know” options Note: Plotting symbols are the percentage-point difference in non-response (FTF-SC) for each question. The solid bars are 95 percent confidence intervals.

This basic overview of the experimental findings suggests that there are differences in the rates of non-response across survey modes and more specifically, increases in respondents’ likelihoods of saying they do not know the answers to questions when an interviewer is present regardless of whether “don’t know” is listed as an option explicitly. The increased rate of non-response in the in-person interview is significantly different from the expected pattern under a null hypothesis that there would be no difference between the modes. The share of questions exhibiting higher non-response in the in-person mode across the listed and unlisted comparison groups is not significantly distinguishable from zero. We present these comparisons in Table 3 and turn to exploring explanations for these patterns.
Percent of Questions with Significant Differences in Non-Response Due to Mode

Note: Significant differences are defined as those for which we can reject the null hypothesis of no differences in non-response between the modes with a 95 percent level of confidence. Under the null of no difference, we would expect to see nearly all of the questions falling in the middle column. Both the listed and unlisted patterns are statistically different than this expectation, although they are not distinguishable from one another.
Possible Explanations: Recency and Primacy
The fact that for nearly 40 percent of the questions, on average, we see increased non-response in the face-to-face interview and that the magnitude of the differences is only slightly greater in the listed category of questions than in the voluntary category helps to eliminate some of the canonical and possible explanations for the pattern, such as a recency effect in the in-person interview (choosing the last outcome an interview read out loud) or a primacy effect in the self-completed surveys (choosing the first outcome listed under the stem). For example, if respondents in the in-person interview, on average, choose don’t know options more frequently than respondents in the self-completed surveys because the words “or haven’t you thought much about this?” were the last thing the interviewer said before pausing for an answer (recency), we would expect to see more and larger differences across the modes for questions that follow this form (Figure 1) relative to questions that did not follow this form (Figure 2). While there are slightly more differences in the listed set of questions compared with the unlisted, they are only marginally larger in size (about two points), on average, in the listed set of questions.
More importantly, perhaps, a third of the questions exhibit higher rates of non-response in the face-to-face interview relative to self-complete even when the interviewer never says anything about a don’t know outcome (these results can be seen in the second row of Table 3). That is, many people in the face-to-face group told the interviewer they did not know the answer to a question even when it was not mentioned as a possible outcome in the stem of the question than skipped that same question in the self-completed survey. This pattern of results cannot be due to recency in the in-person interview because the non-response option is never offered out loud. The finding is made more striking by the realization that the question wording is exactly the same across the two modes.
These results suggest that recency is unlikely to be the only driver of non-response. In both cases, when “don’t know” is offered by interviewers (and on screen) as the final outcome, and when it is not offered at all, there is more non-response, on average, in the face-to-face mode.
In order to test for primacy effects (choosing the first outcome listed), we varied the response order for 15 of the questions on the survey. In all, 13 of these questions did not offer a fixed “don’t know” as the last outcome in either mode, thus they are also a reasonable test for recency effects. Comparisons of the distributions on these 15 questions suggest that respondents are not choosing the first or last outcome more than other outcomes, nor are there differences by mode (see Bishop and Smith (2001) for corroborating experimental evidence that visual versus aural modes of survey administration do not produce different rates of recency or primacy effects and that when these effects exist they are quite small). In these data, we are only able to reject the null hypothesis that response order and outcomes are unrelated for a single question in the in-person mode (support for same-sex marriage). Across all of the other questions for which we varied response order (issue questions, attitudes about race, vote choice, and party identification, for example) there were negligible differences in the outcomes based on the order in which outcomes were read out loud or read on the screen.
Specific Questions About Attitudes, Evaluations, & Beliefs
Having investigated basic survey design factors like recency and primacy as drivers of the patterns displayed in Figures 1 and 2, we move to a test of mechanisms based on survey response instead of design. We do this by examining the patterns of non-response across different types of questions like behavioral recalls compared with attitudes and ratings. This analysis provides leverage in identifying possible mechanisms that involve the presence of an interviewer for the patterns in these figures.
The first set of results to provide some insight into what might be going on is that questions about attitudes, evaluations, issue positions, and factual knowledge exhibit increased non-response in the face-to-face mode, but reports of behavior and demographic indicators show no such increase. This is exactly what the belief-sampling model of survey response predicts as the ongoing biographical narrative described by Tourangeau, Rips and Rasinski makes behavior reports easier to recall, regardless of contextual confounds.
In our survey, questions drawing on attitudes and beliefs consist of six evaluations of candidates or groups, four questions about ideology, four questions about racial anxiety, two hypothetical presidential elections match-ups, and seven questions about political issues. We asked respondents to rate President Obama on favorability and ideology, along with the most well-known Republican party contender at the time, Mitt Romney, and the least well-known of the Republican field, Jon Huntsman (according to national polls in the field at the time). We also asked them to rate themselves. Among attitude-based questions, we find the biggest difference in non-response between the modes on questions involving Huntsman, which is expected as most people knew very little about him and were therefore less likely to have well-formed considerations about him. In the face-to-face interview nearly 73 percent of respondents failed to rate Huntsman on favorability. In the self-complete mode, fewer people (60 percent) opted out of rating Huntsman—a drop of 13 points. Similarly, when we asked respondents who they would vote for in November if the election were a choice between Barack Obama and Jon Huntsman, 42 percent said they didn’t know when an interviewer asked, but only 32 percent failed to choose in the self-complete survey.Footnote 7
Differences in the same direction persist for questions about perceived ideological placements of candidates and for ideological self-placements as well, although they are not quite as large as for favorability ratings (see Figure 1). In terms of issue positions, we asked respondents about their positions on the following issues in order of declining levels of differences in non-response: defense spending, raising taxes, same-sex marriage, immigration, the state of the economy, abortion, and health care. All of the issues except health-care preferences exhibit a statistically significant higher rate of non-response in the face-to-face survey.
All totaled, nearly three-quarters of the 23 questions about attitudes, evaluations, and issue positions revealed significantly higher non-response in the in-person interview. Only two questions had differences in the opposite direction, only one of which (health care) was significant.
In contrast to the results on attitudes, and as expected based on theories of survey response, there were far fewer differences in non-response for questions about behavioral recall. For the ten questions in the survey that ask respondents to report on their behavior (being registered to vote, making it the polls in 2008, vote choice in 2008, visiting to the dentist, going to church, reading a newspaper, using the gym, drinking alcohol, smoking, or using the internet) only a single question exhibited a significant difference between the modes—a questions asking for the number of days in the past week on which the respondent had consumed alcohol. In this case, there was slightly less non-response in the in-person mode than in the self-completed mode.
In determining what to make of this pattern, it is important to bear in mind that while we typically think of non-response as a normatively bad thing, there is no reason to assume that the increased level of non-response in the in-person interview is an artifact of the mode while the self-completed results reflect respondents’ true underlying opinions or knowledge. As all of the attitude questions are subjective in nature, we have no way of ascertaining which mode comes closer to “the truth.” Anticipating this situation, we designed the survey with a set of questions to help sort out which mode better reflected what respondents may actually know.
We asked six questions with factually correct answers. To the extent that we see increased levels of correct responses across the questions in the self-complete mode coinciding with lower levels of non-response, we will have some purchase on whether the interviewer is somehow influencing which considerations a respondent brings to bear on answering a question (as described earlier), in this case, potentially by interacting with respondent characteristics, exacerbating things like confidence, anxiety, or the willingness to take risks—and ultimately garnering a non-response from someone in the in-person setting who might actually have a substantive answer to the question that they choose not to give.
Questions About Facts
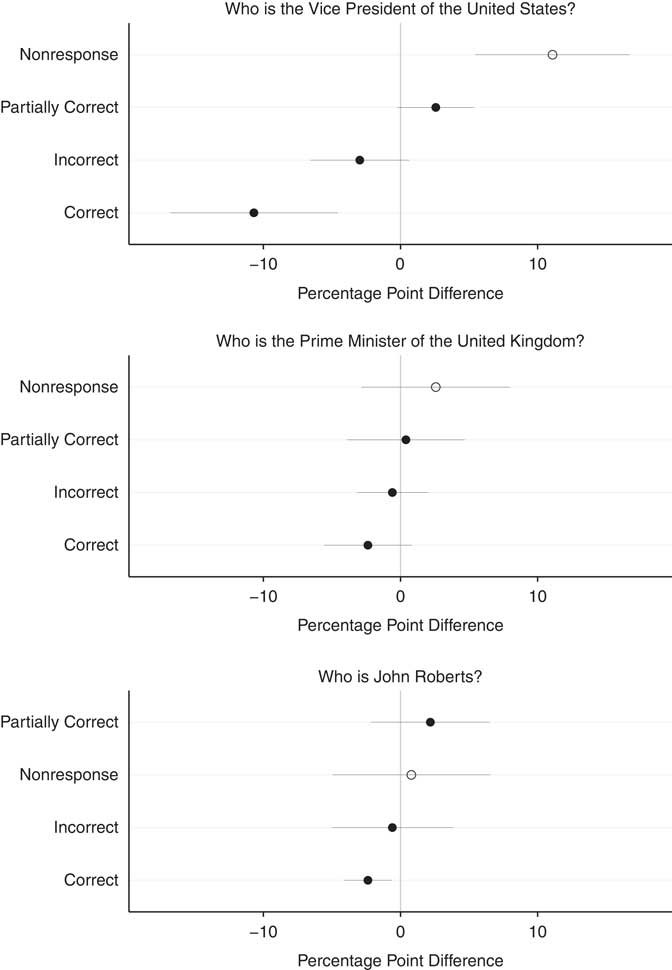
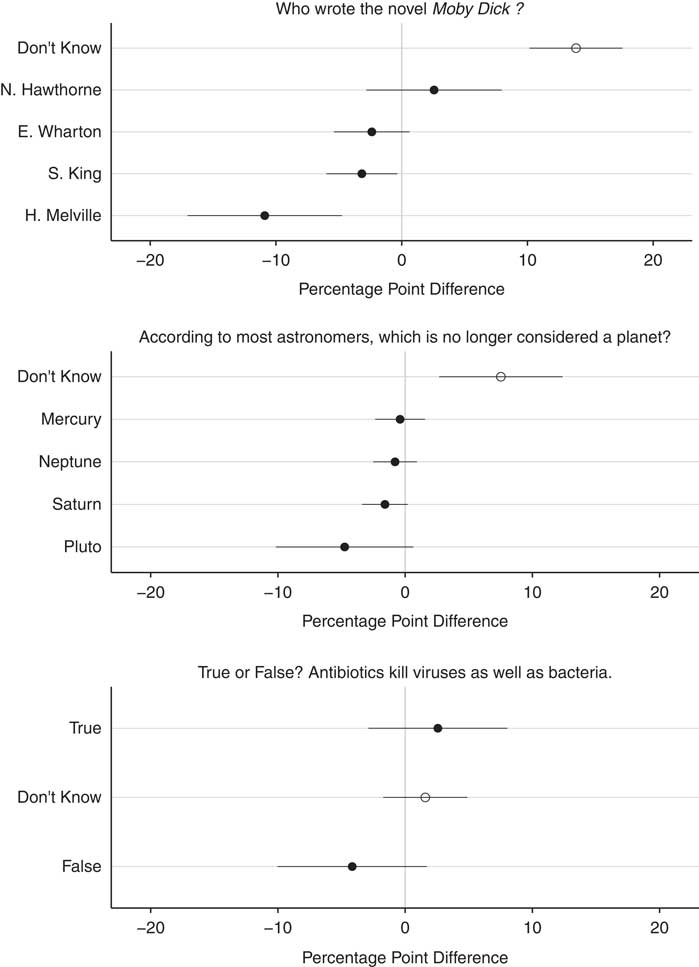
Decades of research in education testing demonstrates that when students are offered the chance to say “don’t know” on test questions, knowledge assessments suffer because the questions tap two different constructs: knowledge and the propensity to make a guess. Mondak and Davis (Reference Mondak and Davis2001, 212), using a split-half experimental design across three different interviewer-assisted surveys at different points in time, demonstrate that reducing the share of don’t know responses (by eliminating it as an outcome category) increased the number of correct responses overall and per capita. We demonstrate the same pattern here for each of our fact-based questions, non-response goes down and correct answers go up, but not because of the elimination of don’t know as an outcome category. The cause in our experiment is the mode of survey administration: taking the interviewer out of the survey experience decreases non-response and increases the number of correct answers on average and per capita. We present these differences in Figure 3 for open-ended political knowledge questions and in Figure 4 for non-political closed-ended questions.
Differences by Mode for Open-Ended Knowledge Questions Note: Plotting symbols reflect face-to-face values minus self-complete. Bars represent 95% confidence intervals.

Differences by Mode for Close-Ended Knowledge Questions Note: Plotting symbols reflect face-to-face values minus self-complete. Bars represent 95% confidence intervals. For the Moby Dick question, a DK option was not explicitly given in either mode.

We asked three open-ended political knowledge questions about who holds the job of Vice President, Prime Minister of the United Kingdom, and Chief Justice of the Supreme Court. In the first two cases, respondents had to come up with the name of the person who holds the job with no choice set provided and in the last case they had to name the job held by John Roberts. These questions resemble those used in the ANES, but we coded the answers allowing for a middle category of “partially correct.”Footnote 8
One of the most compelling difference in non-response across the survey modes comes from the question asking respondents to name the sitting Vice President of the United States. Roughly 61 percent of respondents, on average, got this question right and 55 percent got it exactly right. The difference by mode is striking: only 50 percent of respondents in the in-person interview came up with the name Joe Biden, but slightly more than 60 percent of self-complete respondents did so; and there is an increased rate of non-response in the face-to-face interview of more than 11 points.Footnote 9 Similarly patterned, although substantively smaller and insignificant, differences exist for the other two open-ended questions, which were generally much more difficult for respondents to answer correctly.
We also asked three closed-ended, non-political questions frequently used by the Pew Research Center. These questions ask respondents to identify which celestial object astronomers no longer considered to be a planet in our solar system, name the author of Moby Dick, and choose whether it was true or false that antibiotics kill viruses as well as bacterial infections. We present the differences by mode in Figure 4. In each case, a familiar pattern emerges, more non-response in the face-to-face interview and increased rates of correct responses in the self-complete. The most striking difference comes from the question about Moby Dick, which 52 percent of respondents correctly answered. There is nearly a 15-point increase in non-response for this item in the face-to-face mode. The increase in the number of people saying Herman Melville was slightly greater than ten points for the self-complete responses. Similarly, there is nearly a ten-point increase in non-response in the face-to-face mode on the Pluto question (74 percent of respondents knew this, on average) and a five-point increase in non-response on the antibiotics question (66 percent knew this).
These fact-based tests are a first step toward understanding whether the decreased rates of non-response in the self-completed interview are normatively a good thing. Although a better design would test with in-person differences by mode, the examination of these six questions suggests that while people are more likely, on average, to say “I don’t know” in an in-person interview, the incidence of correct responses goes up in the self-completed interview, on average, as well.
Across questions about attitudes, beliefs, and facts, both closed and open-ended, about politics and non-political topics, the same pattern emerges: in-person interviewing generates higher levels of item non-response than self-completed surveys. Although we are not in a position to illustrate the exact cause of the difference in non-response by mode, the increased incidence of factually correct answers in the self-completed surveys relative to the in-person interviews mimics the findings in educational testing (Cronbach Reference Cronbach1946), and by Mondak and Davis (Reference Mondak and Davis2001) in political science specifically, demonstrating the effects of encouraging people to say “I don’t know”—in this case merely by having a human being for them to say it to.
Our experimental results taken in context with previous findings suggest that when the interviewer is removed from the survey experience, respondents’ personal characteristics interact less significantly with the administration of the survey. To investigate this, we explore variation on respondent characteristics and their relationship to increased levels of non-response in face-to-face surveys.
Modeling Non-Response
We begin with a simple, individual-level model of item non-response. There are many known predictors of item non-response (Converse Reference Converse1964; Converse Reference Coombs and Coombs1970; Francis and Busch Reference Francis and Busch1975; Converse Reference Converse1976; Rapoport Reference Rapoport1982; Krosnick 1991; Delli Carpini and Keeter Reference Delli Carpini and Keeter1996; Tourangeau, Rips and Rasinski Reference Tourangeau, Rips and Rasinski2000; Althaus Reference Acree, Ekstrand, Coates and Stall2003; Holbrook, Green and Krosnick Reference Holbrook, Green and Krosnick2003; Berinsky Reference Berinsky2004; Heerwegh and Loosveldt Reference Heerwegh2008) and we will control for as many of them as possible before focusing on two things in particular—a respondent’s level of cognitive skill and its interaction with survey mode. In their student-based experiment, Chang and Krosnick (Reference Carroll2010) found that college-reported standardized test scores (like Scholastic Aptitude Test (SAT) scores from the admissions office) interacted with the mode of interview such that students with lower levels of aptitude (as predicted by their SATs) demonstrated lower levels of concurrent validity and non-differentiation in the interviewer-assisted mode than in the self-administered mode. We build on that finding by examining the role of cognitive skill in an adult population and extending the analysis to item non-response. If these data corroborate Chang and Krosnick’s result among adults, with a real face-to-face interview and a subset of proven measures of cognitive skill from the GSS, we will have learned something specific about how the mode of interview is affecting particular respondents with respect to non-response.
We sum item non-response within six categories of questions in the survey: issue positions, behaviors, ideology, favorability ratings, vote choice, and facts. We form the dependent variables by simply adding up the number of times a respondent gave a non-response. The questions that form each sum are detailed in Table 4. The total range of each tally is on the bottom row of Table 4.
Questions Included in Non-Response Index by Topic

Note: Dependent variables are the sum of non-responses within each set of questions. We do not model answers to demographic questions and questions about other personal characteristics. We have also omitted the open-ended questions as the incidence rate of non-response on those questions is notably higher than for closed-ended questions. We do not model questions about racial prejudice as these questions interact with the race of the interviewer in ways that limit their generalizability across the modes.
Our models of non-response include indicators for African American and Hispanic ethnicity, education, partisan identifiers, political knowledge, gender, and mode of interview. We also control for age and income. As a measure of cognitive skill, we use four of the ten WORDSUM vocabulary items that have appeared regularly on the GSS since 1972, choosing items from each of the difficulty levels known to provide discrimination.Footnote 10 We are not only interested in whether this scaled measure of aptitude affects item non-response across our topics, but also whether it interacts with the mode of interview in a particular way.Footnote 11 Specifically, we have in mind Chang and Krosnick’s (Reference Carroll2010) claim that low-skilled respondents have a harder time answering questions in interviewer-administered surveys than they do in self-administered ones.
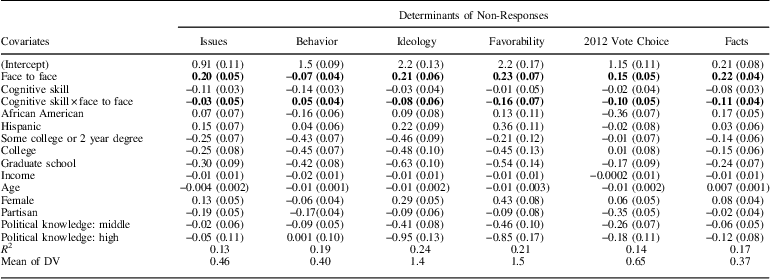
We present the results of these investigations in Table 5.Footnote 12 As expected, the indicator for face-to-face mode assignment shows a significant increase in non-response across all the topics except reports of behavior (as discussed previously). To get a sense of the magnitude of the effects, consider the results for questions about political ideology. We asked respondents to place Romney, Obama, Huntsman, and themselves on a five-point ideology scale. Non-response for this set of questions ranges from 0 to 4. The average difference between the modes on item non-response for ideology, controlling for the factors listed above, is a 0.25 increase in the in-person interview. This corresponds to a 6.25 percent increase in non-response due purely to mode of interview. Similarly, the data reveal a 7 percent increase in non-response in the in-person interview on questions of fact and vote choice, all else equal.
Models of Non-Response by Question Topic

Note: Cell entries are ordinary least squares coefficients with standard errors in parentheses. The dependent variable (DV) in each model is the sum of non-responses for each topic (see Table 4 for questions within each topic). Number of cases is 1010.
Bold values indicates the coefficients discussed in text.
Even controlling for education and level of political information, cognitive skill has a direct effect on non-response for half of the topics we investigate (decreasing skill leads to more non-response, all else equal). In most cases, the size of the effect is considerably smaller in magnitude than the effect due to mode of interview.
To illustrate the impact on non-response of face-to-face interviews and put these results in context, consider the results for issue positions. The average effect from mode of interview is 0.17 and the effect for increasing values on cognitive skill is 0.11 (cognitive skill has a mean of 0 and a SD of 1). These results suggest that for questions about issue positions we would have to make people one-and-a-half standard deviations smarter (in terms of cognitive skills) to produce roughly the same size effect that is obtained from shifting from an in-person to a self-complete instrument. For many of the questions, the increases would have to be even greater.
Additional and heterogeneous costs of the in-person interview are evident when we examine the interaction between survey mode and cognitive abilities. The increases in non-response due to face-to-face interviewing are significantly greater for respondents with low levels of skill. For three of the six topic areas, the interaction between mode of interview and cognitive skill is both substantively important and statistically different from zero—that is, for many of the questions on the survey, not only was there an increase in non-response in face-to-face interviews relative to self-complete interviews, but this increase was exacerbated for respondents with low levels of cognitive skill. For questions about favorability, vote choice, and factual knowledge, the difference in the effect of a face-to-face interview instead of a self-completed one for people with low levels of cognitive skill compared with those with average levels is quite large. For questions of favorability ratings, for example, there is a 69 percent increase in the effect of a face-to-face interview on non-response depending on whether the respondent has low cognitive skills or average levels. For fact-based questions, the increase in the effect of the in-person mode on non-response is 50 percent greater for the lower skilled person relative to the average person.Footnote 13
Further, when we examine correct answers to fact-based questions (instead of non-response), we find a significant increase in correct choices in the self-completed interviews for people with low-levels of skill, relative to those with higher levels of cognitive abilities on items asking about Moby Dick and the Vice President. While people with higher skill levels get the answers right more often, they do so equally in both modes. On the Moby Dick question, for example, people with lower levels of skill were 15 points more likely to choose Herman Melville in the self-completed mode relative to the in-person one (high-skilled people showed no significant difference).
To further demonstrate the way cognitive skill interacts with mode of an interview, consider two otherwise average respondents answering typical survey questions about vote choice in an upcoming election. One respondent is a standard deviation below the mean on cognitive skill the other is 1 SD above it. The difference in the amount of non-response on vote choice questions between these two respondents is minimal for the self-complete mode of interview—moving from the higher skill level to the lower, all else equal, increases non-response by only 7.2 percent. But in the in-person mode, moving from high skills to low skills increases non-response by 40 percent. That is a nearly 500 percent increase in the rate of skill-based differences in non-response due to mode of interview alone.
Conclusion and Implications
The results of this randomized trial assigning respondents to different modes of survey after they agree to participate suggest that the presence of an interviewer affects the answers people give with respect to non-response. For nearly 40 percent of the questions on the survey there were significantly higher levels of non-response from respondents assigned to the face-to-face survey compared with those assigned to the self-complete survey. If the mode of interview was having no effect on people’s answers, we would expect this number to be closer to zero. These patterns exist across multiple styles and formats of questions with varying ways of expressing non-response and they do not seem to be driven by primacy or recency of outcomes.
More importantly, however, our findings show that certain kinds of people are more affected by the presence of an interviewer than others. The in-person interview is more likely to lead to item non-response for respondents with low levels of cognitive abilities relative to those with high levels. These results obtain even controlling for respondents’ levels of education and political knowledge. While this experiment is the first to demonstrate this pattern on an adult population, it is the second to demonstrate the general and potentially deleterious link between cognitive ability and in-person interviewing (see Chang and Krosnick Reference Carroll2010).
Finally, the evidence we present speaks to two ongoing debates in survey research. The first is about both how to interpret over time dynamics in survey responses that span differences in mode. The second is how to understand differences in apparent knowledge between online convenience samples and other samples generated by probability methods. Our findings suggest that interpreting over time dynamics from data that cross survey modes may be a fraught exercise—or at least one that requires attention to the nuances of non-response; and that the differences in knowledge, which are often attributed to sample composition, may be due—at least in part—to mode of inquiry, not sample alone, if at all.