

The share of the U.S. population eschewing religious ties has been growing over the last several decades, with the religiously unaffiliated predicted to near majority by 2070 (Pew Research Center, 2025). Yet, we have no shortage of evidence that atheists are a social pariah and that prejudice toward them has been slow to change (e.g., McCarthy, Reference McCarthy2019; Smith, Reference Smith2019). In line with other research on the causal links between social identities and candidate appraisal, anti-atheist stigma—rooted in perceptions of atheists’ untrustworthiness and immorality—has both indirect and direct manifestations in electoral politics (Cook et al., Reference Cook, Cottrell and Webster2015; Djupe et al., Reference Djupe, Calfano, Back, Calfano and Djupe2013; Franks, Reference Franks2017; Franks et al., Reference Franks, Scherr and Gibson2019; Gervais, Reference Gervais2014; Gervais et al., Reference Gervais, Shariff and Norenzayan2011, Reference Gervais, Xygalatas, McKay, van Elk, Buchtel, Aveyard, Schiavone, Dar-Nimrod, Svedholm-Häkkinen, Riekki, Kundtová Klocová, Ramsay and Bulbulia2017; Grove et al., Reference Grove, Rubenstein and Terrell2020).
Nonreligious candidates for office indirectly suffer the consequences of anti-atheist stigma because there is a de facto requirement in U.S. elections that political candidates display their religiousness when pleading for voters’ support, and, conversely, “not demonstrating religiousness [can be] a significant roadblock for winning public office” (e.g., c.f., Campbell et al., Reference Campbell, Layman and Green2021; Clifford and Gaskins, Reference Clifford and Gaskins2016, 1088; Djupe and Calfano, Reference Djupe and Calfano2014). Steadily growing experimental scholarship on the impact of nonreligion on appraisal of atheist candidates for political office also shows that anti-atheist stigma has directly negative consequences for atheists’ electability (e.g., Campbell et al., Reference Campbell, Layman and Green2021; Djupe and Calfano, Reference Djupe and Calfano2014; Golebiowska, Reference Golebiowska2024). Adding nuance to research focusing on atheists, recent work demonstrates that candidates with a “softer secular edge” are more palatable to voters than atheists (e.g., Campbell et al., Reference Campbell, Layman and Green2021; Golebiowska, Reference Golebiowska2024). At the same time, nonreligious Americans are one of the most dramatically underrepresented groups in elective office given that they currently account for about 30% of the general population but less than 1% of Congress (General Social Surveys, 2022; Pew Research Center, 2023).
While atheists are anathema in general—and nonreligious candidates with less stridently secular views suffer biases in political evaluation as well—aggregate effects of candidate nonreligion conceal a wide partisan gulf (e.g., Campbell et al., Reference Campbell, Layman and Marsh2024; Golebiowska, Reference Golebiowska2024). Democrats are relatively open to nonreligious candidates, whereas Republicans’ views are characterized by a significant amount of aversion (Campbell et al., Reference Campbell, Layman and Green2021, Reference Campbell, Layman and Marsh2024; Golebiowska, Reference Golebiowska2024). That said, the nature of the partisan divide in openness to nonreligious candidates hinges on how nonreligion is framed (e.g., Golebiowska, Reference Golebiowska2024).
Partisan differences in responses to candidate nonreligion are large, but they are conflated with respondent religiosity. Because the Democratic party is home to a large number of nonreligious individuals and the Republican party is dominated by the religiously devout, partisan differences may simply reflect the religious-secular distribution of the party faithful (Campbell et al., Reference Campbell, Layman and Marsh2024). To be sure, some Republicans are nonreligious, and a new fault line dividing religious and nonreligious Republicans has been forming in the Donald Trump era (Campbell et al., Reference Campbell, Layman and Green2021). Alternatively, partisan differences in openness to nonreligious candidates may be driven by ingroup favoritism, with Democrats more willing to support them because atheists stereotypically share their partisanship (Campbell et al., Reference Campbell, Layman and Marsh2024; Djupe et al., Reference Djupe, Calfano, Back, Calfano and Djupe2013). Once Democrats’ and Republicans’ willingness to support atheist candidates is examined separately among nonreligious and religious respondents, religiosity emerges as an important predictor of receptivity to atheist candidates within both parties—although partisan differences remain (Campbell et al., Reference Campbell, Layman and Marsh2024). In short, we know that both partisanship and religiosity shape openness to atheists running for elective office. Yet, most nonreligious Americans reject the atheist label as a description of their religious identities, and we have no experimental evidence bearing on the question of how partisanship and religiosity combine to affect receptivity to candidate nonreligion conceptualized more broadly (Pew Research Center, 2025).
Moreover, given the growing alignment between Americans’ partisan and social identities, other intraparty differences in responses to nonreligious candidates deserve attention—whether those stemming from differences in the parties’ ethno-racial, educational, or generational makeup (Mason and Wronski, Reference Mason and Wronski2018; Pew Research Center, 2024). Combined with the demographic changes in the composition of the U.S. population and how they have been playing out within the two major political parties, attention to intraparty differences promises to add more nuance to forecasts about the consequences of secularization for access to elective office. Additionally, such differences have implications for party adherents’ openness to nonreligious candidates in different constituencies and, therefore, for nonreligious candidates’ strategies for building winning electoral coalitions.Footnote 1 Examination of generational differences in Democrats’ and Republicans’ comfort with nonreligious candidates, while controlling for religiosity, is especially important from the perspective of forecasting evolution of receptivity to nonreligious candidates over time. To date, we have no systematic experimental evidence to illuminate how openness to broadly conceived candidate nonreligion depends on a combination of respondent partisanship, religiosity, and age.
Finally, while existing research advances our understanding of the causal impact of nonreligion on candidate appraisal, it is mostly based on factorial experiments and nonprobability samples (c.f., Golebiowska, Reference Golebiowska2024; Kiesel, Reference Kiesel2024). Factorial experiments can establish whether nonreligion is a factor in political choice but—unlike conjoint experiments—cannot adjudicate the relative importance of nonreligion and other factors. Although nonprobability samples are appropriate for testing causal effects, methodologists underscore the need for replication with representative samples, especially when the effects one examines—like the effect of nonreligion on candidate evaluation—are not homogeneous but contingent on other theoretically relevant factors (Jerit and Barabas, Reference Jerit and Barabas2023; Malhotra and Krosnick, Reference Malhotra and Krosnick2007; Mullinix et al., Reference Mullinix, Leeper, Druckman and Freese2015). Because the impact of nonreligion on political evaluation is moderated by respondent partisanship—and, therefore, not homogeneous—replication with nationally representative samples is desirable.
With this in mind, I have several objectives in this article. Focusing on broadly conceptualized nonreligion, I set out to 1) partially replicate experimental findings on the impact of nonreligion on political appraisal with data from a conjoint experiment embedded in a nationally representative survey; 2) shed light on the relative importance of candidate nonreligion and other factors that influence political support; 3) investigate how respondents’ partisanship and religiosity interact to affect receptivity to candidate nonreligion; and 4) examine how respondents’ age and religiosity interact to influence Democrats’ and Republicans’ openness to candidate nonreligion.
As a brief preview, the results I discuss in further detail below echo some of the findings reported in previous research but also diverge from them in important ways and offer new insights. I find that nonreligion is an important influence on candidate appraisal, although I also find that its impact depends on how it is framed—atheists encounter a good deal of hostility, even among Democrats, but candidates with a softer secular edge are less politically radioactive, even among some Republicans. While Democrats are more open to nonreligious candidates than Republicans, willingness to support nonreligious candidates is also contingent on the framing of candidate nonreligion and respondent religiosity. For example, religious Democrats are as averse to atheist and agnostic candidates as nonreligious Republicans. Finally, willingness to support nonreligious candidates has a generational component, especially among Democrats, with younger respondents generally more comfortable—or less uncomfortable—with candidate nonreligion than their older counterparts. For instance, nonreligion, and especially atheism, is an electoral asset for younger nonreligious Democrats. In contrast, nonreligion, and especially atheism, is an especially decisive and negative factor for religious older Republicans who are even less likely to pick an atheist candidate than one who is a Democrat.
Before I continue, it behooves me to discuss why it is crucial to have nonreligious legislators. Or, to put differently, what difference would their greater presence in elective office make? At least two reasons come to mind. Greater representation of nonreligious Americans in elective office might result in different policies (substantive representation), or, even if it did not, it might have positive effects for the large and rapidly growing group of secular Americans (Kiesel, Reference Kiesel2024). Research on the impact of other underrepresented groups in elective office supports both scenarios. For example, even though research on the impact of gender (and other social identities) on congressional policymaking shows that “congressmen and congresswomen often vote a party line,” gender and other social identities shape the composition of “the national agenda and the choices made by those bills” (Svers, Reference Svers2020, 19). Therefore, even if nonreligious legislators may vote a party line on bills on the legislative agenda, they might initiate policies that may otherwise not be a high priority for their party—such as those that protect the constitutional principle of the separation of church and state.
Even in the absence of policy impact, greater descriptive representation of nonreligious people can be expected to have salutary consequences for American democracy. First, a representative body that more accurately mirrors its constituency sends a clearer message “about which groups are perceived as ‘fit to rule’” (Mansbridge, Reference Mansbridge1999). Similarly, descriptive representation provides role models for marginalized groups who inspire others to reimagine what is possible. Descriptive representation may also reduce the feelings of marginalization and alienation that nonreligious individuals may experience (Kiesel, Reference Kiesel2024).
In short, it is important to examine the nature and prevalence of biases that voters harbor against nonreligious candidates and in what corners of the population these biases may be diminishing. Given the importance of voters’ party identification and religiosity in understanding the sources of biases against nonreligious candidates, it is important to examine more carefully the role that these factors play in willingness to support different kinds of nonreligious candidates. Relatedly, it behooves us to investigate how party identification, religiosity, and age interact to affect support for nonreligious candidates for office—whether those labeled as atheists or representing less radioactive varieties of nonreligion—because growing secularization is driven by younger people through generational replacement.
Conceptual framework
Scholarly interest in the role of nonreligion in electoral politics engages the broader experimental literature on social identities—be it gender, race or ethnicity, sexual orientation, or religion—as heuristics in candidate appraisal (e.g., Bauer, Reference Bauer2015; Berinsky and Mendelberg, Reference Berinsky and Mendelberg2005; Golebiowska, Reference Golebiowska2001; Kalkan et al., Reference Kalkan, Layman and Green2018; McDermott, Reference McDermott2007, Reference McDermott2009). Experimental research, best suited for capturing causal effects, demonstrates that social identities facilitate political appraisal because they trigger “cues about [candidates’] partisanship [and] policy stands” (Kalkan et al., Reference Kalkan, Layman and Green2018, 802); associated stereotypes and prejudices (e.g., Golebiowska, Reference Golebiowska2001; Sigelman et al., Reference Sigelman, Sigelman, Walkosz and Nitz1995); and a baseline for assessing a candidate’s aptitude for elective office vis-à-vis voters’ expectations regarding desirable attributes of good politicians (Madrid et al., Reference Madrid, Merolla, Ruiz and Schroedel2022). In keeping with this conceptualization, atheists are stereotyped as Democrats and liberals (Campbell et al., Reference Campbell, Layman and Green2021) and are perceived to be immoral (Gervais, Reference Gervais2014; Gervais et al., Reference Gervais, Xygalatas, McKay, van Elk, Buchtel, Aveyard, Schiavone, Dar-Nimrod, Svedholm-Häkkinen, Riekki, Kundtová Klocová, Ramsay and Bulbulia2017), untrustworthy (Franks et al., Reference Franks, Scherr and Gibson2019; Gervais et al., Reference Gervais, Shariff and Norenzayan2011; Grove et al., Reference Grove, Rubenstein and Terrell2020), and generally incompatible with service in elective office (e.g., Golebiowska, Reference Golebiowska2024; Madrid et al., Reference Madrid, Merolla, Ruiz and Schroedel2022).
The framing of candidate nonreligion and political appraisal
While most of the existing experimental literature on nonreligion in candidate appraisal focuses on atheists, recent work investigates political consequences of nonreligion conceptualized more broadly (e.g., Campbell et al., Reference Campbell, Layman and Green2021; Golebiowska, Reference Golebiowska2024). This scholarship represents an important extension of research on nonreligion in politics because most nonreligious Americans eschew the atheist label (Pew Research Center, 2025). What is more, there is reason to expect that nonreligious candidates with less stridently secular views will suffer less prejudice than atheists. Specifically, the socio-functional threat-based theory of prejudice suggests that atheists may encounter more prejudice than nonreligious candidates with less stridently secular views because they are likely seen as more threatening to respondents’ values and religion in the public sphere and less trustworthy as well as elicit more anger, moral disgust, and anxiety (e.g., Cottrell and Neuberg, Reference Cottrell and Neuberg2005; Franks and Scherr, Reference Franks and Scherr2014; Golebiowska, Reference Golebiowska2026). Consistent with this conceptualization, recent research reports that “secularity is not necessarily fatal” in political evaluation (e.g., Campbell et al., Reference Campbell, Layman and Green2021; Castle et al., Reference Castle, Layman, Campbell and Green2017, 210; Golebiowska, Reference Golebiowska2024). Additionally, this work suggests that the political impact of prejudice toward nonreligious candidates may depend on the office for which they are running (Golebiowska, Reference Golebiowska2024; c.f., Campbell et al., Reference Campbell, Layman and Marsh2024); the informational environment in which they are competing (Golebiowska, Reference Golebiowska2024); and participants’ predispositions—such as party identification and religiosity (Campbell et al., Reference Campbell, Layman and Green2021, Reference Campbell, Layman and Marsh2024; Golebiowska, Reference Golebiowska2024; Kiesel, Reference Kiesel2024).
I build on this literature by partially replicating the findings concerning the overall impact of nonreligion broadly conceptualized with data from a nationally representative conjoint experiment. To this end, I juxtapose the likelihood of supporting atheist candidates, candidates who are not sure there is a God, and candidates who do not identify with any religion with the likelihood of supporting Christian candidates or those who attend religious services weekly (see Supplementary Material for why these five categories have been selected). As part of this investigation, I compare and contrast the importance of nonreligion and other factors that shape candidate appraisal. Since atheists are generally perceived as more threatening to respondent values, more untrustworthy, and more immoral than nonreligious politicians with a softer secular edge (Golebiowska, Reference Golebiowska2026), I hypothesize that:
H1: Nonreligious candidates will earn less support than religious candidates, although the electoral penalty will be biggest for atheists, smaller for candidates who are not sure there is a God, and smallest for candidates who lack a religious identification.
Candidate nonreligion and respondent partisanship
As I noted above, the aggregate penalty that comes with nonreligion “camouflage[s] important nuance in the role that partisanship plays in political appraisal” because of a chasm that separates Democrats’ and Republicans’ views (e.g., Campbell et al., Reference Campbell, Layman and Marsh2024; Golebiowska, Reference Golebiowska2024, 22). While atheists can expect little to no prejudice from Democrats and considerable opposition from Republicans, how party identification moderates the impact of nonreligion on political appraisal depends on whether respondents evaluate atheists or nonreligious candidates with a “softer secular edge” (Campbell et al., Reference Campbell, Layman and Green2021; Golebiowska, Reference Golebiowska2024). For example, while Democrats are generally more comfortable with nonreligious candidates, candidates who explicitly reject belief in God are a bridge too far even for Democrats (Campbell et al., Reference Campbell, Layman and Green2021; Golebiowska, Reference Golebiowska2024). Similarly, although Republicans generally display a great deal of aversion toward atheist candidates, they find candidates described as secular significantly more palatable (Golebiowska, Reference Golebiowska2024). In the terminology of the socio-functional, threat-based theory of prejudice, Democrats likely see nonreligious candidates as significantly less threatening and are, therefore, less likely to perceive them as untrustworthy or experience moral disgust, anxiety, or anger when thinking about them (Golebiowska, Reference Golebiowska2026). On the other hand, Republicans likely see nonreligious candidates as significantly more threatening and are, therefore, more likely to perceive them as untrustworthy or experience moral disgust, anxiety, and anger when thinking about them (Golebiowska, Reference Golebiowska2026).
I re-examine how partisanship conditions openness to nonreligious candidates broadly conceptualized with nationally representative data, generally expecting that Democrats will be less likely to discriminate against them than Republicans will. More specifically, I hypothesize that:
H2: Republicans will be less likely to support nonreligious candidates, especially when they are identified as atheists, whereas Democrats will be more likely to support nonreligious candidates—although they might be relatively more averse to candidates who doubt that God exists.
Candidate nonreligion and intraparty differences
The sizable partisan gap in openness to nonreligious candidates is not surprising. What is less obvious is the exact genesis of this gap—does it mostly reflect religious differences in the two parties’ makeup, or might it originate in Democrats’ ingroup favoritism since nonreligious Americans are stereotyped to be Democrats? Using evidence from several factorial experiments, Campbell et al. (Reference Campbell, Layman and Marsh2024) find that “religiosity plays the principal role in how voters react to atheists running for office…but Democrats still seem to react more positively than do Republicans” (Reference Campbell, Layman and Marsh2024, 34, emphasis added). The question heretofore unexamined experimentally is how candidate nonreligion, conceptualized broadly, combines with respondent partisanship and religiosity to shape receptivity to candidates with a softer secular edge and, in turn, whether this receptivity has a generational component. For example, can candidates with a softer secular edge earn political support in some pockets of the Republican party (e.g., nonreligious party identifiers or those who are not only nonreligious but also younger) or expect to encounter opposition in some corners of the Democratic electorate (e.g., religious Democrats or older religious Democrats)?
I test two hypotheses regarding intraparty differences. First, I anticipate that the impact of candidate nonreligion will be jointly conditioned by its framing and respondents’ partisanship and religiosity such that:
H3: Nonreligious candidates will suffer a bigger loss of political support, especially when they are atheists, among religious than nonreligious Democrats and Republicans. At the same time, Republicans will be less likely than Democrats to support all nonreligious candidates, especially when those candidates are described as atheists.
Second, I investigate generational differences in the impact of candidate nonreligion as a joint function of its framing and respondents’ partisanship and religiosity. Given that younger Americans are generally more open to diversity and less religious than older Americans (Abel, Reference Abel2022), I hypothesize that:
H4: Younger nonreligious respondents, especially Democrats, will be less likely to discriminate against nonreligious candidates than their older nonreligious counterparts. Generational differences among religious respondents will be smaller, especially among Republicans.
Method
I use a conjoint experiment embedded in a nationally representative survey conducted by the National Opinion Research Center (NORC) at the University of Chicago to test the above-described hypotheses. The study was funded and fielded by the Time-Sharing Experiments for the Social Sciences (TESS, 2024). TESS relies on NORC’s AmeriSpeak® Panel to recruit potential research participants (see Supplementary Material for more information about the AmeriSpeak® Panel). On the basis of a power analysis, twelve hundred and fifty respondents were invited to participate in the study, and 1,274 completed it.Footnote 2 The study was pretested with a sub-sample of AmeriSpeak® panel members on March 29, 2024. Following the review of the data they provided, the remaining AmeriSpeak® panelists were invited to participate on April 2, and data collection concluded on April 18, 2024.
Conjoint design
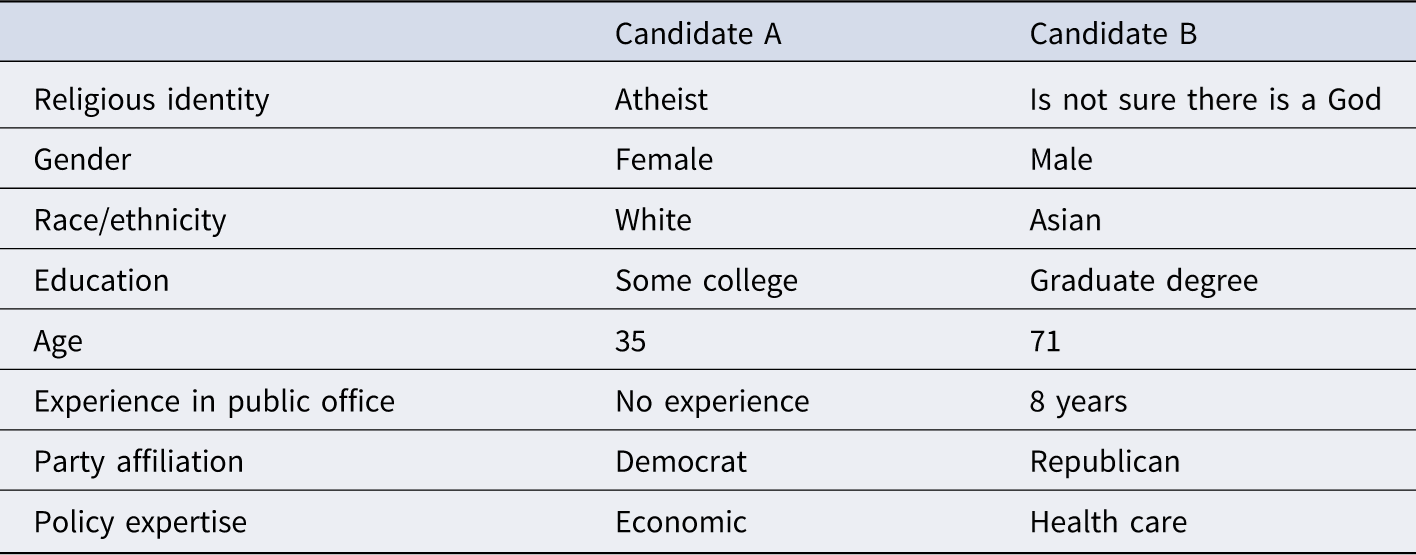
On the model of a typical conjoint experiment in political science, participants reviewed a series of tables featuring profiles of eight hypothetical political candidates who might be competing in elections in which they could vote (Bansak et al., Reference Bansak, Hainmueller, Hopkins, Yamamoto, Druckman and Green2021). Each table included eight randomly varied attributes of “Candidate A” and “Candidate B,” and each pair of candidates appeared on a separate screen. Each screen was shown for 20 seconds before participants were allowed to advance to the next task. Participants were asked to indicate which of the two candidates they would vote for in the election specified in the instructions.Footnote 3 Each candidate profile included a randomly assigned religious identity that had five levels. Three levels corresponded to nonreligious identities that were expected to differ in the amount of threat they were perceived to pose to religion: 1) “Does not currently identify with any religion,” 2) “Is not sure there is a God,” and 3) “Atheist.” Two additional levels represented control religious candidates (“Christian” and “Attends religious services weekly”). See Supplementary Material for additional information about how these choices were made. Other attributes in the design—party affiliation, experience in public office, policy expertise, education, age, gender, and race/ethnicity—are commonly found in candidate profiles. All attributes were fully randomized, and the order of their presentation was randomized across respondents but fixed for each respondent in order to minimize cognitive burdens. All attributes and their levels are available in the Supplementary Material. Since 1,274 respondents completed the experiment and each respondent either chose or did not choose each candidate profile, a total of 20,384 unique profiles are available for analysis based on the entire sample. A sample conjoint table can be found below Table 1.
A sample conjoint table

Table 1. Long description
The table compares eight attributes of two hypothetical political candidates, Candidate A and Candidate B. It has two columns for the candidates and nine rows for the attributes. Row 1: Religious identity, Candidate A: Atheist, Candidate B: Is not sure there is a God. Row 2: Gender, Candidate A: Female, Candidate B: Male. Row 3: Race/ethnicity, Candidate A: White, Candidate B: Asian. Row 4: Education, Candidate A: Some college, Candidate B: Graduate degree. Row 5: Age, Candidate A: 35, Candidate B: 71. Row 6: Experience in public office, Candidate A: No experience, Candidate B: 8 years. Row 7: Party affiliation, Candidate A: Democrat, Candidate B: Republican. Row 8: Policy expertise, Candidate A: Economic, Candidate B: Health care.
Please carefully review the two potential candidates running for the mayor of your town or city, detailed below, and then answer the question that follows.
If you had to choose between them, which of these candidates would you vote for to be the mayor of your town or city?
Candidate A Candidate B
Participants
Almost 51% of all participants identified as female, with the remaining 49% identifying as male. A majority (61.5%) identified as “Non-Hispanic White,” 11.9% as “Non-Hispanic Black,” 17.5% as “Hispanic,” and 9.2% as “All other.” A plurality of participants (35.5%) reported having a bachelor’s degree or higher, 26.4% some college or associate degree, 28.7% high school equivalent, and 9.4% less than high school. An “average” participant reported an income between $60,000 and $74,999. Nonreligious respondents—categorized as either atheists, agnostics, or nothing in particular—accounted for a total of 29.4% of all respondents, and the remaining 70.6% reported some kind of a conventional religious identity. As importantly, given the focus of this article on partisan differences, the percentages of Democrats and Republicans (43.1% and 38.3%, respectively) approximate their presence in nationally representative surveys more closely than nonprobability samples do (e.g., Levay et al., Reference Levay, Freese and Druckman2016).
Data analysis
The average marginal component effect, or AMCE, is a key statistic in the analysis of main effects based on data from conjoint experiments (Hainmueller et al., Reference Hainmueller, Hopkins and Yamamoto2014; Leeper et al., Reference Leeper, Hobolt and Tilley2020). In the experiment I describe in this article, the AMCE refers to the average change in the probability that a profile featuring a particular attribute will be chosen instead of the baseline attribute value while controlling for the effects of all other attributes manipulated in the experiment (Bansak et al., Reference Bansak, Hainmueller, Hopkins, Yamamoto, Druckman and Green2021; Hainmueller et al., Reference Hainmueller, Hopkins and Yamamoto2014). For the sample as a whole, I calculate the AMCE’s by estimating a series of linear regression models of vote choice as a function of the dummy variables coding for candidate nonreligion while controlling for all levels of all other attributes manipulated in the experiment, save for the excluded baselines. The dependent variable in each model is whether or not a profile featuring a particular nonreligion or religion was selected, coded as 0 (not selected) or 1 (selected). Each predictor in this and all other analyses is coded on a 0–1 scale. Therefore, one can straightforwardly compare the magnitude of the effect of each level of each attribute to any other in the design, with positive numbers capturing the percent advantage that candidates with a given trait enjoy relative to the excluded baseline and negative numbers capturing the percent disadvantage that candidates with a given trait suffer relative to the excluded baseline. To account for the dependence of observations, robust standard errors are used in all analyses.Footnote 4 I report weighted results throughout.Footnote 5
On the other hand, I calculate and report marginal means for subgroup differences I discuss in the article because “using conditional AMCEs to describe the degree of subgroup agreement can be misleading as regression interactions are sensitive to the reference category used in the analysis” (Leeper et al., Reference Leeper, Hobolt and Tilley2020, 207). Marginal means should be used to examine subgroup preferences (Leeper et al., Reference Leeper, Hobolt and Tilley2020). A higher marginal mean corresponds to a greater probability of choosing a profile with that attribute compared to a profile that does not feature it, whereas a lower marginal mean corresponds to a lower probability of choosing a profile with that attribute (Hoffmann and Velasco, Reference Hoffmann and Velasco2025).
Results
Candidate nonreligion and vote choice
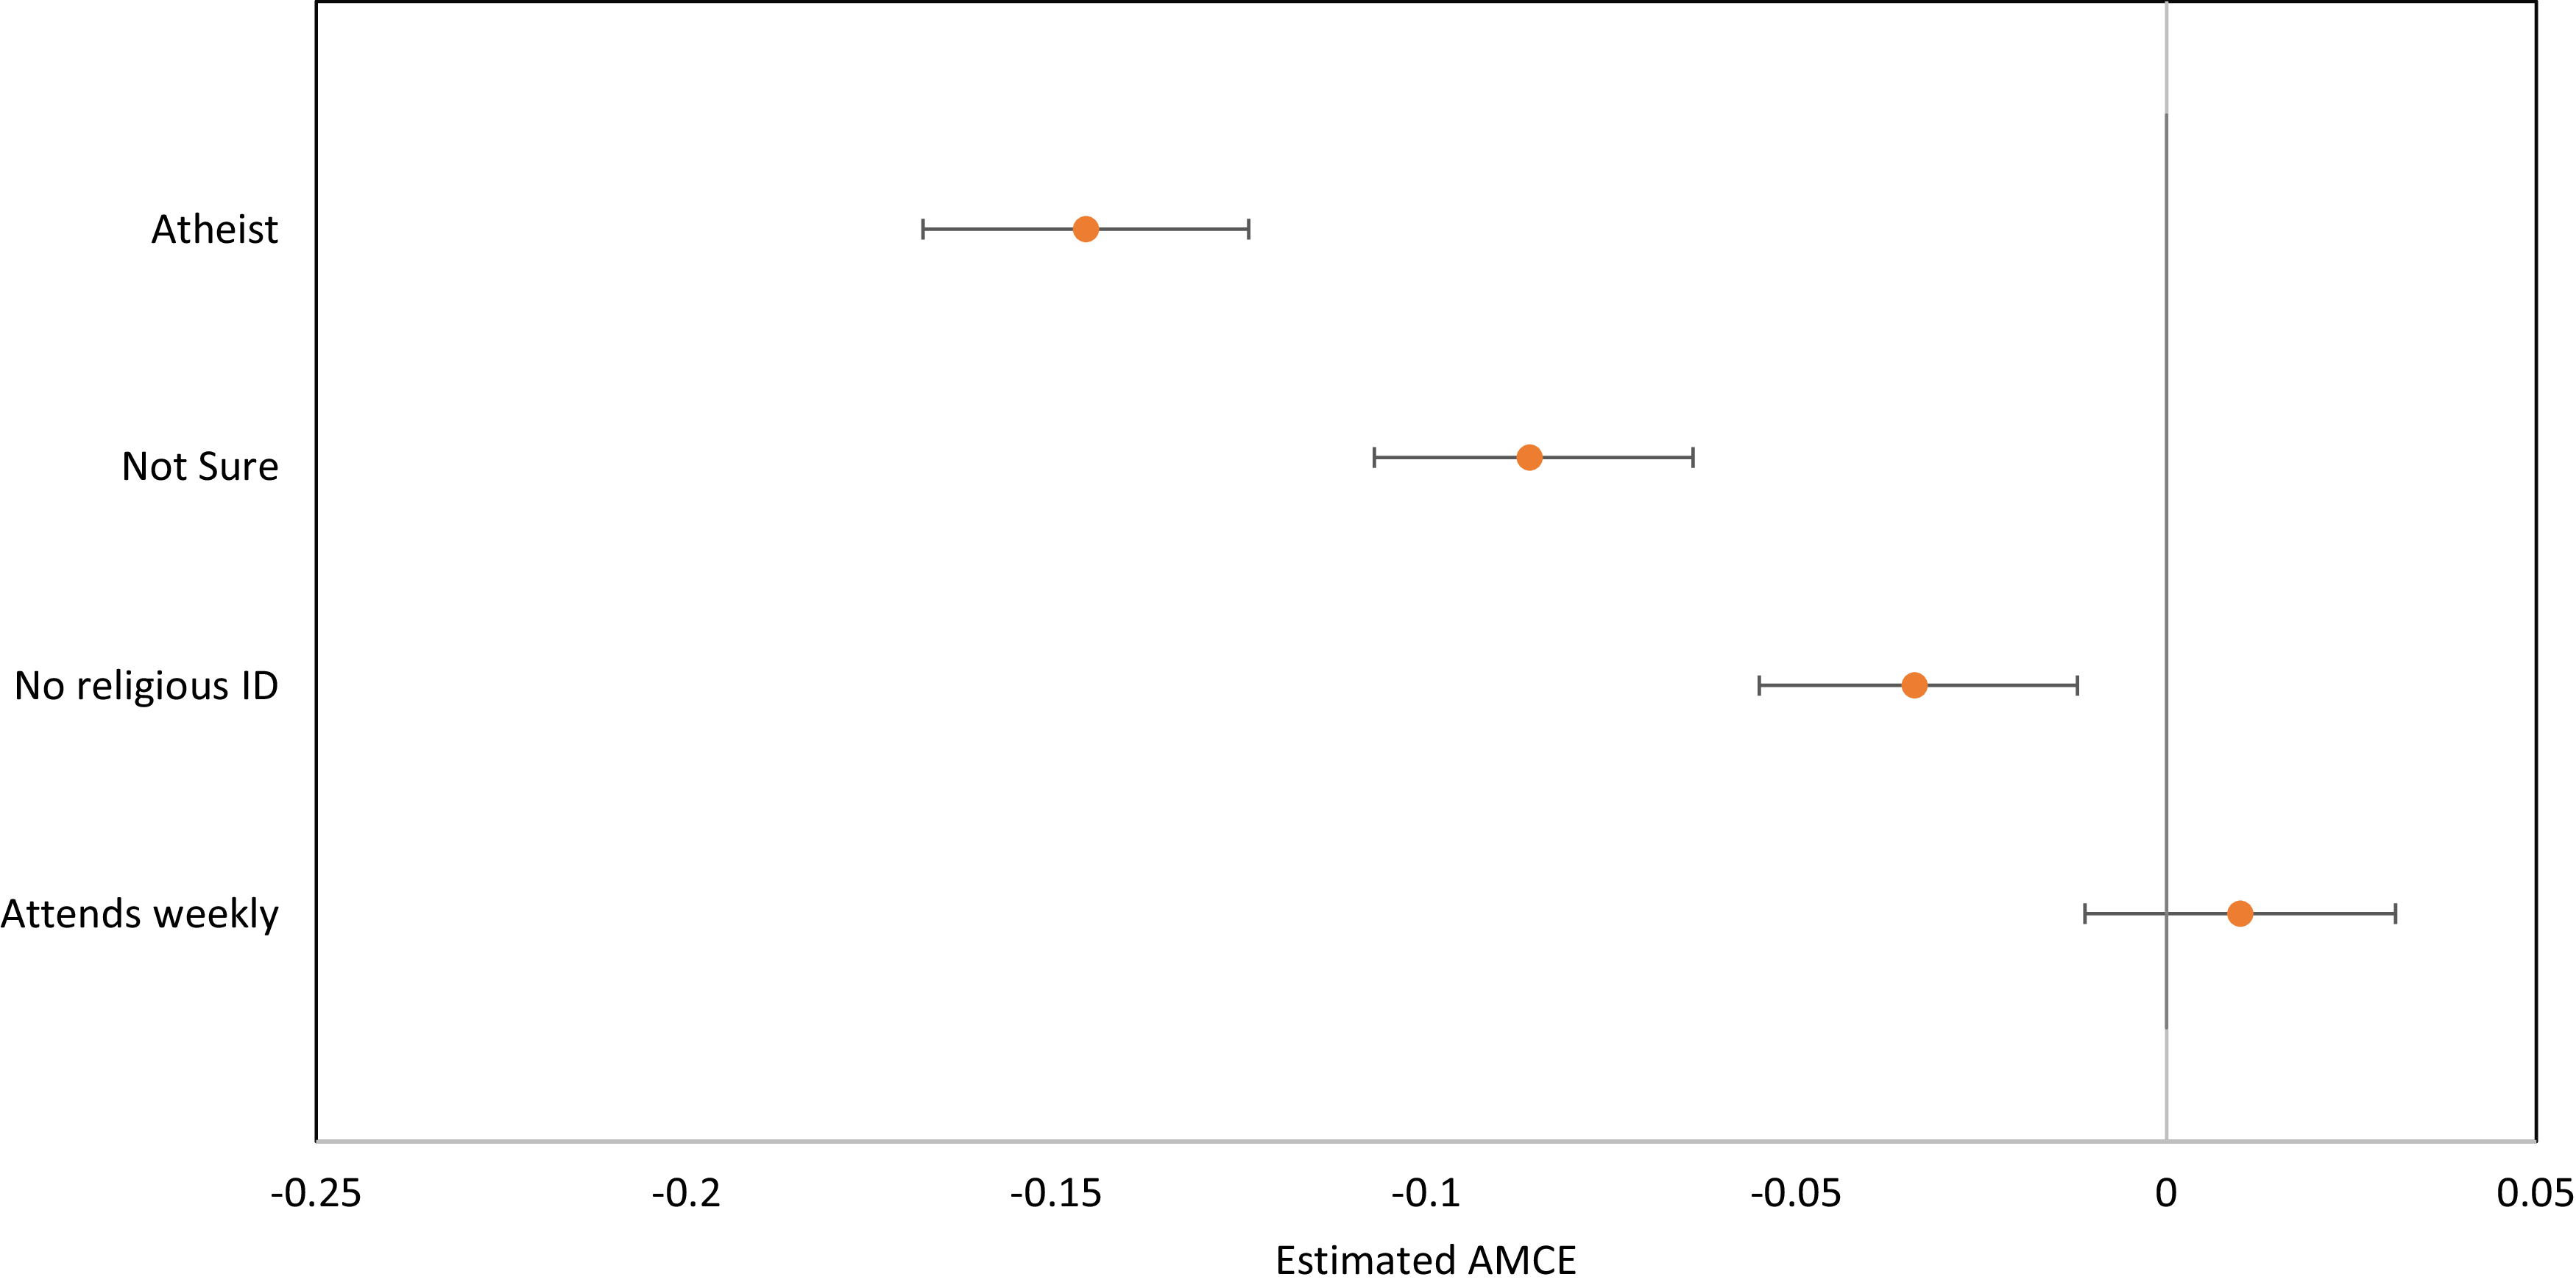
Figure 1 below shows changes in political support that each nonreligious candidate suffers compared to the excluded “Christian.” An AMCE for “attends religious services weekly” is included in the figure for comparison too. For the sake of simplification, the impact of other factors on candidate evaluation is summarized in the text, but the full results are available in the Supplementary Material.
Overall influence of candidate nonreligion on vote choice: Average Marginal Component Effects (AMCE’s). “Christian” baseline excluded.

Of most interest in this initial analysis are the overall impact of candidate nonreligion on vote choice and the importance of nonreligion compared to other attributes in the full model. I test the hypothesis that nonreligious candidates, relative to religious candidates, will suffer diminished political support (H1) by comparing the AMCEs (or b’s) of being an atheist, doubting God’s existence, or not identifying with any religion with those of being a Christian or attending religious services weekly.
In keeping with H1, all nonreligious candidates suffer a significant deficit in political support relative to their religious counterparts. As hypothesized, the size of the AMCEs (or b’s) associated with each attribute demonstrates that atheist candidates suffer the largest disadvantage (−15% to −16%), those who are not sure there is a God the second largest disadvantage (−9% to −10%), and candidates who do not currently identify with a religion the smallest (−3% to −4%).
The full results from this analysis allow a comparison of the magnitude of the influence of candidate nonreligion to other factors that may shape electoral choice. This comparison demonstrates that nonreligion—and especially whether or not a candidate is an atheist—is one of the most important influences on the likelihood that a particular candidate profile will be selected. Education and political experience also stand out for their predictive power, whereas gender, race or ethnicity, age, and area of policy expertise are relatively less influential. The likelihood of supporting a candidate goes up steadily with each level of her or his education and each increase in the amount of their previous political experience. Male candidates’ profiles receive significantly less support than female candidates’ profiles. White candidates receive significantly less support than black candidates whereas Asian candidates suffer significantly less support than white candidates. Respondents significantly favor 47-year-old candidates by a small margin over those who are 35. On the other hand, they penalize 71-year-old candidates. Finally, compared to candidates who specialize in foreign policy, respondents significantly prefer those who specialize in economic policy, health care policy, educational policy, and—by a smaller margin—environmental policy.
Candidate nonreligion, respondent partisanship, and vote choice
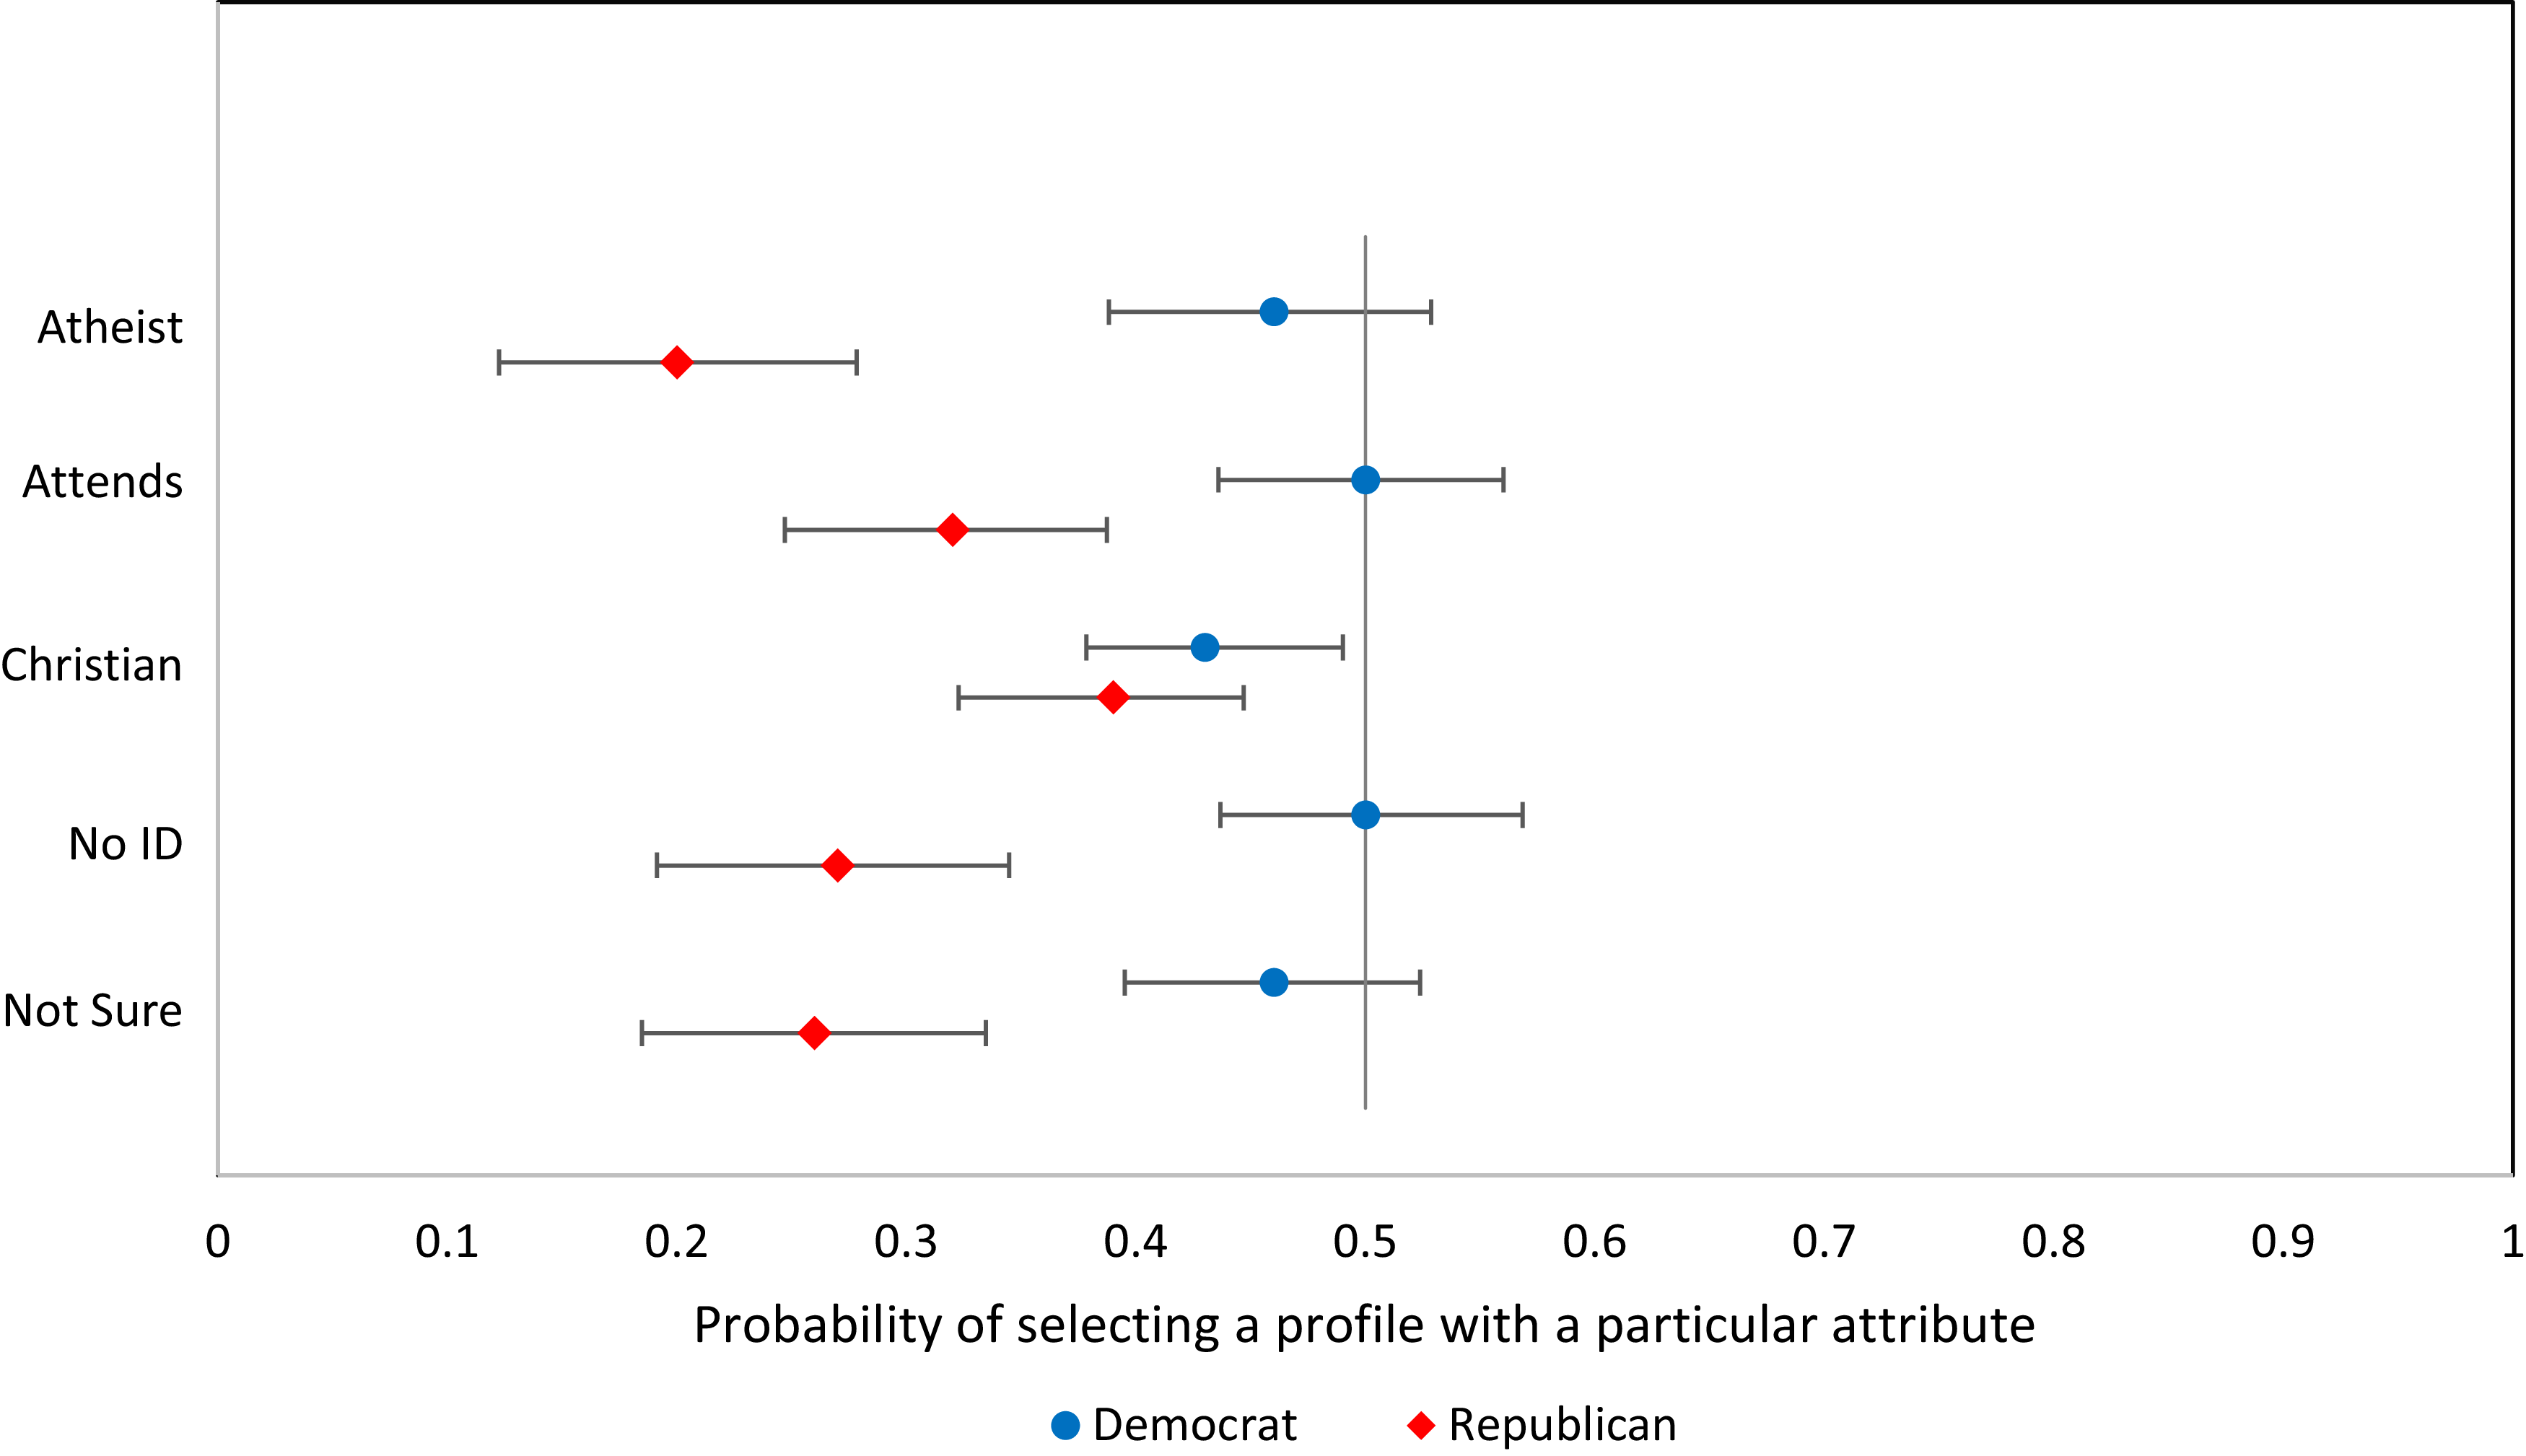
I next examine how the impact of candidate nonreligion on political appraisal is conditioned by the framing of candidate nonreligion and respondents’ partisanship (H2). To begin this analysis, I estimate a model of vote choice with interaction terms composed of dummy variables coding for candidate nonreligion and a two-category measure of respondent partisanship (Democrat v. Republican).Footnote 6 This model controls for all the manipulated attributes save for the excluded baselines and respondents’ education, age, gender, religiosity, income, and race or ethnicity. All the interaction terms between the framing of candidate nonreligion and respondents’ party identification achieve an acceptable level of statistical significance (p < .05 or less)—lending support to an expectation that the influence of candidate nonreligion on vote choice is moderated by respondents’ partisanship. I unpack the interactions by calculating marginal means for each nonreligion attribute for Democrats and Republicans, controlling for respondents’ education, age, gender, religiosity, income, and race or ethnicity as well as all the experimentally manipulated attributes—save for the excluded baselines. Measures of the demographic controls can be found in the Supplementary Material. Standard errors are clustered within respondent to account for the dependence of observations. The results are available in Figure 2 below. For comparison, the figure includes marginal means for “Christian” and “attends services weekly” too.
Candidate nonreligion, respondent partisanship, and vote choice. Marginal means and 95% confidence intervals. Standard errors are clustered within respondent.

In keeping with H2, pairwise comparisons of the conditional role of candidate nonreligion as a function of respondents’ party identification demonstrate that Republicans are significantly less likely than Democrats to choose profiles featuring atheist candidates (F = 27.47, p < .001), candidates described as unsure about God’s existence (F = 15.08, p < .001), and candidates who do not identify with a religion (F = 23.75, p < .001). Non-overlapping confidence intervals confirm that the partisan differences are statistically significant.
Comparing the influence of nonreligion within partisan groups, using pairwise comparisons, shows that Democrats are significantly less likely (by 5%) to choose profiles of candidates described as atheists or not sure there is a God (by 5%) compared to profiles that do not feature those attributes (p < .05 and p < .02, respectively). Democrats neither favor nor penalize profiles of candidates lacking a religious affiliation compared to those that list that attribute (p < .12). On the other hand, pairwise comparisons of the role of candidate nonreligion in Republicans’ choices demonstrate that Republicans are significantly less likely to choose an atheist (by 26%), an agnostic (by 14%), and a candidate who does not have a religious affiliation (by 13%) compared to profiles of candidates without those attributes (all significant at p < .001).
Candidate nonreligion and intraparty differences
Sorting out the influence of respondent partisanship and religiosity
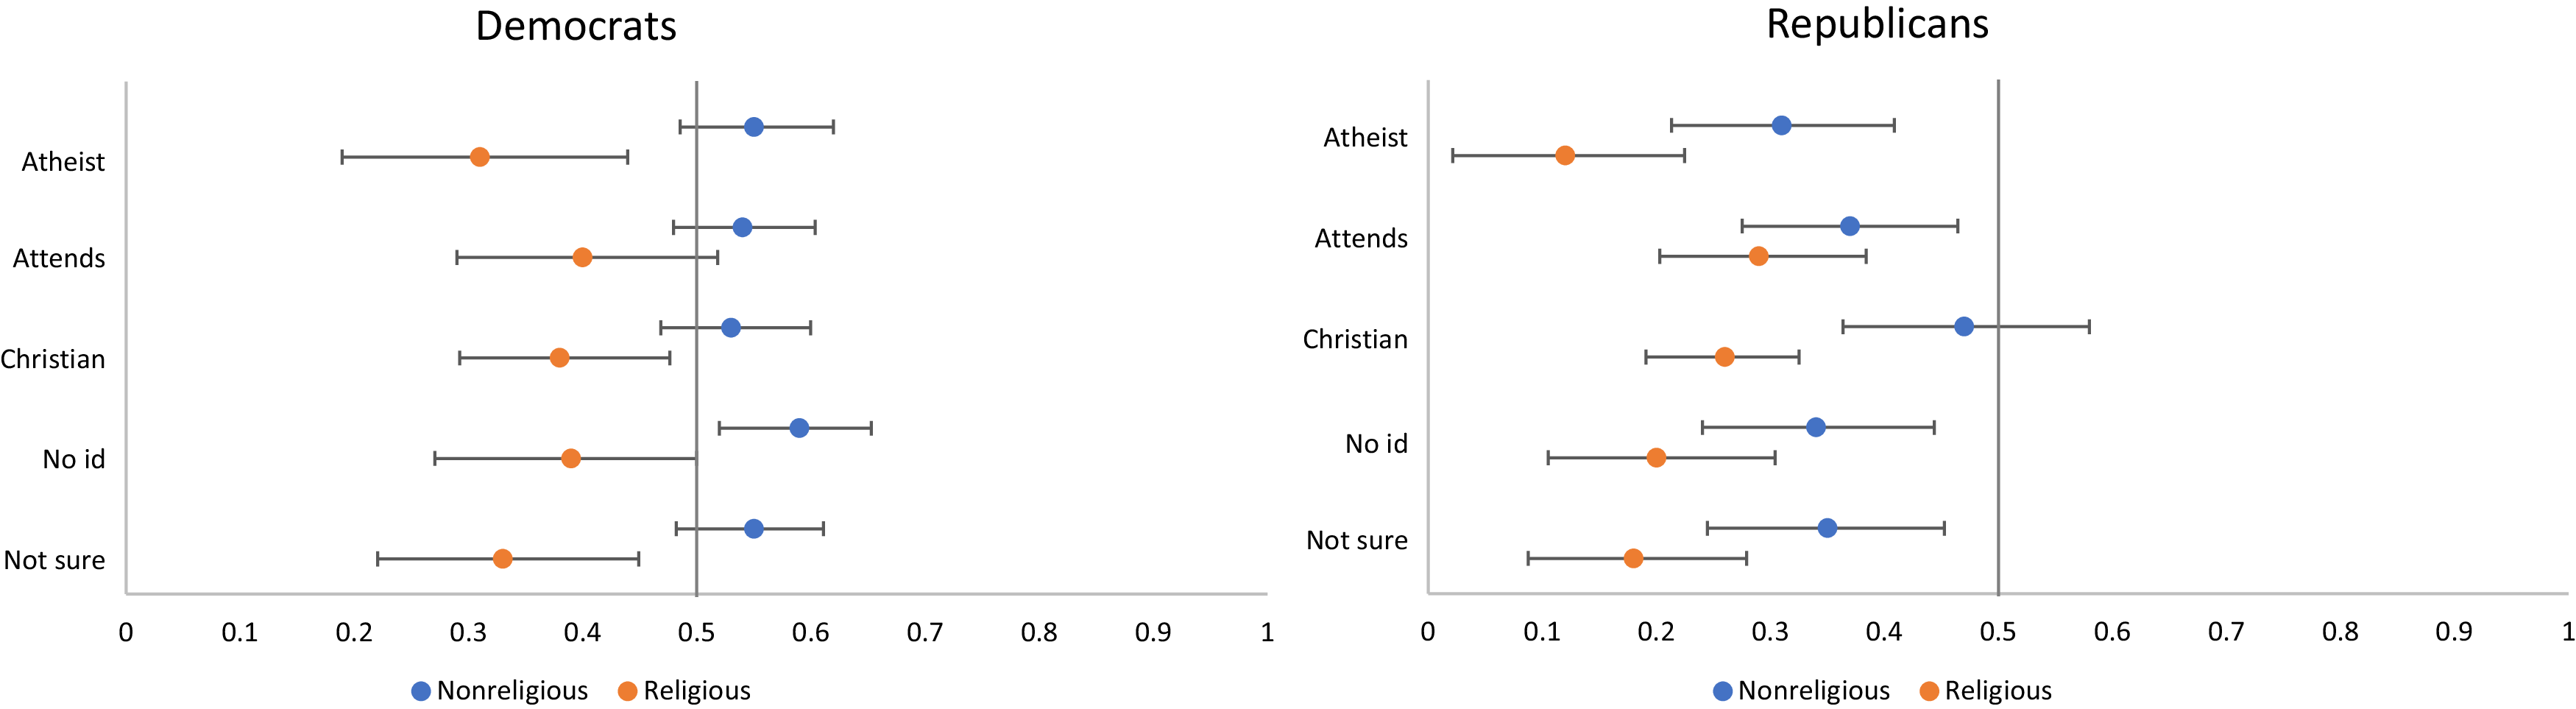
I have so far reported that the effects of candidate nonreligion are contingent on respondent partisanship while also showing that the role of nonreligion in vote choice further depends on how nonreligion is framed—for both Democrats and Republicans. I now seek to isolate the impact of respondents’ partisanship more precisely by examining how respondent religiosity influences openness to nonreligious candidates separately for Democrats and Republicans. To that end, I estimate a model of vote choice with three-way interaction terms composed of dummies coding for candidate nonreligion, a two-category measure of respondent partisanship (Democrat v. Republican), and a two-category measure of respondents’ religiosity (nonreligious v. religious).Footnote 7 All three interactions between candidate nonreligion and respondent partisanship and religiosity are highly significant (p < .001 in each case), lending support to an expectation that the impact of nonreligion depends on both partisanship and religiosity. Therefore, I separately examine openness to candidate nonreligion among nonreligious and religious Democrats and their Republican counterparts. The relevant marginal means can be found in Figure 3 below. For comparison, marginal means for “Christian” and “attends religious services weekly” are also included in this figure.
Candidate nonreligion, respondent partisanship and religiosity, and vote choice. Marginal means and 95% confidence intervals. Standard errors are clustered within respondent.

Figure 3. Long description
The image contains two side-by-side dot plots. The left plot is labeled ‘Democrats’ and the right plot is labeled ‘Republicans’. Each plot shows the marginal means and 95 percent confidence intervals for different categories of religious affiliation: Atheist, Attends, Christian, No id, and Not sure. The horizontal axis ranges from 0 to 1. The data points are color-coded: blue for Nonreligious and orange for Religious. In the Democrats plot, the blue dots (Nonreligious) are generally positioned to the right of the orange dots (Religious), indicating a higher share of nonreligious individuals in each category. In the Republicans plot, the orange dots (Religious) are generally positioned to the right of the blue dots (Nonreligious), indicating a higher share of religious individuals in each category. The error bars represent the 95 percent confidence intervals, showing the range of uncertainty around the marginal means.
In keeping with H3, the results summarized in Figure 3 make it clear that religiosity affects both Democrats’ and Republicans’ openness to nonreligious candidates because both nonreligious Democrats and Republicans—compared to their religious counterparts—are significantly more likely to select profiles of all nonreligious candidates (p < .001 in all comparisons). This conclusion is confirmed for Democrats by non-overlapping confidence intervals in Figure 3. The partially overlapping confidence intervals for Republicans suggest that the difference between religious and nonreligious Republicans’ likelihood of selecting those candidates may or may not be significant (Knezevic, Reference Knezevic2022). At a minimum, the difference in the nonreligious and religious Republicans’ openness to atheist candidates is likely significant because the confidence intervals are barely touching in that case.
At the same time, in support of H3, the marginal means in this figure demonstrate predictable differences in the degree of enthusiasm for nonreligious candidates across the partisan divide. Nonreligious Democrats selected profiles featuring any of the nonreligious candidates more than half the time compared to profiles not featuring any form of candidate nonreligion (means above .50), whereas their religious counterparts selected any of the nonreligious candidates’ profiles less than half the time (means below .50). In contrast, none of the Republican subgroups chose profiles of nonreligious candidates more than half the time.
Pairwise comparisons of the role of candidate nonreligion in nonreligious and religious Democrats’ choices demonstrate that the likelihood that they will choose nonreligious candidates’ profiles depends on how their nonreligion is framed. In support of H3, nonreligious Democrats are as likely to select profiles of atheist candidates and profiles of candidates who are not sure there is God as profiles omitting these attributes (p < .35 and p < .61, respectively) and are significantly more likely to select profiles of candidates who do not identify with a religion—by about 9% (p < .001). In contrast, religious Democrats are significantly less likely to select profiles of atheist candidates by about 17% (p < .001) and candidates who are not sure there is a God by about 13% (p < .001) compared to profiles that do not list either attribute. They are no more or less likely to choose profiles of candidates without a religious identification compared to those that do not list this attribute (p < .41).
Finally, pairwise comparisons of the role of candidate nonreligion in nonreligious and religious Republicans’ choices show some nuance in their selections as well. In line with H3, nonreligious Republicans are less likely to pick atheist profiles than profiles without the atheist attribute (by 16%, p < .001) and relatively more likely to pick profiles of candidates unsure whether there is God (penalizing them by 8%, p < .05) and candidates without a religious identification (penalizing them by 10%, p < .01) compared to profiles lacking those attributes. Pairwise comparisons of the role of candidate nonreligion in religious Republicans’ choices show that they are similarly less likely to choose profiles of all nonreligious candidates compared to profiles that do not include candidate nonreligion but by considerably larger margins (p < .001 in all three cases). However, in keeping with H3, even in this subgroup most disposed to react negatively to candidate nonreligion, atheist profiles are penalized most harshly (by 33%), whereas those of non-atheists less so (by 21% for candidates who are not sure there is a God and 16% for candidates lacking a religious identification).
What does the future hold? Generational differences in the impact of nonreligion among nonreligious and religious Democrats and Republicans
Having established that openness to nonreligious candidates is moderated by respondent partisanship and religiosity, I build on this analysis to investigate generational differences in nonreligious and religious Democrats’ and Republicans’ willingness to support nonreligious candidates. For this portion of my analysis, I recode respondents’ actual age (18–93) into a three-category variable. My objective in recoding age was to capture variation in the experiences that characterize different age groups while also retaining enough respondents in each subgroup to make this analysis possible. Since there is no obvious way to create age-based subgroups, I created a three-category age variable with about a third of all cases in each category. I refer to the category including respondents between 18 and 36 as “young,” between 37 and 57 as “middle-aged,” and between 58 and 93 as “old.” Please see endnote #vii for information about the coding of respondents’ religiosity. Next, I estimate a model of vote choice with interaction terms composed of dummies coding for candidate nonreligion, a two-category measure of respondent partisanship, a two-category measure of respondent religiosity, and a three-category measure of respondent age, controlling for all experimentally manipulated attributes and respondents’ education, age, gender, income, and race or ethnicity. All interaction terms are highly significant (p < .001 in each case), confirming that openness to nonreligious candidates is contingent on respondent partisanship, religiosity, and age. I thus separately examine Democrats’ and Republicans’ choices, broken down by their religiosity and age. The relevant marginal means can be found in Figures 4 and 5.
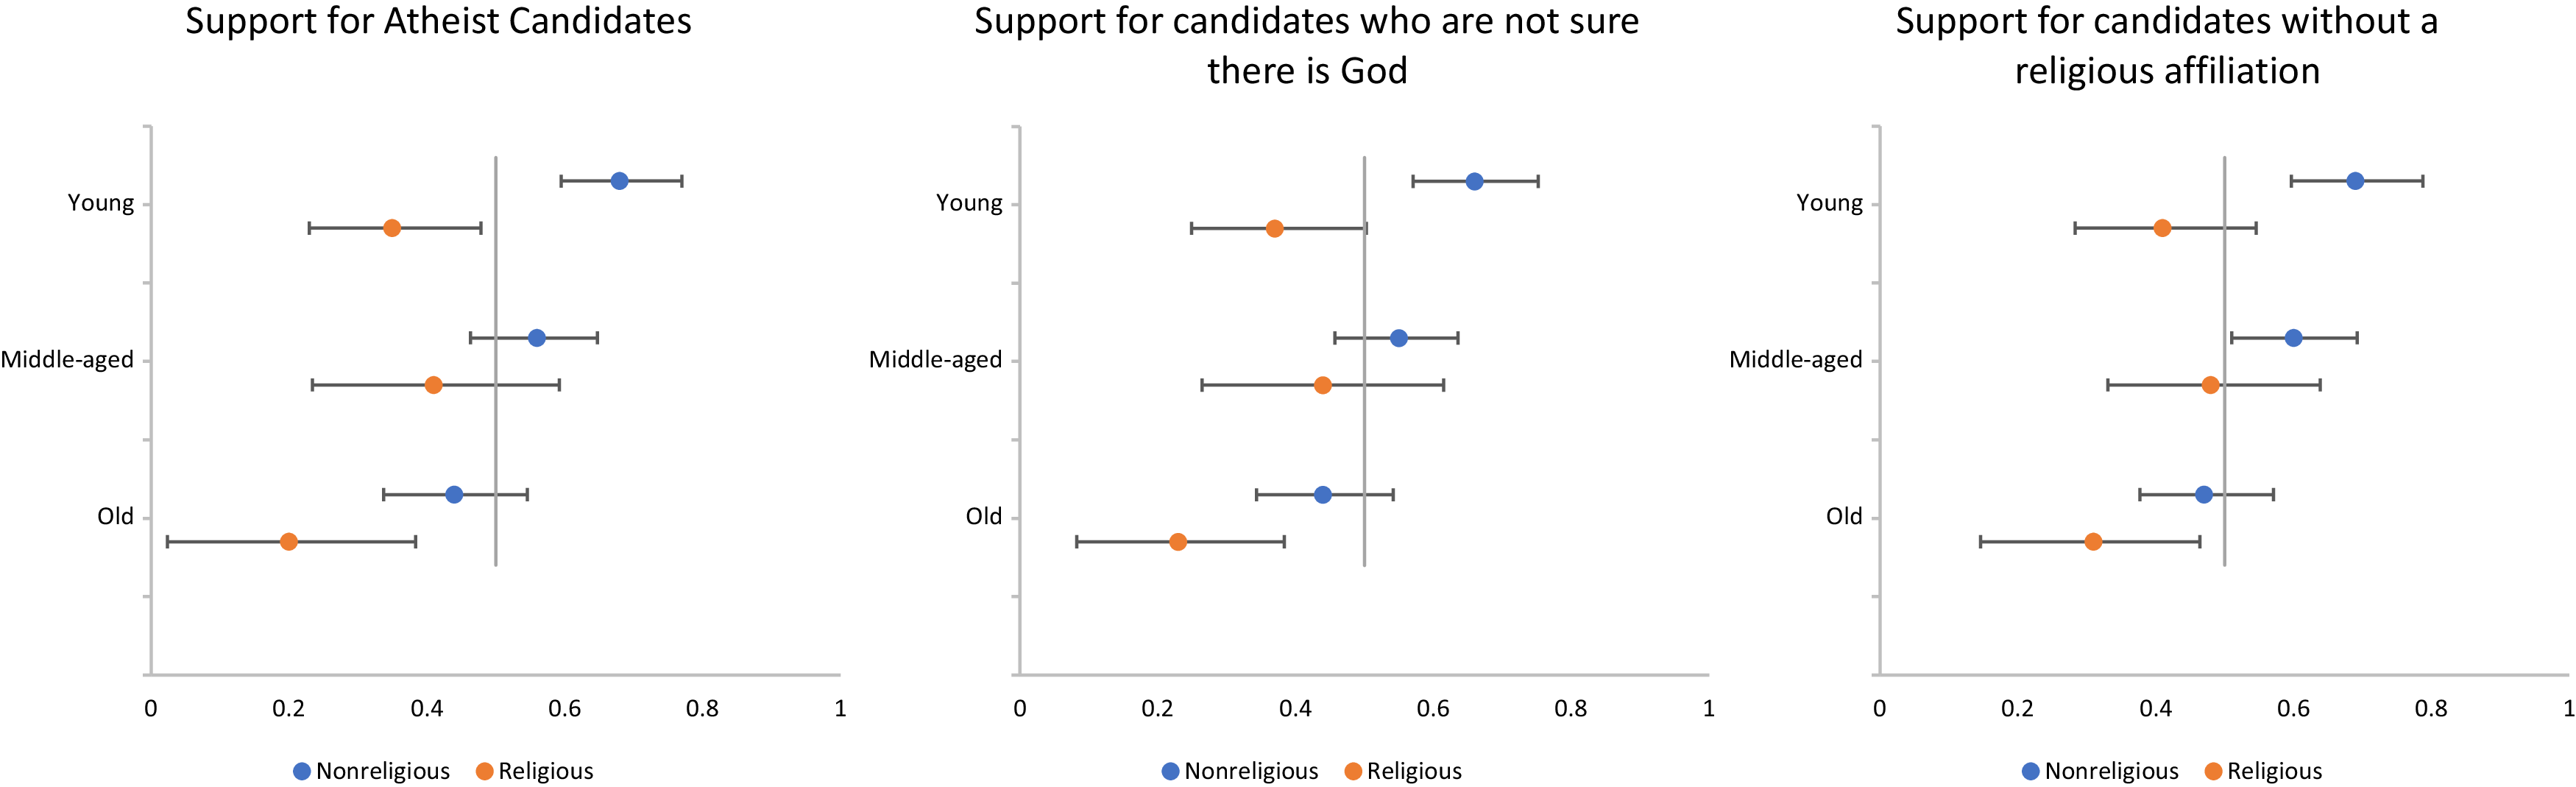
Candidate nonreligion, respondent religiosity, and age: Democrats’ choices. Marginal means and 95% confidence intervals. Standard errors are clustered within respondent.

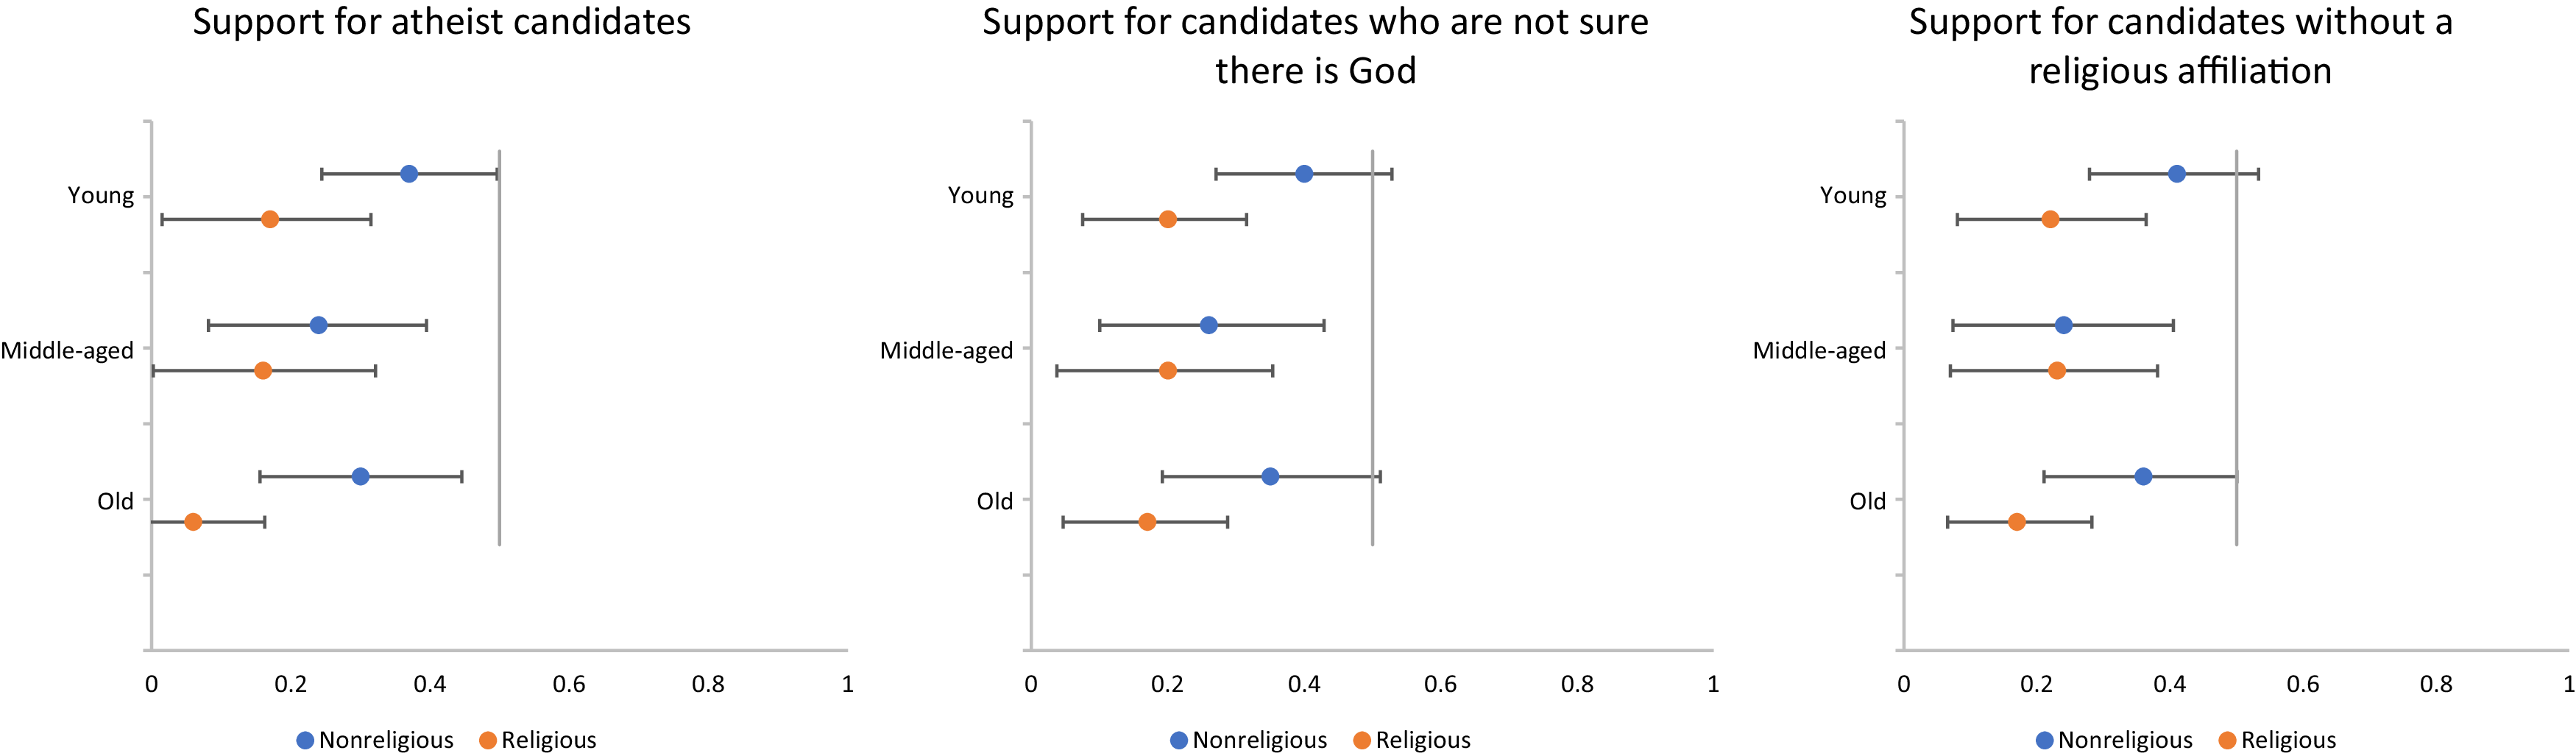
Candidate nonreligion, respondent religiosity, and age: Republicans’ choices. Marginal means and 95% confidence intervals. Standard errors are clustered within respondent.

Figure 5. Long description
The image contains three line graphs side by side, each depicting support for nonreligious candidates across different age groups. Panel A shows support for atheist candidates, Panel B shows support for candidates who are not sure there is God, and Panel C shows support for candidates without a religious affiliation. Each graph has three lines representing different age groups: Young, Middle-aged, and Old. The x-axis of each graph ranges from 0 to 1, indicating the level of support, while the y-axis lists the age groups. The lines are color-coded: blue for Nonreligious and orange for Religious. Each line includes error bars representing 95% confidence intervals. In all three panels, the support levels vary across age groups and religious affiliations, with noticeable differences in the confidence intervals.
Democrats’ choices
In support of H4, marginal means in Figure 4 show that Democrats’ age interacts with their religiosity in shaping their choices because old Democrats, especially when they are also religious, are especially unlikely to pick profiles of nonreligious candidates compared to their young and middle-aged counterparts.
Pairwise comparisons of the difference between nonreligious and religious Democrats’ choices show that young and old nonreligious Democrats are significantly more and middle-aged nonreligious Democrats are marginally more likely to choose profiles of atheist candidates and candidates who do not have a religious affiliation than their religious counterparts (p < .001 in the case of young and old nonreligious Democrats and p < .10 in the case of middle-aged and nonreligious Democrats). Religiosity does not affect middle-aged Democrats’ choices of profiles of candidates who are not sure there is God.
The non-overlapping confidence intervals for young Democrats who differ in their religiosity add further support to the conclusion that differences in their choices are significant. The overlapping confidence intervals for middle-aged and older Democrats complicate the interpretation of which differences are significant and which differences are not (Knezevic, Reference Knezevic2022). Given the amount of the overlap and the previously discussed pairwise comparisons, religiosity may not play a significant role in middle-aged Democrats’ choices but likely plays a significant role in old Democrats’ choices.
In line with H4, the framing of candidate nonreligion together with Democrats’ religiosity and age plays a role in their choices as well. Pairwise comparisons of the role of candidate nonreligion in younger and nonreligious Democrats’ choices show that they are more likely to select profiles of all types of nonreligious candidates than profiles not including candidate nonreligion (atheists by 13%, candidates not sure there is a God by 9%, and candidates without a religious identification by 15%; all at p < .01 or lower). Middle-aged and nonreligious Democrats are also more likely to select profiles of candidates who are described as lacking a religious affiliation (by 12%, p < .003) but are equally likely to select profiles of atheist and agnostic candidates compared to those that do not mention either attribute (p < .55 for atheist candidates and p < .87 for candidates who are not sure there is a God). Finally, older and nonreligious Democrats are equally likely to choose profiles of all nonreligious candidates compared to those that do not feature candidate nonreligion (atheist candidates, p < .23; agnostic candidates, p < .22; and candidates without a religious affiliation, p < .82).
Regardless of their age, marginal means in Figure 4 show that religious Democrats choose all nonreligious candidates’ profiles less than half the time—albeit old and religious Democrats are especially unlikely to choose them. Pairwise comparisons of the role of candidate nonreligion in young, middle-aged, and old religious Democrats’ choices show that young and religious Democrats significantly prefer non-atheist to atheist candidates (by 14%, p < .01) and marginally favor candidates who are not described as doubting God’s existence over those without that attribute (by 10%, p < .06). On the other hand, young and religious Democrats are as likely to select profiles of candidates without a religious affiliation as profiles without that attribute (p < .74). In contrast, middle-aged and religious Democrats do not favor or penalize nonreligious candidates’ profiles compared to those that do not include candidate nonreligion (atheist candidates, p < .14; candidates who are not sure there is a God, p < .43; candidates without a religious identification, p < .47). Finally, old and religious Democrats significantly prefer profiles of non-atheist candidates and those who are not sure there is God (by 27% and 21%, respectively, p < .001 in both cases). Yet, they are equally likely to select profiles of candidates without a religious affiliation and those of candidates without that attribute (p < .22).
Republicans’ choices
Marginal means in Figure 5 below summarize Republicans’ choices as a function of their age group and religiosity.
Regardless of their age, Republicans select profiles of nonreligious candidates less than half the time compared to profiles that do not include candidate nonreligion—although nonreligious Republicans are almost always more likely to select them than their religious counterparts. That said, in line with H4, the framing of candidate nonreligion as well as their own religiosity and age play a role in Republicans’ choices as well. For example, marginal means in Figure 5 demonstrate that young nonreligious Republicans are far more likely to select profiles of atheist candidates than their old religious counterparts.
Pairwise comparisons of the difference between young and old Republicans’ choices who differ in their religiosity show that nonreligious young and old Republicans are significantly less likely to choose profiles of atheist candidates and candidates who do not have a religious affiliation than their religious counterparts (p < .01 or less in all comparisons). Religiosity does not play a significant role in middle-aged Republicans’ choices.
Confidence intervals in Figure 5 add nuance to this interpretation. The slightly overlapping confidence intervals for young Republicans lend support to an interpretation that their own religiosity is likely significantly linked with their selection of all three types of nonreligious candidates. The substantially overlapping confidence intervals for middle-aged Republicans confirm an interpretation that their religiosity does not affect their choices. The partially overlapping confidence intervals for marginal means for old Republicans lend support to an interpretation that the difference in old nonreligious and religious Republicans’ likelihood of selecting profiles of any nonreligious candidates is likely significant.
The framing of candidate nonreligion and Republicans’ religiosity and age play roles in their choices as well. Pairwise comparisons of the role of candidate nonreligion in younger and nonreligious Republicans’ choices show that they are significantly less likely to choose atheist than non-atheist candidates (by 11%, p < .02) but are as likely to choose other kinds of nonreligious candidates as profiles that do not feature candidate nonreligion (candidates who are not sure there is God, p < .37; candidates who do not have a religious affiliation, p < .48). Middle-aged and nonreligious Republicans significantly favor candidates without a nonreligious attribute compared to those who are atheists, are not sure there is God, or do not identify with a religion (by 19% compared to atheists, by 13% compared to agnostic candidates, and by 19% compared to candidates without a religious affiliation; p < .05 or less in all three cases). Finally, old and nonreligious Republicans favor profiles of non-atheist candidates compared to those who are described as atheists (by 18%, p < .003) but are equally likely to select profiles of candidates who are not sure there is God or do not identify with a religion (p < .32 and p < .26, respectively).
Finally, even though religious Republicans choose nonreligious candidates’ profiles at most a quarter of the time, even their choices are to some extent conditioned by their age group—especially when the candidates are described as atheists. Specifically, pairwise comparisons of the role of candidate nonreligion in religious Republicans’ choices show that they are significantly less likely to choose all nonreligious candidates compared to candidates lacking a nonreligious attribute within all three age groups (p < .01 or less). Religious Republicans penalize atheist candidates by 28% among young respondents, 29% among middle-aged respondents, and 40% among old respondents. Agnostic candidates are penalized by 22% among both young and middle-aged religious Republicans and candidates without a religious affiliation by 19%. Candidates without a religious affiliation suffer a somewhat smaller though still large penalty (17% among young religious Republicans, 16% among middle-aged religious Republicans, and 17% among old religious Republicans).
Summary and discussion
Using data from a nationally representative conjoint experiment, I have demonstrated that nonreligion is even more potentially politically consequential than suggested in recent studies, though the magnitude of its impact is also contingent on how it is framed as well as respondents’ partisanship, religiosity, and age. An atheist label is generally the most politically damaging manner of conveying candidate secularity, whereas candidates who are not sure there is a God or especially those who lack any religious affiliation tend to be less politically radioactive. At the same time, both Democrats and Republicans discriminate against atheist and agnostic candidates, although Republicans’ aversion—especially when candidates are identified as atheists—is much greater than Democrats’. While Republicans are also less likely to support candidates lacking any religious affiliation, Democrats neither favor nor penalize them compared to candidates who are not described with this attribute. My findings also address the question of how important candidate nonreligion is compared to other factors that shape electoral choice. Overall, nonreligion is one of the more important factors in respondents’ choices.
Further adding to existing scholarship, I show that nonreligious Democrats do not discriminate against atheists and candidates who are not sure there is God and favor profiles of candidates without a religious affiliation compared to those without that attribute. In contrast, religious Democrats discriminate against atheist and agnostic candidates but do not discriminate against candidates lacking a religious identification compared to candidates lacking that attribute. While all Republicans discriminate against all nonreligious candidates, nonreligious Republicans are less likely to discriminate against non-atheist candidates compared to candidates described as atheists. As expected, religious Republicans discriminate against all nonreligious candidates by much larger margins, but even they are less likely to penalize non-atheist than atheist candidates compared to candidates without those attributes.
I also identify generational differences in Democrats’ and Republicans’ openness to nonreligious candidates that further depend on respondent religiosity. I find that younger nonreligious Democrats tend to favor nonreligious candidates compared to candidates without those attributes, whereas middle-aged and older nonreligious Democrats tend not to discriminate in favor of or against candidates’ nonreligion. Although religious Democrats tend to discriminate against atheist and agnostic candidates, younger religious Democrats do so by considerably smaller margins. Middle-aged and older religious Democrats do not discriminate against candidates lacking a religious identification, although older religious Democrats discriminate against both atheists and agnostics.
Finally, nonreligious younger and older Republicans tend not to discriminate against nonreligious candidates compared to those lacking a nonreligion attribute—with the exception that both subgroups discriminate against atheists. On the other hand, middle-aged nonreligious Republicans discriminate against all types of nonreligious candidates compared to those without a nonreligion attribute. While religious Republicans discriminate against all nonreligious candidates within all age groups, younger and middle-aged religious Republicans are less likely to discriminate against atheist candidates compared to those without an atheist attribute. In short, while resistance to electing nonreligious candidates is high among all religious Republicans, atheists draw the most opposition, especially among older religious Republicans, with candidates doubting there is a God or lacking a religious affiliation generating relatively less hostility.Footnote 8
The findings I report in this article are partially inconsistent with recent scholarship on the impact of nonreligion on political support. For one thing, the size of the effect of nonreligion on candidate appraisal is bigger than in recent research. Counter to research suggesting that nonreligious candidates suffer no penalty among Democratic respondents (Golebiowska, Reference Golebiowska2024) or that atheism specifically may be a positive electoral cue for Democrats (Campbell et al., Reference Campbell, Layman and Marsh2024), I show that both Democrats and Republicans discriminate against atheists and agnostics—even though Republicans do so by much larger margins. Therefore, it appears that sample parameters do make a difference when it comes to extrapolating to the general population even if nonprobability samples on which previous research has relied almost exclusively are appropriate for capturing causal effects. Given that the proportions of Democrats and Republicans in my sample approximate their presence in the general population more faithfully than nonprobability samples do, it appears that nonprobability samples likely underestimate the amount of hostility toward nonreligious candidates because they typically oversample Democrats (Levay et al., Reference Levay, Freese and Druckman2016).
At first blush, my findings appear to have negative implications for nonreligious candidates’ access to elective office. On a more granular level, they suggest that the negative impact of nonreligion can be expected to diminish as the secular population continues to grow and nonreligious candidates for office become more of a norm than an exception—especially if these candidates stay away from the atheist label. Nonreligion might even become an electoral asset instead of a liability, as it already appears to be for nonreligious younger Democrats. That said, the pace of this evolution or its form can be expected to proceed along very different paths among Democrats and Republicans and in different constituencies otherwise inclined to support one or the other party. This suggests that candidates for office will need to be attuned to these differences and make careful decisions about how to communicate their nonreligious identities and worldviews to potential supporters.
For example, based on the evidence I summarize in this article, nonreligious candidates can expect a tougher road to elective office even when running on the Democratic ticket if they wage campaigns in constituencies with larger percentages of religious voters (e.g., African Americans) or are simply campaigning for support in the older and more religious pockets of their party. Given Republicans’ aversion to nonreligious candidates as well as the “view embraced by many conservatives that American democracy must be grounded in a Christian worldview—or returned to a place of godliness,” acceptance of secular candidates is highly unlikely to become the norm in the Republican party in the foreseeable future (Dias and Lerer, Reference Dias and Lerer2024). Yet, with generational replacement, nonreligious Republicans—especially if they reject the atheist label—may at some point launch viable electoral campaigns in relatively less religious constituencies.
In short, that less religious and younger voters, even among Republicans, are less biased against nonreligious candidates are crucial findings that paint a picture of a future where both Democrats and Republicans are willing to elect nonreligious legislators. As a result, descriptive representation of nonreligious Americans is likely to improve, with its salutary implications for a sense of belonging of nonreligious Americans, role models for other candidates for office, and possible implications for substantive representation for nonreligious Americans as well.
Supplementary material
The supplementary material for this article can be found at https://doi.org/10.1017/S1755048326100522.
Data availability statement
Data and study materials are available here: https://tessexperiments.org/study/golebiowska1700 Syntax used to generate the results reported in this article is available from the author.
Acknowledgements
Many thanks to the TESS team, and especially James Druckman, for their support for the project and to Sajjad Ahamed for his help with the figures.
Financial support
This research was funded by the Time-Sharing Experiments for the Social Sciences (TESS) (https://tessexperiments.org/).
Competing interests
None.
Ewa Golebiowska, PhD, is professor in the Department of Political Science at Wayne State University in Detroit, MI. Her research focuses on public opinion and political behavior.


 Open access

