I. INTRODUCTION
X-ray powder diffraction (XRPD) is a widely used method used for phase identification and quantitative analysis. Significant progress in powder methods occurred in the 1970s after Hugo Rietveld introduced a powerful technique for refining crystal structures from powder data in 1967 (Rietveld, Reference Rietveld1967).
How to acquire good-quality powder diffraction data and how to refine using appropriate strategies have been stressed by many experts in order to extract good-quality structural data (Hill, Reference Hill1992; Young, Reference Young1993; Hill and Cranswick, Reference Hill and Cranswick1994; McCusker et al., Reference McCusker, Von Dreele, Cox, Louër and Scardi1999; Toby, Reference Toby2006; Kaduk, Reference Kaduk2009). Experienced users of the Rietveld method are probably familiar with most requirements for obtaining good-quality structural data. However, novices will benefit from repetition of some key points, which are reviewed here using some examples. We report here Rietveld refinements of calcite – a well-known structure that has been successfully refined many times (Markgraf and Reeder, Reference Markgraf and Reeder1985; Antao et al., 2009; Ballirano, Reference Ballirano2011). Calcite exhibits rhombohedral cleavage and its powder commonly has a preferred orientation when loaded into a flat-plate sample holder. When the preferred orientation is unavoidable, using a proper model is an important but not difficult matter, as the expected results are known. We can thus test the impact of different preferred orientation models on structural parameters. Herein, we show how one treats preferred orientation and how one chooses the appropriate refinement strategies.
II. SAMPLES AND MEASUREMENT
A. Samples
Two calcite samples were used: one was from Mishan, Heilongjiang Province, China (Mishan, containing small amounts of impurities), and the other was from Rock-Mineral Preparation and Analysis Lab at the Institute of Geology and Geophysics, Chinese Academy of Sciences(IGGCAS). The second sample is labeled as Occ (Single phase).
B. Acquisition of XRPD patterns
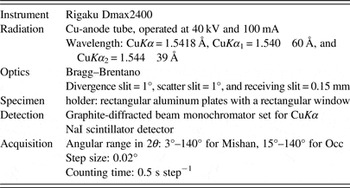
Each sample was uniformly ground using a mortar and pestle and passed through a 200-mesh sieve. Step-scanned patterns were acquired using a Rigaku D/max–2400 Bragg–Brentano diffractometer fitted with a graphite diffracted-beam monochromator (Rigaku Corporation, Japan). Given that calcite tends to orient strongly, the samples were prepared by the backloading method to reduce the effects of the preferred orientation. Details are presented in Table I. The Mishan sample contains few impurities (clinochlore and quartz); therefore, a quantitative phase analysis was performed on several coexisting phases during structural refinements.
XRD pattern measurement conditions.

III. THE RIETVELD REFINEMENT
The Rietveld method, which was initially proposed by Rietveld (Reference Rietveld1967, Reference Rietveld1969), has been significantly improved during the past two decades and has become an effective, reliable tool for the structural refinements.
The free online computer program package General Structure Analysis System (GSAS) (Larson and Von Dreele, Reference Larson and Von Dreele2000) and a graphical interface for the GSAS package (EXPGUI) (Toby, Reference Toby2001) were used for the structural refinements. The quality of agreement between the experimental and calculated profiles obtained from the programs was verified using the LaB6 standard (SRM 660b, National Institute of Standards and Technology) XRPD pattern. The instrumental parameter file was obtained from the profile terms from the LaB6 fit. The initial atomic coordinates, cell parameters, isotropic temperature factors (which were recast using the formula U iso = B iso/8π 2 for comparison to older literature values), and space group for calcite, clinochlore, and quartz were obtained from Markgraf and Reeder (Reference Markgraf and Reeder1985), Walker and Bish (Reference Walker and Bish1992), and Lager et al. (Reference Lager, Jorgensen and Rotella1982), respectively.
A. Occ refinement
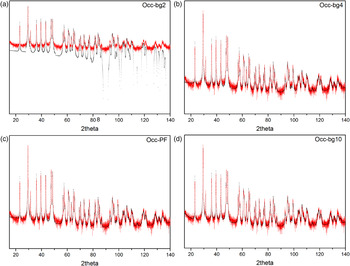
A full-matrix, least-squares refinement was carried out using the following process for adding parameters. First, the scale factor was refined, and then the background was modeled using a two-term shifted Chebyshev polynomial [Figure 1(a)]. The initial refinement yielded the residuals R wp = 49.3 and χ 2 = 20.7. It was obvious from looking at a plot of the observed and computed patterns that the background needed more terms to further improve the fit. The residuals dropped to R wp = 26.1 and χ 2 = 5.81 after the background was modeled using a four-term Chebyshev polynomial [Figure 1(b)].
(Color online) Rietveld fit of Occ when a two terms Chebyshev polynomial, a four terms Chebyshev polynomial, profile and cell parameters and a ten terms Chebyshev polynomial were added to the refinement, respectively, and the corresponding plots are Figures 1(a)–1(d) (the log vertical scale was chosen for clarity). The red curve is observed diffraction pattern (line), and the black is calculated (crosses).

From Figure 1(b), we can see that the differences between the observed and calculated patterns are very obvious, and this is mainly caused by the preferred orientation. The third CW profile function was used to describe the diffraction peaks. The diffractometer zero was verified to be close to zero in the refinement from the standard and in any case should not be refined under normal circumstances with Bragg–Brentano datasets. Instead, only the specimen displacement coefficient (shft in GSAS) was refined. Next, based on these values in the instrument file, the U, V, and W (Cagliotti) terms were modified separately, and they were fixed in the following cycles. Note that in this example, these instrumental terms were not determined from a standard. If they had been, a better procedure would be to leave these values fixed and only refine the crystallite size broadening term, P. Additionally, the profile coefficient Y, which describes the microstrain broadening, was also added. Refinement of these ten variables yielded the residuals R wp = 25.7 and χ 2 = 5.65. The R factors show that the improvements are not large. Then, the cell parameters were added to the refinement in the following step, and the fit plot [Figure 1(c)] showed that the description of the background needed improvement. Therefore, additional Chebyshev polynomial terms were added one-by-one, until no significant additional improvement was seen, when ten terms were introduced. Then, the fit of background further improves [Figure 1(d)], and the residuals for refinement of 18 variables dropped considerably: R wp = 23.6 and χ 2 = 4.75.
These data clearly exhibit strong preferred orientation, so these refinements provide a good test case to illustrate how treatments for this affects the accuracy of the structural data through comparison of four different refinement strategies.
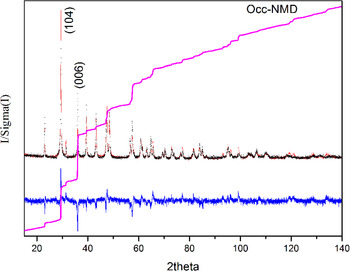
In the first approach, no treatments for the preferred orientation were added prior to inclusion of the structural parameters (this model including no March-Dollase function is labeled NMD). Addition of the positional and isotropic temperature parameters to the refinement resulted in residuals dropping to: R wp = 21.9 and χ 2 = 4.11 (Figure 2).
(Color online) Rietveld fit of Occ–NMD: the red curve is observed diffraction pattern (line), and the black is calculated (crosses); vertical marks indicate the positions of allowed Kα 1 and Kα 2 reflections; the blue curve at the bottom shows the difference between observed and calculated patterns (line); the pink curve is cumulative χ 2 (line).

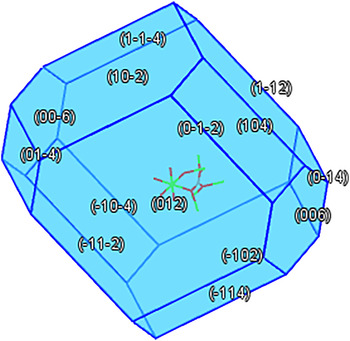
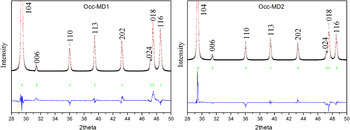
In the second method, the preferred orientation was modeled by the March–Dollase (MD) function. Based on the trial-and-error method, the preferred orientation can be easily recognized on powder diffraction photographs if one type of the preferred orientation is present. However, if more than one type of the preferred orientation is present, this approach is almost useless. By calculating the Bravais–Friedel–Donnay–Harker crystal morphology (Bravais, Reference Bravais1866; Friedel, Reference Friedel1907; Donnay and Harker, Reference Donnay and Harker1937), we know the growth direction of calcite is complex (Figure 3), and the texture is also complex for natural calcite (Wenk and Houtte, Reference Wenk and Houtte2004). Figure 2 shows the cumulative χ 2, which can be expected to rise with a constant slope of unity, but with a much more steep increase in regions of the pattern that are poorly fit. The cumulative χ 2 for the NMD refinement shows a large mismatch for the 104 diffraction peak, and 104 is also one of the growth directions of the calcite crystal; therefore the 104 direction was chosen as the preferred orientation axis in a refinement labeled as MD1. This resulted in greatly improved residuals, R wp = 15.5 and χ 2 = 2.04. However, the natural calcite rocks often exhibit a strong preferred orientation along the c-axis (Wenk and Houtte, Reference Wenk and Houtte2004), which is not inconsistent with 006 as one of the growth directions of the calcite crystal (Figure 3), and this can be noted from the large mismatch in the cumulative χ 2 for the 006 diffraction peak in Figure 2. Therefore, a refinement with 001 instead of 104 MD preferential orientation direction was performed as MD2 obtaining residuals, R wp = 17.4 and χ 2 = 2.58.
(Color online) Bravais–Friedel–Donnay–Harker crystal morphology of calcite.

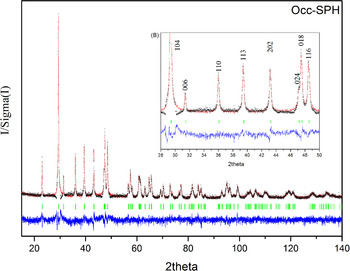
Several researchers (Sitepu, Reference Sitepu2002; Sitepu et al., 2005; Balic-Zunic et al., Reference Balic-Zunic, Katerinopoulou and Edsberg2011) have shown that the spherical harmonics function (SPH) is superior to the MD function in terms of modeling the preferred orientation effects. Therefore, SPH was used to correct the peak intensities, and two harmonic orders were chosen at the beginning. The harmonic orders were gradually increased until the R factors did not further decrease. Last, ten harmonic orders were chosen, and this is consistent with the report of Sitepu et al. (Reference Sitepu, O'Connor and Li2005). Compared with the residuals of MD1 and MD2, the residuals dropped to R wp = 13.5 and χ 2 = 1.56.
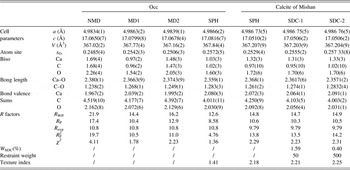
The position and isotropic temperature parameters were varied after the preferred orientations treatments were incorporated for the MD1, MD2, and SPH models. The details of the refined crystal structural parameters obtained from different refinement strategies are given in Table II.
Details of the refined crystal structure parameters of two calcite samples.

Note: 1. NMD denotes a model without preferred orientation treatments. MD1 denotes that only the preferred parameters along the 104 direction are refined through the March–Dollase model. MD2 denotes that the preferred parameters along the 001 axe are both refined through the MD model. SPH denotes that the SPH is introduced into the structural model to treat the preferred orientation. SDC-1 denotes that the restraint weight is set as 50 for the C–O bond length restraint and SDC-2 denotes that the restraint weight is 500.
2. Standard uncertainties are given in parentheses.
B. Mishan refinement
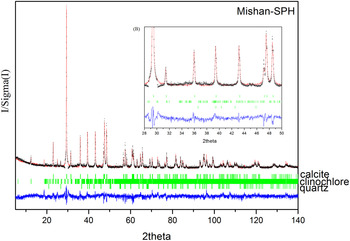
The same strategy was applied to refine the Mishan sample. However, besides the major phase calcite (98.21%), Mishan contains two minor impurity phases, quartz (0.40%) and clinochlore (1.39%). These impurity phases (since their amounts are quite small) have only a minor impact on the overall refinement. Accordingly, only their individual cell and phase fraction parameters were optimized during the refinement. The profile parameters of these two minor phases were approximated by constraining them to be the same as those of the major calcite phase. Compared with Occ, a similar trend was found when the preferred orientation was modeled for the calcite phase of Mishan through MD1, MD2, and SPH, respectively, but only the latter result is presented. These data have greater preferred orientation, as noted by the texture index. If the texture index is equal to one, it means random texture; if it is close to three, it means a strong texture. When it is higher than three, the diffraction data may be over fitted.
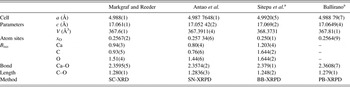
In carbonates, the expected C–O bond length is 1.28–1.29 Å based on single-crystal X-ray diffraction (SC-XRD) (Effenberger et al., Reference Effenberger, Mereiter and Zemann1981; Reeder and Wenk, Reference Reeder and Wenk1983; Markgraf and Reeder, Reference Markgraf and Reeder1985; Zucchini et al., Reference Zucchini, Comodi, Katerinopoulou, Balic-Zunic, McCammon and Frondini2012), synchrotron X-ray powder diffraction (SN-XRPD) (Antao et al., 2009), and parallel-beam transmission X-ray powder diffraction (PT-XRPD) (Ballirano, Reference Ballirano2011) data. However, for the Mishan sample, in the SPH fit the C–O bond length of calcite is about 1.26 Å, significantly shorter than what is expected. This is likely because of the correlation between the spherical harmonic and crystallographic parameters producing a range of models that provide very similar fits. To provide the most credible result, a restraint was introduced on the distance between the C and O atoms for the calcite phase of Mishan. The target value and uncertainty for the restraint were set as 1.285 ± 0.01 Å, and refinements with two different restraint weights, 50 (SDC-1) and 500 (SDC-2), were performed. These refinements produced minor changes in the overall fit with: R wp = 14.8, 14.7, and 14.9 and χ 2 = 2.29, 2.23, and 2.31 for SPH, SDC-1, and SDC-2, respectively. The contribution of the distance restraint to the overall refinement (W SDC) is minor, with a contribution to the χ 2 of 1.59 and 0.40%, respectively, for SDC-1 and SDC-2. Note that as the restraint weight is increased, both the bond length and texture index increase, but W SDC decreases. In this paper, it is not a key point that the authors discuss the relation between W SDC with the restraint weight, only a reference paper published by Nowell et al. (Reference Nowell, Attfield and Coleb2002) is recommended.
From a chemical point, an appropriate weight of the distance restraint is indispensable to obtain a reasonable bond length for the Mishan sample. However, the correlation among refined parameters should be checked. Therefore, the correlation matrix were output by clicking on “Print the correlation matrix” in the LS controls menu. The authors found that the correlation among refined parameters for SPH, SDC-1, and SDC-2 fits are very similar, and so only the correlation coefficients of SDC-2 as an example are shown:

From the above correlation matrix terms, we can see that the background parameters correlate highly among each other, which is common for Chebyschev polynomial terms. This is also true for the spherical harmonic terms. Note that the background and spherical harmonic terms do not correlate with other parameters to a significant degree. This demonstrates the relative insensitivity to the combination of these parameters. The Uiso thermal parameters of Ca and O atoms are closely correlated with the weight fraction of calcite phase, which shows that careful consideration of the Uiso values is necessary if the most accurate quantitative analyses are to be obtained. Correlation values in the range of 0.5–0.75 are rarely problematic in Rietveld fits and even values up to 0.95 usually refine well, perhaps with need for some damping on shifts. Here, most values are less than 0.75 and none are above 0.9.
IV. RESULTS AND DISCUSSION
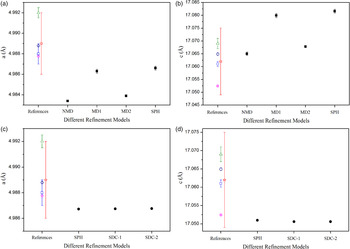
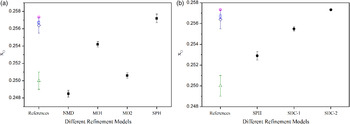
The published structural parameters of calcite (Markgraf and Reeder, Reference Markgraf and Reeder1985; Sitepu et al., Reference Sitepu, O'Connor and Li2005; Antao et al., Reference Antao, Hassan, Mulder, Lee and Toby2009; Ballirano, Reference Ballirano2011) are also provided in Table III for comparison with the data in Table II. The Rietveld fits of Occ are shown in Figures 4 and 5 using different treatments to model the preferred orientation, and the Rietveld fit of Mishan-SPH is shown in Figure 6. Cell parameters of Occ and calcite of Mishan are plotted against different refinement models in Figure 7. x O sites of Occ and calcite of Mishan are also plotted against different refinement models in Figure 8.
(Color online) Enlargement of Rietveld fit of Occ–MD1 (a) and Occ–MD2 (b), respectively: the red curve is observed diffraction pattern (line), and the black is calculated (crosses); vertical marks indicate the positions of allowed Kα 1 and Kα 2 reflections; the blue curve at the bottom shows the difference between observed and calculated patterns (line).

(Color online) (a) Rietveld fit of Occ–SPH: the red curve is observed diffraction pattern (line), and the black is calculated (crosses); vertical marks indicate the positions of allowed Kα 1 and Kα 2 reflections; the blue curve at the bottom shows the difference between observed and calculated patterns (line). (b, inset) Enlargement of Rietveld fit of Occ–SPH.

(Color online) (a) Rietveld fit of Mishan–SPH: the red curve is observed diffraction pattern (line), and the black is calculated (crosses); vertical marks indicate the positions of allowed Kα 1 and Kα 2 reflections; the blue curve at the bottom shows the difference between observed and calculated patterns (line). (b, inset) Enlargement of Rietveld fit of Mishan–SPH.

(Color online) Cell parameters of Occ and calcite phase of the Mishan sample plotted against different refinement models (DRM): (a) a of Occ versus DRM; (b) c of Occ versus DRM; (c) a of calcite of Mishan versus DRM; (d) c of calcite of Mishan versus DRM. ■ Occ; ● Calcite of Mishan; □ Mark graf and Reeder; ○ Antao et al.; △ Sitepu et al.; ◇ Ballirano; ⋆ the average lattice parameters of 11 PDF cards. The vertical bars represent errors. If no bar is given, then the error is contained within the area of the symbol.

(Color online) x O sites plotted against different refinement models (DRM): (a) Occ; (b) calcite phase of the Mishan sample. ■ Occ; ● Calcite of Mishan; □ Mark graf and Reeder; ○ Antao et al.; △ Sitepu et al.; ◇ Ballirano. The vertical bars represent errors. If no bar is given, then the error is contained within the area of the symbol.

Details of the published structure parameters of calcite.

Note: aBond lengths are calculated in terms of cell parameters and atomic coordinates in their studies. Standard deviations are given in parentheses.
A. R factors
1. Occ
Compared with these R factors obtained with no treatments for the preferred orientation, all R factors, significantly decrease when MD1, MD2, and SPH are introduced to model the preferred orientations (Table II). The significantly better fit obtained for SPH indicates it is superior to MD1 and MD2, and therefore the texture for these calcite data cannot be satisfactorily described by a single or two MD vectors (Figures 4 and 5).
2. Mishan
When a restraint is added to the model, the R factors slightly change (Table II). All of three fits are visually indistinguishable. Toby (Reference Toby2006) stated that agreement factors are not the only indicators of the quality of a Rietveld fit and the greater chemical plausibility allows us to state that model SDC-2 is preferred.
B. Cell parameters
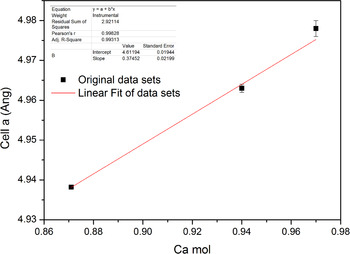
The standard uncertainties (ESDs) in this paper are larger than those values obtained from SN-XRPD (Antao et al., 2009), but they are smaller than those values from SC-XRD (Markgraf and Reeder, Reference Markgraf and Reeder1985) (Figure 7, Tables II and III). The improved precision of synchrotron data is to be expected, but shows that laboratory powder diffraction can be competitive or better than single-crystal measurements of cell dimensions. A search in the PDF-4+ 2013 (published by ICDD) for star quality, ambient, Ca/C/O only, and space group #167 yielded 11 PDF cards. The average lattice parameters of cells a and c were 4.989(3) and 17.062(13) Å, respectively, and were added into the corresponding pictures in Figure 7 as a reference (Star in Figure 7). It is very obvious that the calcite cell parameters obtained through different models approach basically the coverage of the average lattice parameters of 11 PDF cards. In general, the cell parameters of calcite are closely related to its composition. Then, a further search in the PDF-4+ 2013 (published by ICDD) for star quality, ambient, magnesium calcium carbonate, and space group #167 yielded seven hits. Three of them were chosen that visually agreed well with our measurement, and the parameters cell a from three PDF cards (01-086-2336, 01-089-1304, and 01-089-1305) were plotted against the Ca atoms in the chemical formula in Figure 9. A linear fit was analyzed for three sets of figures, and a linear equation y = 4.6119 + 0.3745x (R = 0.9983) was obtained. Both Ca atom numbers in the chemical formula calculated by the linear equation are little larger than 1 for Occ and the calcite phase of Mishan. Although it is a rough calculation, this still shows that the cell parameters refined from powder diffraction in this paper agree with these published ones very well.
(Color online) Cell a of three PDF cards plotted against Ca mol for calcite, and a linear fit was analyzed.

1. Occ
Compared with those from MD1 and SPH, the cell parameters from NMD and MD2 are clearly smaller (approximately tens of σ) [Table II and Figures 7(a) and 7(b)] showing that untreated or improper preferred orientation can skew these parameters. However, the cell parameters show negligible changes (approximately few σ) when MD1 and SPH are applied to modify the preferred orientation, and agree well with the literature, as shown in Figures 7(a) and 7(b).
2. Calcite of Mishan
The cell parameters of calcite of Mishan also approach the literature values obtained by Antao et al. (2009) when SPH, SDC-1, and SDC-2 are applied [Figures 7(c) and 7(d)]. Compared with these values from SPH, the cell parameters of calcite of Mishan are nearly unchanged when SDC is further applied, and the changes are approximately ± 1 σ [Tables II and III, Figures 7(c) and 7(d)].
C. Isotropic displacement factors
The different refinement models show negligible effects on the isotropic displacement factors. Even without treatment for preferred orientation in the NMD model, the Uiso values are still quite reasonable. Similarly, a search in the PDF-4+ 2013 (published by ICDD) for star quality, ambient, calcite, and space group #167 yielded 18 PDF cards, but only three PDF cards (04-012-6929, 04-012-6930, and 04-013-2116) provide the Biso or Uiso values. The isotropic displacement factors in this paper are in accord with these values in the three PDF cards.
D. Bond lengths, atomic coordinates, and bond valence sums
Tables II and III show that the incorporation of preferred orientation treatments brings the Ca–O and C–O bond lengths much closer to the consensus literature values, and likewise for the atomic coordinate x O (Figure 8). Note that since the model has only one refinable structural parameter, x O, this value and the lattice parameters determine the interatomic distances. ESD values from the SPH model are slightly larger than those reported by Antao et al. (2009) and Markgraf and Reeder (Reference Markgraf and Reeder1985).
With different refinement models, the changes of bond valence sums of Ca, C, and O atoms calculated by the program Bond_Str (Brown and Altermatt, Reference Brown and Altermatt1985; Brown, Reference Brown2002) are in accord with the ones of the bond lengths (Table II), and it is reasonable because the bond sums are closely related to the bond lengths. As a result, the bond sums are closer to the theoretical values when the C–O bond length approaches 1.28 Å.
E. Reasons why different refinement models have different effects on the structural data and the credibility of the structural data
The introduction of preferred orientation models, whether modeled by MD or SPH, makes a significant impact on the resulting structural data, including the cell parameters, the bond lengths, and the atomic coordinates. However, after MD or SPH functions are introduced, preferred orientation treatments are correlated with the bond lengths and atomic coordinates, but not with the cell parameters. This can be understood because a preferred orientation affects the peak intensities, but not the peak positions. The cell parameters depend on the peak positions, whereas the atomic coordinates depend on the peak intensities. The preferred orientation models change the calculated structural factors and thus affect the atomic coordinates.
The bond lengths of calcite are consistent with the values obtained from the refinement of SC-XRD (Markgraf and Reeder, Reference Markgraf and Reeder1985), SN-XRPD (Antao et al., 2009), and PT-XRPD (Ballirano, Reference Ballirano2011) data for Occ. However, in the more highly textured Mishan sample, accurate bond lengths were not obtained until a restraint on distances was introduced. If one is using Rietveld analysis to determine bond distances, it is clear that significant levels of texture may introduce problems.
In summary, we conclude that the preferred orientation is the principal factor that affects the quality of the BB-XRPD diffraction data for calcite.
ACKNOWLEDGEMENTS
The authors acknowledge the financial support for technological innovations from the Institute of Geology and Geophysics, Chinese Academy of Sciences. Shanke Liu is indebted to Professor Jiaju Li for his tremendous help and encouragement in studying the Rietveld method. Shanke Liu is also grateful to Dr. B.H. Toby for helping with GSAS refinement skills and tremendous encouragement in preparing this paper through private communications. Two anonymous reviewers are thanked for their constructive critical suggestions aimed to improve the quality of the manuscript.
SUPPLEMENTARY MATERIALS AND METHODS
The supplementary material for this article can be found at http://www.journals.cambridge.org/pdj.