


Our Proxy Model of presidential election forecasting declared, from data issued six months before the November contest, that Obama would garner 52.7% of the two-party popular vote. [See the model release in our Monkey Cage blog-post (Lewis-Beck and Tien Reference Lewis-Beck and Tien2012a) on September 18, 2012, and in the October issue of PS (Lewis-Beck and Tien Reference Lewis-Beck and Tien2012b).] Thus, that forecast called the correct winner, with a point estimate error of only 0.9 percentage points.
Before the 2012 election, we offered two forecasting models: our long-standing Jobs Model and our new Proxy Model (Lewis-Beck and Tien Reference Lewis-Beck and Tien2012b). Whereas the Jobs Model derives from voting behavior theory, the Proxy Model derives from a data-driven search. Unexpectedly, the two models did not converge in their forecasts. We felt a scientific obligation to announce a preference, and initially gave the nod to the Jobs Model (Lewis-Beck and Tien Reference Lewis-Beck and Tien2012b). However, an accumulation of external evidence finally convinced us to give the nod instead to the Proxy Model.
The Proxy Model Applied
The Proxy Model for vote forecasting bases itself on an empirical surrogate for that vote, measured prior to the election. The model reads as follows:
 $$
{\rm Vote}_{\rm t} = f({\rm Vote Proxy}_{{\rm t} - {\rm x}} )
$$
where Votet = the percentage of the two-party popular vote; Vote Proxyt−x = an observed indicator of the unobserved vote, measured at a prior time. The proxy variable we identify can be labeled the National Business Index (NBI), so
 $$
{\rm Vote} = f({\rm NBI}_{{\rm t} - {\rm x}} )
$$
where NBI = respondent share who say “business conditions are better” minus the respondent share who say “business conditions are worse,” as reported in the national University of Michigan Survey of Consumers. The NBI, measured in April about six months before the November 2012 election, maximizes its correlation with incumbent vote, r = .83. (Other variables could be added and were, for example, incumbency, presidential popularity, macroeconomic indicators, at different lags. None added significantly to the predictive power of the single variable model below.)
The simple regression estimation for the Proxy Model yields
 $$
{\rm Vote}_{\rm t} = \mathop {51.67}\limits_{(48.23)} * + \mathop {.09}\limits_{(3.69)} *{\rm NBI}_{{\rm t} - {\rm 6}} + {\rm e}
$$
 $$
{\rm R-sq}{\rm .} = .69,{\rm Adj}{\rm . R-sq}{\rm .} = .64,{\rm SEE} = 2.96,
$$
 $$
{\rm D-W} = 2.45,{\rm n} = 8{\rm (1980-2008),}
$$
* = statistical significant at .05, two tails, figures in parentheses are t-ratios.
The equation has statistical strengths in addition to the fit statistics. Within-sample, it predicts the popular vote winner every year, on a mean absolute error of only 2.19 points. Forecasting out-of-sample, as in 2012, involves the following calculations. The NBI score = 11. This says that in 2012 (spring), 51 percent saw business conditions as “better,” while only 40 percent saw business conditions as “worse.” On balance, the public saw the economy as improving. Plugging this NBI estimate into the Proxy Model yields the 2012 forecast:
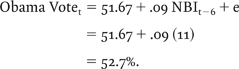 $$
\displaylines{
{\rm Obama Vote}_{\rm t} = 51.67 + 0.9{\kern 1pt} \,{\rm NBI}_{{\rm t} - {\rm 6}} + {\rm e} \cr
= 51.67 + 0.9{\kern 1pt} \,(11) \cr
= 52.7\% . \cr}
$$
The Proxy Model and the Economy
The proxy variable, based on consumer sentiments, has substantive implications. As a naïve model of economic voting, it is suggestive. Our recent work shows voter perceptions link to the real US economy, with perception of economic change counting heavily (Lewis-Beck, Martini, and Kiewiet Reference Lewis-Beck, Martini and Kiewiet2012). The Proxy Model implies that if the public sees economic improvement, they strongly reward the incumbent.
The Proxy Model as a Forecasting Instrument
We have offered four characteristics for forecasting model evaluation: accuracy, lead, parsimony, and replication (Lewis-Beck Reference Lewis-Beck2005). Examining the model by these criteria, it scores high. With respect to accuracy, the Proxy Model is off by less than one and one-half percentage points. With respect to lead, the forecast comes from a measure taken six months before the election. Its parsimony is absolute, with only one independent variable. Finally, its replication is simple. These favorable forecasting characteristics contrast starkly to those of certain state-level, sharply poll-driven models much in vogue.
Forecasting the Electoral College Vote
What finally matters is the Electoral College vote. We have used popular vote share to predict electoral vote share (Lewis-Beck and Tien Reference Lewis-Beck and Tien2012b):
 $$
{\rm Electoral Vote} = \mathop { - 200.15}\limits_{( - 11.88)} + \mathop {4.91*}\limits_{(15.27)} {\rm Popular Vote}
$$
 $$
{\rm R-sq}{\rm .} = .94,{\rm Adj}{\rm . R-sq} = .94,{\rm SEE} = 6.96,
$$
 $$
{\rm D-W} = 1.44,{\rm N} = 16{\rm (1948-2008)},
$$
* = statistical significant at .05, two tails, figures in parentheses are t-ratios.
Using this regression equation, the Proxy Model forecast of 52.7 predicts an electoral vote share of 58.61% or 315 Electoral College votes, which misses the 2012 Electoral College Obama vote of 332 by only 17 votes.
Conclusions
The proxy approach to US presidential election forecasting offers something new. Our Proxy Model appears to work well. Moreover, it has the favorable traits of a good forecasting instrument (accuracy, lead, parsimony, replication). Viewed substantively, it suggests the importance of economic voting in the Obama victory. Moreover, the fact that the model errors in the positive direction (that is, it is 0.9 points too high), also comports with our argument that Obama could expect to pay a “racial cost” from his expected vote total (Tien, Nadeau, and Lewis-Beck Reference Tien, Nadeau and Lewis-Beck2012). The Proxy Model also has familiarity value, following the tradition of national-level forecasting models. Further, it has ready transparency. The proxy approach may pose a path through the forecasting thicket.


