

Published online by Cambridge University Press: 25 April 2006
Data matter. Protest data are no exception. Not all datasets areequal, nor do all have equal validity and reliability. Thus far,there has been no serious debate regarding the quality of protestdatasets. Increasing attention to protest studies suggests that nowis the time to talk about the sine qua non forgrowing knowledge in this sub-field of comparative politics. In thispaper I emphasize the importance of the underlying data sources. Inparticular, I argue that protest datasets should be drawn from manysources, particularly as many local sources as possible, in order toprovide accurate and meaningful data. To support this contention, Ifirst discuss traditional protest datasets and their limitations andprovide suggestions about how to overcome these limitations. Second,I explain an alternative type of dataset coding and itscharacteristics. And finally, I use statistical tests to illustratethe importance of local sources.I givemy sincere and deep thanks to Erik S. Herron and Ronald A.Francisco for reviewing drafts of this paper and giving meindispensable comments and continuous encouragements. I wouldalso like to thank Elizabeth Collins and Omur Yilmaz who editeddrafts of this manuscript. My appreciation also goes toanonymous reviews of this paper and the editors of PS:Political Science and Politics. I would like tothank my late farther, Ki-Dae whose love and support were simplyendless. I'll share any compliment with them, but only I willtake responsibility for any error.
Data matter. Protest data are no exception. Not all datasets are equal, nor do all have equal validity and reliability. Thus far, there has been no serious debate regarding the quality of protest datasets. Increasing attention to protest studies suggests that now is the time to talk about the sine qua non for growing knowledge in this sub-field of comparative politics. In this paper I emphasize the importance of the underlying data sources. In particular, I argue that protest datasets should be drawn from many sources, particularly as many local sources as possible, in order to provide accurate and meaningful data. To support this contention, I first discuss traditional protest datasets and their limitations and provide suggestions about how to overcome these limitations. Second, I explain an alternative type of dataset coding and its characteristics. And finally, I use statistical tests to illustrate the importance of local sources.
Event coding has become an essential part of data collection in various sub-fields of political science (Woolley 2000). Coding events, such as military conflicts,1
Such as the Correlates of War Project (Singer).
First, categories of events in the traditional datasets can obstruct efforts to discern their specific nature because their categorizations are often too general, arbitrary, and inaccurate. In these datasets, protest events are typically categorized into no more than a dozen types, according to multiple factors. These factors usually include the basic nature of an event (political/social), such as the level of violence, participants' characteristics and numbers, target, purpose, scope, and level of spontaneity. The end product typically gives the frequency of certain types of events for a given time period. This categorization provides a straightforward data structure. However, this practice produces several problems: 1) categories of protests are confusing because of coding inconsistencies; 2) an event may fall into multiple categories or no category at all; 3) the practice discards potentially valuable details; and 4) it limits the possibility for an end-user to sort and recode events based on his or her need.
For example, as Table 1 illustrates, the World Handbook has six categories for political protest—protest demonstration, regime-support demonstration, political strike, riot, armed attack, and political assassination (Taylor and Jodice 1983, 19–47). “Riot” is clearly an event distinguished from “demonstration” because of its violent nature, “destruction of property.” However, unlike “demonstration” which is divided into anti-and pro-regime, the targets of riots are left unspecified, leading to the incorrect assumption that political riots occur only as protests against regimes.2
Without any justification such an assumption ignores the occurrence of pro-government riots such as those in Venezuela under the Chavez regime.
Categories of Political Protests and Their Factors in the World Handbook of Political and Social Indicators (Taylor and Jodice 1983)

The second problem is that only yearly-summed numbers of events are available, eliminating the possibility of quarterly or monthly, let alone weekly or daily, analyses. For example, one finds from Banks' dataset (2001) that in South Korea there were six protest events—two riots and four anti-government protests—in 1990. However, no information is available on exactly when in 1990 these events occurred, where in South Korea, and what these events specifically entailed. Therefore, this annually aggregated dataset is insufficient if a researcher wanted to analyze protest events within a year3
Ferrara (2003) studied different reactions in the Burmese military regime toward mass protests in summer 1988.
Third, and most important, the traditional protest datasets have often relied on a limited number of sources. It is common for only one or two sources to be sampled. The Prodat project sampled German protest events from two German newspapers while Kriesi and his colleagues (1995) used only one national newspaper for each country.4
Their data contain events of France, Germany, the Netherlands, and Switzerland from 1975 to 1989.
For this point and for further discussion about using multiple sources, see Francisco (2006).
The cited problems can be overcome by 1) coding events with minimal generalization; 2) providing needed information about events and sources; and 3) increasing the number of sources. Protest and Coercion Data (PCD)6
As of June 14, 2005, 27 European states from 1980 through 1995, two Asian states (Burma 1988 and South Korea 1990–1991), three Latin American states (Colombia 1988–1997, El Salvador 1979–1991, and Peru 1980–1995) are coded. European PCD (Francisco) and links to other datasets are available at http://lark.cc.ku.edu/∼ronfran/data/index.html. See Appendix A for definitions of exemplary actions coded in the datasets.
Protesters are those who challenge state authority using various means, including but not limited to demonstrations, strikes, riots, and statements.
Such information is gathered and coded in PCD, creating detailed information about each event. Such an abundance of information allows the end-user to sort events into whichever categories he or she wishes. For instance, from the French PCD, we know that on Monday April 25, 1983, about 30 “farmers” stopped and emptied two trucks carrying Italian wines in Sete, France in protest against EU imports. In the course of the event, property-damage occurred, but no one was injured or arrested. According to the World Handbook, this event must be categorized somehow, but it is not clear in which category this event would belong. It could have been coded as “riot” because of the property damage, but there were only about 30 participants, which would disqualify this event as a riot according to the same codebook. Instead, it could be coded as an “armed attack” because this category does not specify the minimum number of participants and it does cover events with property damage. However, it is difficult to determine if the action was planned—which is an important criterion for an event to be “armed attack.” The more serious problem is that once this event is coded, much of the information about the event disappears; instead it increases the count of a category by one. On the other hand, from the perspective of PCD users, this event does not need to be categorized, and various information of this event can be used in multiple ways. Or, if needed, this event can be categorized in more than one category. Since the information pertaining to the event is included in the event description, users can always go back, review the detailed information, and change the categorization to fit their coding. The farmers' behavior can be categorized as a riot, armed attack, demonstration, “foreign policy” (by topic), or “under 100” (by the number of protesters) depending on the needs of different researchers.
Second, to overcome the yearly aggregated data problem, the PCD project codes sub-daily events. As mentioned, PCD contain every and all reported protests and repressive events in a country. All events in a given day are separately coded, and an event is distinctly coded if it evolves into a different one. For example, assume that an event occurs where students protest on a campus. Later that day, the students try to march outside of the campus, and a riot breaks out when the police try to stop them. In terms of students' behavior, there are two distinct events. The protest on campus does not involve any confrontation, but it turns into a violent event against state actors. Here two events, rally and riot, are coded as separate events on the same day, and the numbers of participants in each event (some protesters do not take part in the riot) are also separately coded. This practice of coding allows researchers to study protests on a sub-annual basis. One can trace, for example, weekly or daily trends of protests if necessary, which gives a more detailed and informed knowledge about protests than studies based on yearly data. Thus, PCD allow researchers to find patterns that are almost impossible to study using annually aggregated data.
The third requirement, data from a small number of sources, is solved by simply employing many relevant sources. PCD have multiple sources. For example, the European PCD used approximately 500 newspapers, trade publications, and wire services available on Lexis-Nexis as their main sources. The magnitude of sources emphasized by PCD provides a critical improvement: events sampled in PCD outnumber other datasets by huge margins (Francisco 2006). For example, from 1980 through 1982, in France, 975 events were coded in PCD, while only 202 were coded in the World Handbook and none in Banks' data (1991). Even in comparison with data focused on a single country, PCD do better. German data by Kriesi et al. (1995) contain 676 events for the period, whereas the PCD have 1,177 events. The magnitude of the sources used by the European PCD is even more impressive in regards to the ratio of number of sources to countries. On average, in the European PCD one country is covered by about 16 news media (16:1) while in Banks' data (1991), the ratio drops to 0.006 sources per country.
Besides the increased number of events, the inclusion of more sources in PCD has improved the data on two other critically important dimensions. First, PCD are based on news sources with a wide range of interests. The specialty of sources ranges from general to very specialized interests. For example, news services such as Agence France Press, Associated Press, and Reuters provide general news, while news media such as Energy Economist focuses on a theme, and thus offers detailed reporting on their specific issue. The ideological mixture also increases the diversity of the PCD. There are conservative news media sources such as Die Welt of Germany as well as progressive media sources such as Greenpeace Business. By using such variety of sources, PCD extend the breadth and depth of sources to draw samples. And, this makes PCD more useful and less vulnerable to bias because of individual sources.
Second, PCD include many local sources. Local sources such as Belfast Telegraph, Cypriot Broadcasting Corporation, Neue Zürcher Zeitung (Daily Zurich newspaper), and Radio Telefis Eireann (Radio and Television of Ireland) were rarely, if ever, used in coding protests in any of the traditional datasets. Using local sources is important, especially for protest data, because protests tend to be about local issues and last only for short periods of time. If an event is serious enough—usually tragic and deadly and/or about an internationally appealing issue—the event would be covered not only by local news media, but also by the general news media. However, such events only occur sporadically because protests are usually about mundane issues like wage increases,8
For example, about 26.9% (1,639 out of 6,097) of events in South Korea in 1990 and about 64.6% (673 out of 1,042) of events in Finland from 1980 to 1994 are directly related to the issue of wage increase (Korean and European PCD, respectively).
How important is it to use local sources in data collection? A precise measure may seem hard to obtain, but we can test the significance of using local sources by comparing the sample size of datasets. I hypothesize that the protests coded using local sources will significantly outnumber the protests coded from non-local sources. This hypothesis is tested by comparing datasets in two contexts: 1) in Europe, comparing traditional datasets which rarely include local sources to the European PCD, which uses local sources available in Lexis-Nexis; 2) in Asia, comparing the utility of Lexis-Nexis and Asian sources. The first comparison has already been found to support the hypothesis. As discussed, the European PCD use various European sources in Lexis-Nexis and have far more observations than the traditional datasets (Francisco 2006). From this, we find evidence supporting the hypothesis. The degree to which local sources have contributed to this achievement can be illustrated by the case of Switzerland, where 1,811 events were coded in the PCD from 1980 through 1995. Among them, 561 events—about 31%—were coded from local sources. Had PCD relied exclusively on American sources such as the Associated Press or the New York Times, 31% of the events might have been neglected.
The second test is done in the context of the two Asian countries, Burma and Korea, for which PCD are available (Burma coded by Ferrara 2003; Korea by Nam 2005). The PCD project has been expanded beyond Europe to Asia and Latin America9
Burma 1988 was coded by Ferrara; South Korea 1990–1991, by Nam; and Colombia 1988–1997, El Salvador 1979–1991, and Peru 1980–1995, by Garrison.
Unlike the European PCD that used Lexis-Nexis as a main source of information, Korean data were collected using the KINDS10
KINDS at www.kinds.or.kr.
They include various words like demo, nong-sung, hang-ui nong-sung, hang-ui demo, si-wi, hang-ui siwi, demonstration, si-wi woon-dong, jip-dan si-wi, jip-dan nong-sung, pa-up, no-jo pa-up, and no-dong jo-hap pa-up.
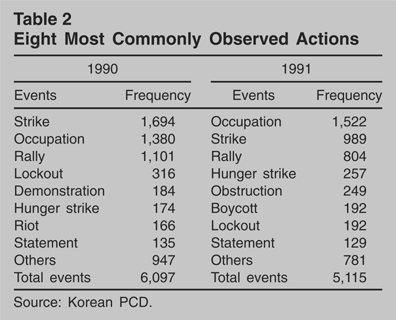
The collected data contain specific information and important theoretical utilities. Table 2 lists eight of the most frequently observed actions from 1990 to 1991. Accordingly, “Strike” and “Occupation” occurred most frequently, followed by “Rally.” “Riot” subsided in 1991 while “Obstruction” became more popular. We also see that actions such as “Hunger strike,” “Lockout,” and “Statement” continued to occur persistently during these years. Table 2 shows there were 6,097 events, or 16.7 protest events per day, in Korea in 1990, and no single day went without an event. In comparison to other countries coded in PCD, this is by far the largest number of events observed in one year. Only events in Korea in the following year (5,115) approach this magnitude. Among the other countries, protests in the United Kingdom were second to Korea. In the U.K., there were 1,938 events in 1990, and 2,435 in 1991. This is about 5.31 events per day in 1990 and 6.67 events per day in 1991. This comparison demonstrates the significance of the magnitude of the Korean data.
Eight Most Commonly Observed Actions

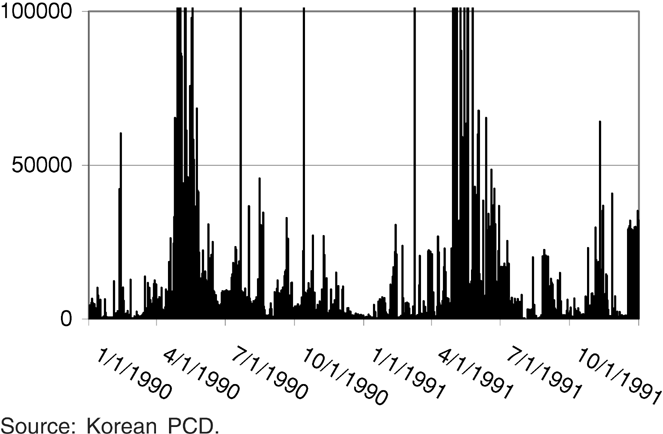
The magnitude of protest activities can be illustrated by aggregating the total number of protesters12
The measurement is distinguished from others that gauge the number of events (Gupta, Singh, and Sprague 1993, 309). Counting the number of protesters offers a more accurate picture of protest activities because it can compare the significance of one event with 10,000 participants with 10 events each carried out by 10 participants.
Such daily measurements are often more desirable than annual or monthly analysis. Daily aggregation is intended to reveal dynamics with as much detail as possible, following Lichbach's advice that “to capture the dynamics of protest over time, … studies should use as short a temporal aggregation as possible” (Lichbach 1985, 601). Thus, for example, the significance of a reaction (i.e., backlash) responding to an event a few days prior can be accounted for by daily data, unlike weekly aggregated data incapable of the same task.
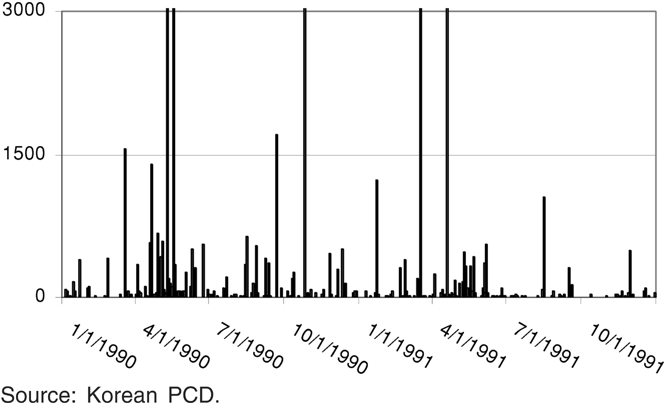
Coercion can be measured in various ways. One popular scheme is to produce an ordinal variable. For Gurr and Moore (1997), for example, coercion is comprised of six ordinary scales counting events from relatively light repression such as conventional law enforcement to brutal repression such as genocide (1,088). However, ordinal variables usually contain limited information (Blalock 1979, 16–17).

Protesters in South Korea 1990–1991 (truncated to show less than 100,000 protesters)

Repression in South Korea 1990–1991 (truncated to less than 3,000 repressed protesters)
How much of the extreme magnitude of Korean protests documented in the PCD is due to local data? To answer the question, I compared the Korean PCD to Korean data collected from Lexis-Nexis. As explained earlier, Lexis-Nexis provides invaluable variety in terms of sources. In the case of Korea, however, Lexis-Nexis lacks local sources. According to my previous argument, this lack of local Korean sources may lead to the compilation of unrepresentative and insufficient Korean data. On the other hand, the Korean PCD are based solely on local news sources. Therefore, a comparison between the two Korean datasets can answer whether it was the role of local sources that contributed to the huge and distinctive Korean dataset.
I hypothesized that protests coded from local source would outnumber protests coded from general sources. To test this hypothesis, I randomly sampled 10 weeks, out of the 104 weeks for two years covered by the Korean PCD (1990 to 1991), and compared the coverage—in terms of both the number of events and the number of protesters—of the Korean PCD to Lexis-Nexis.15
See Appendix B for the detailed information about the numbers of events and protesters during the selected weeks and for their comparisons between local and general sources.
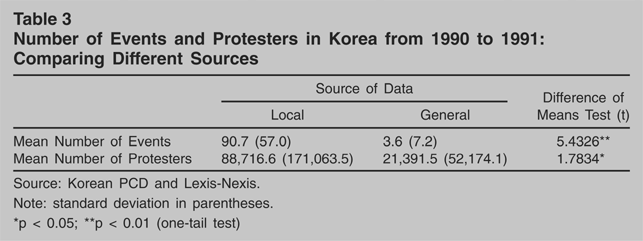
The results confirm my a priori prediction. As Tables 3 and 4 show, using local data, or their equivalent, produced significantly richer datasets. In the case of the Korean data, the numbers of events in each and every week are different, and the number of events from Korean local sources is always larger than the number of events from the general sources of Lexis-Nexis. In Week 3, no events were reported by general sources, while Korean local sources reported 54 events. Similarly, in Weeks 40, 49, and 64, general sources did not report any events, but there were many events according to Korean sources. On average, there were 3.6 events per week reported by general sources, compared to 90.7 events per week reported by Korean sources, and a difference of means test shows the gap is statistically significant (see Table 3). Similarly, in weeks when no protest events were reported by general sources, many protesters participated in various events according to Korean sources. The average number of participants for the 10 weeks reflects a similar discrepancy between local (88,716.6) and general sources (21,391.5). According to a two-sample difference of means test, the number of protesters reported by Korean sources is also significantly larger than the number of protesters reported by general sources. The test on protesters shows that in terms of the number of protesters too, local sources are reporting significantly larger numbers.
Number of Events and Protesters in Korea from 1990 to 1991: Comparing Different Sources

Number of Events and Protesters in Burma in 1988: Comparing Difference Sources

The comparisons of the number of events and protesters in the two Burmese datasets validate the hypothesis as well (see Table 4). Even though the average number of events from local sources and from general sources was not statistically different, the mean number of protesters from local sources was significantly larger than the mean number of protesters from general sources.
Past studies of protests have used various data to enrich our knowledge of the topic. However, there have been problems with the data on which many studies rely. These problems include use of inconsistent categories, annually aggregated information, and reliance on a small number of sources. I argue that these problems have resulted in the neglect of valuable information and have left end-users with limited means to verify and manipulate information according to their needs. Moreover, the traditional datasets remain vulnerable to various types of bias due to their dependence on very few sources.
The PCD project solves these problems. By coding each and every reported protest event in a country, the project has eliminated the risk of losing detailed information and of imposing rigid categories. By relying on multiple sources, the project has adopted a measure to minimize bias. Therefore, these datasets have alleviated the various risks from which previous datasets have suffered. More important, the PCD include local coverage of protest events in sampled countries as important sources. In the case of the European PCD, Lexis-Nexis provided an excellent opportunity to use the local coverage, contributing to the unprecedented magnitude of European PCD. Burmese and Korean data included local sources outside of Lexis-Nexis and benefited remarkably from their use. The importance of local sources in coding protest events is supported by statistical tests. The comparison of data indicates that datasets vary widely in terms of the information that they contain. The presence of such a huge discrepancy among datasets unequivocally affects research results. Any judgment on the quality of a dataset is open to debate; however, this study has demonstrated that the data sources one chooses matter, as does the manner of coding.
Taehyun Nam is assistant professor, Department of International Studies at Rhodes College. His main interest includes the dynamics of protests and repression. The author can be contacted regarding this paper at namt@rhodes.edu. Data and codebook are available at his web site: www.poliscience.org.


Categories of Political Protests and Their Factors in the World Handbook of Political and Social Indicators (Taylor and Jodice 1983)

Eight Most Commonly Observed Actions

Protesters in South Korea 1990–1991 (truncated to show less than 100,000 protesters)

Repression in South Korea 1990–1991 (truncated to less than 3,000 repressed protesters)

Number of Events and Protesters in Korea from 1990 to 1991: Comparing Different Sources

Number of Events and Protesters in Burma in 1988: Comparing Difference Sources