

INTRODUCTION
While radiocarbon (14C) dating is a well-founded technique, there still remain issues of measurement comparability. It is clear that there is a need for continuing “routine” quality assurance checks using reference materials (indeed users expect this). The international intercomparison program is an essential component of quality and standards for the accurate use of 14C dating in archaeology. Issues of interlaboratory reproducibility, precision, and accuracy are of particular relevance to users of 14C measurements.
Thus, it was important that the new program of intercomparison exercises continued with identification and testing of new, appropriate 14C reference materials, as part of its quality assurance role. The design and organization for the Sixth International Radiocarbon Intercomparison (SIRI) was intended to continue this long-running program, focusing on the use of natural samples. SIRI complements and extends previous radiocarbon international quality assurance programs run successfully by report authors; most recently TIRI (1991–1995), FIRI (1997–2002), and VIRI (2004–2008) (Scott Reference Scott2003; Scott et al. Reference Scott, Cook and Naysmith2010a, Reference Scott, Cook and Naysmith2010b).
The aims and objectives of SIRI are as follows:
-
∙ to demonstrate the comparability of routine analyses carried out in radiocarbon laboratories;
-
∙ to quantify the extent and sources of variation in results;
-
∙ through choice of material, to contribute to the discussion concerning laboratory offsets and error multipliers in the context of IntCal (the International Calibration Program); and
-
∙ to gain a better understanding of differences in background derived from a range of infinite age material types.
Samples were sourced widely and include a sequence of single, dendro-dated tree rings, bones, humic acid, and charcoal, including several background and close to background samples. Seven wood samples span medieval to background, several are single rings, others decadal, some are dendro-dated. They come from New Zealand, Europe, and the United States. One bone sample is background, while the second is anticipated to be close to background. The charcoal sample is from an important European Palaeolithic site, Chauvet Cave. A doublespar, a humic acid, and a barley mash sample make up the set of the 13 samples, which were distributed to more than 60 laboratories worldwide. Our main focus in the design of SIRI was accelerator mass spectrometry (AMS) facilities. It was intended that laboratories would be able to use their standard pretreatment procedures. However, a small sample set was also prepared for radiometric laboratories.
DETAILED SAMPLE DESCRIPTIONS
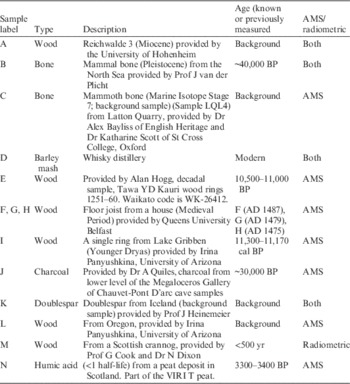
As in our previous intercomparisons, we have used natural, routinely dated materials. Several similar samples have been used in past intercomparisons (doublespar, humic acid, and barley mash). In summary, a total of 13 samples for AMS laboratories and 5 samples for radiometric laboratories, 4 of which are in common with AMS (A, B, D, and K) were sourced. Samples ranged in activity/age from modern, to a few thousand years to more than 40,000 years through to background. We included a substantial number of background samples since over the years, AMS laboratories have noted differences in background between carbonate, wood, and bone. In particular, bone background activities are often significantly greater than the others. Although these differences are relatively small, they can be important when modelling multiple dates. Details of the materials are provided in Table 1.
SIRI sample descriptions.

Results
In total, more than 70 sets of samples were distributed, and more than 40 (but fewer than 50, varying by sample) AMS laboratories reported results, and as usual, many more sample determinations were returned (frequently >70). More than 800 determinations were reported in total. Only 13 radiometric laboratories returned results, which is too small a sample for in-depth analysis. The response rate for AMS laboratories was in general very good (at ~70%), however, the radiometric laboratory response rate is much poorer than would have been expected historically, and it is certainly true that a number of laboratories considered that the samples provided were too small for routine dating and may have chosen not to submit results due to the challenging nature of the samples.
BACKGROUND SAMPLES
Our goal in introducing a series of background samples was to explore the challenging measurement regime that they provide, and to consider possible differences between the different materials (wood, carbonate, and bone). We had defined a reporting format which we hoped would allow a standardized analysis of the data to be performed; however, it quickly became very clear that the reporting conventions had not always been adhered to. This has presented some challenges for the subsequent analysis and limited the approaches we could take in both reporting and analysis of the results.
Methodological Development for Known Background Samples (No 14C Activity)
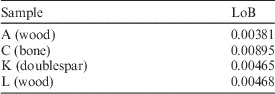
For the 4 background samples we asked laboratories to report 3 quantities: (1) Fm, the measured fraction modern with fractionation applied to both the sample and standard, but no correction for background, (2) f, the measured fraction modern of a background sample, and finally (3) F, which is Fm corrected for background. The actual format of reporting results for the 4 background samples varied considerably across the laboratories: some simply quoted an age limit, some provided F and an estimate of sigma, but not the other terms, some reported all values as requested, some reported limit of detection values, some simply quoted a value of 0. Some laboratories commented that the SIRI samples were better than their own in-house background samples (hence the issue with negative reporting). This variation reflects a variety of understandings of background samples, and the challenge laboratories face in background evaluation. As a result, our analysis of these 4 samples has had to take a different approach to that previously used (in contrast, no consensus value for these samples will be reported). In the first instance, we have focused on F since most laboratories quoted F, but we will discuss the age attributed to the samples where they were reported. For these SIRI samples, we will not report consensus values, instead we will refer to the classic Currie paper of 1968 on limits of detection and to an additional quantity, the limit of blank. There are three terms that are often used in reporting background or near background samples namely the limit of blank (LoB), limit of detection (LoD), and limit of quantitation (LoQ). Each has a specific definition and they are related to each other, and to the smallest concentration that can be reliably measured. “LoB is the highest apparent analyte concentration expected to be found when replicates of a blank sample containing no analyte are tested” (Armbruster and Pry Reference Armbruster and Pry2008). The critical level LC (Currie Reference Currie1968), is defined as kσ0, where σ0 is the standard deviation of the “blank.” The LOD is expressed as the concentration given by the sample blank value plus three standard deviations of the blank sample and LOQ is the concentration corresponding to the sample blank value plus ten standard deviations of the blank (Currie Reference Currie1968; Armbruster and Pry Reference Armbruster and Pry2008).
In its common use, the LoB is reported by an individual laboratory, and requires a sufficient number of replicate measurements (more than 10 replicates) to be estimated. For the SIRI background samples, the LoB is calculated for each sample, regarding the laboratory measurements as replicates, and using the mean and standard deviation of all the laboratory results as the sample blank value and σ0, the standard deviation of the “blank,” respectively. This latter value goes beyond the original intent of the LoB definition, but offers a relatively simple summary for the background samples, to be interpreted as the highest apparent concentration for that sample.
For the AMS data sets, for some initial summary analyses, laboratory replicates were averaged, and the standard deviations calculated as follows: if only one replicate, then the quoted error was used, if more than two replicates, the standard deviation was reported. If the replicates were identical, then the quoted error was used. Additional formal analysis made use of mixed effects models to fully quantify the within and between laboratory variability.
For the initial sample summaries, outliers have been identified by graphical inspection and using relatively simple criteria based on the interquartile range and distance from the median. A small number of such values has then been omitted judiciously (typically less than 5 in number) for a given sample. More formal analysis could be used but has not been pursued at this point. It is clear that some of the outliers removed come from the same laboratory and this will be further investigated when the laboratory performance across the suite of samples is assessed.
SAMPLE SUMMARIES
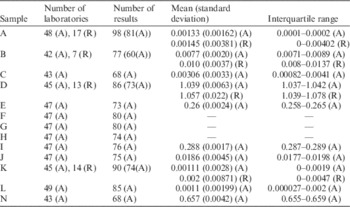
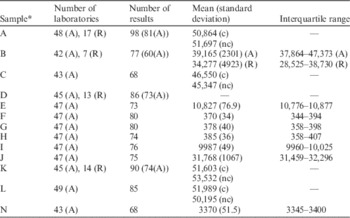
Table 2a and 2b provides an initial numerical report of the results received for all 14 samples. In the table, A stands for AMS and R for radiometric laboratories. Summaries are given for F in Table 2a, after a small number of outliers have been manually identified and removed. The number of laboratories and the number of individual determinations are given as well as the arithmetic mean and standard deviation and the interquartile range (defined as 25th percentile to 75th percentile). The interquartile range (which gives the middle 50% data range) shows some differences, especially in the upper value in the IQR for the background samples, particularly A (wood), compared to C (bone) and K (doublespar). Table 2b gives the summaries for age BP for the non-background samples in the same format. For the background samples in Table 2b, where there was a mixture of finite and “greater than” ages reported, we have simply reported the mean of the finite and “censored” ages for ease of comparison.
Summary statistics in F.

Summary statistics in age BP (c indicates ages reported as>, and nc are finite ages).

* For sample M, for radiometric laboratories only, 9 laboratories returned results with mean 2532 (153.2) BP and interquartile range 2402–2712 BP.
MORE DETAILED ANALYSIS, SUMMARY, AND CONCLUSIONS
Radiometric Laboratories
For radiometric laboratories, there was a disappointingly small number of results returned, but our initial goal had been an intercomparison for AMS facilities. Our sample sizes and materials were, in many cases, challenging, which provides a partial explanation for the poorer than usual response rate for the radiometric laboratories. For the four samples, A, B, D, and K which were also supplied to the AMS facilities, the results are in broad agreement as can be seen from Table 2a, although the variation for radiometric laboratories appears greater.
Previously Dated or Known-Age Samples
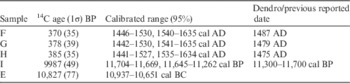
Details of the previously dated or known-age samples are given in Table 3. SIRI samples F, G, and H are three single rings, with known dendro-dates of 1487, 1479, and 1475 AD. Each has been calibrated separately in this first analysis, but clearly it will also be possible to calibrate them as a sequence, with known separation. The 95% calibrated ages for the dendro-dated single ring samples F, G, and H are 1446–1530 and 1540–1635 cal AD (F), 1442–1530 and 1541–1635 cal AD (G) and 1441–1527 and 1535–1634 cal AD (H). All three samples when calibrated have a bivariate calibrated range with the two peaks having approximately equal probability. The dendro-date for each sample is within the older of the two peaks, and the calibrated results for the three samples are almost identical.
Sample E is a Younger Dryas sample, with the mean age of 10,827 BP in good agreement with the “expected age range” of 10,500–11,000 BP. The result from calibrating the “mean” for SIRI E is 10,937–10,651 cal BC. SIRI I had been previously dated with the reported age of 11,300–11,170 cal BP. The calibration of the mean age of 9987 BP corresponds to a flat section of the calibration curve, giving the 95% calibrated range of 9754–9719 and 9695–9312 cal BC or 11,704–11,669 and 11,645–11,262 cal BP. The SIRI results are again in good agreement with the previous age.
Sample B, a mammal bone (Pleistocene) from the North Sea, was expected to be ~40,000 BP, while sample J, a charcoal sample from the Chauvet Pont D’Arc cave in France, had an expected age ~30,000 BP. Both samples have returned results which are in good agreement with expectation and previous dating.
Background Samples
Focusing only on the AMS results for the background samples, Table 2a tends to support the anecdotal reports that bone background samples give higher F values than wood or carbonate background samples. As we have already commented, these samples were difficult to analyze due to the different reporting formats used by the laboratories, but the table assists in the quantification of the variation between laboratories and among materials. Table 4 summarizes the limit of background (LoB) for each sample. An explanation for the apparent difference between bone and other background material is being researched (Naysmith et al. this issue; Dunbar et al. this issue). The LoB is not a conventional consensus value for these samples and to facilitate further analyses of these samples, we will be contacting the laboratories seeking additional information.
Consensus Values
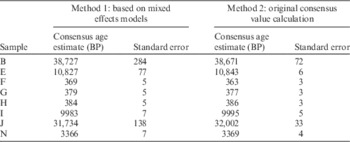
In previous studies, we have used a simple but robust method to quantify the consensus values of the samples (Scott et al. 2003), and for SIRI we have used both the previous approach but also a new one, which makes little difference to the consensus value but calculates the uncertainty on the value in a different way. The new method is based on the use of a mixed effects model, which takes appropriate account of the multiple measurements reported by a single laboratory (and no longer uses the average) and more properly evaluates the uncertainty (standard error). Further detail of this model is provided. To estimate the consensus value for each material, we use a linear mixed (or random effects) model, which attributes the total variation in F (or age) around the “true” age for the material to two components, the within-laboratory and the between-laboratory variation.
The linear mixed model has the following form:
 $${\rm Y}_{{{\rm ij}}} {\equals}{\rm \mu }{\plus}{\rm \alpha }_{{\rm i}} _{{\plus}} {\rm {\epsilon}}_{{{\rm ij}}} $$
where Yij is the age of the sample for the ith lab and jth replicate measurement for i=1,…,I and j=1,…, J where I is the number of laboratories and J is the number of replicates for that laboratory.
-
∙ μ is the overall mean or consensus age;
-
∙ α i is the random effect for the ith lab;
-
∙
 $${\rm {\epsilon}$$
ij is the experimental error associated with the samples

The random variable α
i
is identically and independently distributed as a N(0, σ2
A) variable. The errors
 $${\rm {\epsilon}$$
are also identically and independently distributed a N(0, σ2
B) random variables. It is also assumed that the effects α
i
and
 $${\rm {\epsilon}$$
ij
are mutually independent of each other. The fitted model then provides estimates of μ and the standard error, which are shown in Table 5. Table 5 gives the results for the non-background samples. Sample D is not included in the Table since it was reported as pMC. Using the same approach, it has a consensus value of 103.96 (0.1) (Method 1) and 103.98 (0.04) (Method 2). For the two close-to-background samples (B and J), results were reported with symmetric quoted errors, so that they have been dealt with in the same way.
DISCUSSION AND CONCLUSIONS
There still remains considerable work to be done with this extensive archive of radiocarbon results. This includes a further formal analysis looking at between and within variation for laboratories, a summary of individual laboratory performance, an investigation of pretreatment effects, especially for the bone samples, and further examination of the background samples. Over the years, certain samples have been used in several intercomparisons, and, the connections, through the samples that have been used in previous studies, mean that we will be able to draw inferences over time (not this simple snapshot) of performance. Some of these analyses are perhaps of more academic interest, since for many laboratories, the key output is the knowledge of their results in relation to the community derived consensus values.
Calibrated results for tree-ring samples.

Limit of background.

Consensus values.

Acknowledgments
We thank our colleagues who provided samples: Jan Heinemeier, Alex Bayliss, Hans van der Plicht, Anita Quiles, Alan Hogg, Phil Barratt (Belfast) and Irina Panyushkina (Arizona), and funding from Historic England. We also thank Paige Butterfield for help with the statistical analysis.