

1. Introduction
As internationalization continues, the ability to communicate in English is becoming increasingly important. Although private lessons are beneficial for language learning, such teaching of English is difficult at all schools, because of the cost. Recently many efforts have applied speech technologies to language learning. For instance, many Computer Assisted Language Learning (CALL) systems or Computer Assisted Pronunciation Training (CAPT) systems have been released (Kawahara & Minematsu, Reference Kawahara and Minematsu2011), some of which use speech recognition techniques (Nakagawa, Reyes, Suzuki & Taniguchi, Reference Nakagawa, Reyes, Suzuki and Taniguchi1997; Tsubota, Kawahara & Dantsuji, Reference Tsubota, Kawahara and Dantsuji2002; Eskenazi, Kennedy, Ketchum, Olszewski & Pelton, Reference Eskenazi, Kennedy, Ketchum, Olszewski and Pelton2007). CAPT is a crucial component of CALL that focuses on evaluating pronunciation proficiency or correcting pronunciation errors.
The authors have developed a stressed syllable detector and an accentuation-habit estimator, where the estimated habits of individual learners accorded well with their English pronunciation proficiency and intelligibility rated by English teachers (Fujisawa, Minematsu & Nakagawa, Reference Fujisawa, Minematsu and Nakagawa1998; Nakamura, Nakagawa & Mori, Reference Nakamura, Nakagawa and Mori2004). In this paper, we propose extended pronunciation proficiency/intelligibility estimation methods using an online system developed by the authors. This enabled us to evaluate the learning effect in pronunciation proficiency and showed improvement in the intelligibility of learners’ utterances.
1.1. Three approaches to pronunciation assistance
Computer assisted pronunciation training (CAPT) has a compelling motivational effect (Stenson, Downing, J. Smith & K. Smith, Reference Stenson, Downing, Smith and Smith1992). Aist (Reference Aist1999) classified pronunciation assistance into three general approaches. The first approach is to use a program that analyzes a learner’s utterance to extract acoustic features such as intonation (or pitch contour), loudness and spectrogram and then displays these features visually along with the teacher’s (or reference’s) features (visual feedback approach). The second approach is to compare a learner’s utterance with a template or reference recorded by a native speaker and then to automatically score the pronunciation (template based approach). The third approach is to evaluate a learner’s utterance by using statistical models trained by many native speakers (model-based approach).
Our approach adopts the model-based approach.
1.2. Related research on model-based CAPT
Many researchers have studied automatic methods of evaluating pronunciation proficiency. Neumeyer, Franco, Weintraub and Price (Reference Neumeyer, Franco, Weintraub and Price1996) proposed an automatic text-independent pronunciation scoring method that uses Hidden Markov Model (HMM) log-likelihood scores (see Appendix), segment classification error scores, segment duration scores, and syllabic timing scores for French. The evaluation by segment duration outperformed others. Ronen, Neumeyer and Franco (Reference Ronen, Neumeyer and Franco1997), who investigated evaluation measures based on HMM-based phone log-posterior probability scores and the combination of the above scores proposed the log-likelihood ratio scores of native acoustic models to non-native acoustic models and found that this measure outperformed the above posterior probability (Ramos, Franco, Neumeyer & Bratt, Reference Ramos, Franco, Neumeyer and Bratt1999). We also investigated posterior probability as an evaluation measure for Japanese (Nakagawa, Reyes, Suzuki & Taniguchi, Reference Nakagawa, Reyes, Suzuki and Taniguchi1997). Cucchiarini, Strik and Bovels (Reference Cucchiarini, Strik and Bovels2000) compared the acoustic scores by TD (total duration of speech plus pauses), ROS (rate of speech; total number of segments/TD), LR (a likelihood ratio; corresponding to the posterior probability) and showed that TD and ROS were more strongly correlated with the human ratings than LR. Neri, Cucchiarini and Strik (Reference Neri, Cucchiarini and Strik2008) compared three systems: an ASR-based CAPT system with automatic feedback, a CAPT system without feedback, and no CAPT system, and showed the effectiveness of computer-based speech corrective feedback. Wang and Lee (Reference Wang and Lee2012) integrated Error Pattern (EP)-based with Goodness-of-Pronunciation (GOP) -based mispronunciation detectors (Witt & Young, Reference Witt and Young1999) in a serial structure to improve a mispronunciation detection system.
Koniaris and Engwall (Reference Koniaris and Engwall2011) described a general method that quantitatively measures the perceptual differences between a group of native speakers and many different kinds of non-native speakers; their system was verified by the theoretical findings in literature obtained from linguistic studies. To evaluate phoneme pronunciation, Yoon, Hasegawa-Johnson and Sproat (Reference Yoon, Hasegawa-Johnson and Sproat2009) utilized a Support Vector Machine (SVM) using Perceptual Linear Predictive (PLP) features and formant information as acoustic feature parameters. To automatically detect mispronounced phonemes, Li, Wang, Liang, Huang and Xu (Reference Li, Wang, Liang, Huang and Xu2009) combined three methods: Neural Network (NN) & MLP-NN using TempoRAl Patterns (TRAP) features, SVM, and Gaussian Mixture Model (GMM). Smit and Kurimo (Reference Smit and Kurimo2011) recognized individual accent utterances using stacked transformations. For the speech recognition of non-native speakers, linear or nonlinear transformations are usually input to HMM-based acoustic models (Karafiat, Janda, Cernocky & Burget, Reference Karafiat, Janda, Cernocky and Burget2012).
The above studies were evaluated for European languages or English uttered by European non-native speakers. Wu, Su and Liu (Reference Wu, Su and Liu2012) presented an efficient approach to detecting personalized mispronunciation in Taiwanese-accented English. Holliday, Beckman and Mays (Reference Holliday, Beckman and Mays2010), who focused on fricative sounds like shu whose pronunciation is difficult for non-native speakers, distinguished between English and Japanese speakers. In contrast, we evaluated the Japanese spoken by foreign students (Ohta & Nakagawa, Reference Ohta and Nakagawa2005). For non-Japanese, pronouncing the chocked sound and longer vowels of Japanese is very difficult. On the other hand, for Japanese, pronouncing consecutive consonants and discriminating between similar phonemes in English is very difficult, (e.g., “strike,” “ l and r” and “b and v”). These difficulties are caused by the differences in phonotactic structure and phoneme system between Japanese and English.
1.3. Our approach
In contrast with the above research studies, this paper focuses on the following points: (a) the target utterance is “presentation/spontaneous speech” at an international conference rather than “read speech” for given sentences; (b) the system estimates both pronunciation and intelligibility scores; (c) we transferred offline techniques to the online system; and (d) we introduced new acoustic/linguistic features to estimate pronunciation and intelligibility scores. We proposed a statistical method for estimating the pronunciation and intelligibility scores of presentations given in English by Japanese speakers (Nakagawa & Ohta, Reference Nakagawa and Ohta2007; Hirabayashi & Nakagawa, Reference Hirabayashi and Nakagawa2010; Kibishi & Nakagawa, Reference Kibishi and Nakagawa2011). Then we investigated the relationship between two scores (pronunciation proficiency and intelligibility) rated by native English teachers and various measures used to estimate a score. To the best of our knowledge, the automatic estimation of intelligibility has not yet been studied except for the intelligibility of dysarthric speech (Falk, Chan & Shein, Reference Falk, Chan and Shein2012). Furthermore, we developed an online real-time score estimation system, evaluated the system’s interface, and showed its effectiveness for learning pronunciation. Finally, we show that certain combinations of acoustic measures can predict pronunciation and intelligibility scores with almost the same ability as English teachers.
2. System overview
In this paper, we propose a statistical method that evaluates pronunciation proficiency for presentations in English. We calculated acoustic and linguistic measures from presentations given during lectures and combined these measures by a linear regression model to estimate both scores. Figure 1 shows a block diagram of our evaluation system for pronunciation and intelligibility scores.
Block diagram of our estimation system for pronunciation and intelligibility scores

First, our system extracts the following phonetic/prosodic features from speaker utterances: Mel-Frequency-Cepstrum Coefficient (MFCC, which corresponds to the spectrogram envelope), F0, Power, and ROS. F0, Power, and ROS are directly used as prosodic features in score estimation. Next, using MFCC, it calculates many kinds of acoustic/linguistic measures as clues to estimate scores. For phoneme/word recognition, three types of HMMs are used for various likelihood calculations, and SVM is used in phoneme-pair discrimination. Then these measures are used in score estimation with F0, Power, and ROS and combined with multiple linear regression to estimate the scores. This statistical method is explained in Section 6, and the automatic speech-recognition method using HMM is explained in the Appendix.
3. Database
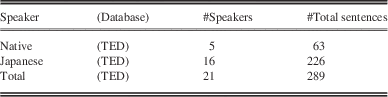
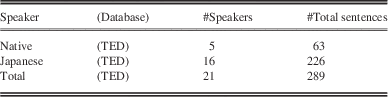
We used the Translanguage English Database (TED), which was presented at the International Conference on EuroSpeech, for the evaluation test data (Nakagawa & Ohta, Reference Nakagawa and Ohta2007; Hirabayashi & Nakagawa, Reference Hirabayashi and Nakagawa2010; Kibishi & Nakagawa, Reference Kibishi and Nakagawa2011). Only part of TED is comprised of texts transcribed by a native speaker (not the speaker himself); the rest contains raw data. This set consists of 289 English sentences in presentations spoken by 21 male speakers, which are rated at three skill levels of pronunciation proficiency: above average, average, or below average. Sixteen of the 21 are Japanese speakers, and the remaining five are native English speakers from the USA.
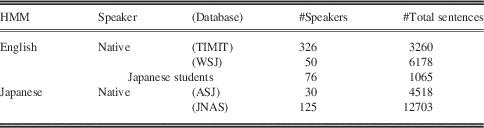
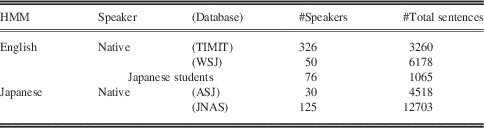
We used the TIMIT (Garofolo, Lamel, Fisher, Fiscus, Pallett, Dahlgren & Zue, Reference Garofolo, Lamel, Fisher, Fiscus, Pallett, Dahlgren and Zue1993)/WSJ (Garofalo, Graff, Paul & Pallett, Reference Garofalo, Graff and Pallett2007) database for training the native English phoneme HMMs, which is another Japanese speech database for adapting non-native English phoneme HMMs (Nakagawa, Reyes, Suzuki, Reyes & Taniguchi, Reference Nakagawa, Reyes, Suzuki, Reyes, Allen and Taniguchi1997, in Japanese), and the ASJ (Kobayashi, Itahashi, Hayamizu & Takezawa, Reference Kobayashi, Itahashi, Hayamizu and Takezawa1992, in Japanese)/JNAS (Itou, Yamamoto, Takeda, Takezawa, Matsuoka, Kobayashi & Shikano, Reference Itou, Yamamoto, Takeda, Takezawa, Matsuoka, Kobayashi and Shikano1999) database for training the native Japanese syllable HMMs (strictly speaking, mora-unit HMMs).
Tables 1 and 2 summarize the speech materials.
Speech material training data for HMM
Test data
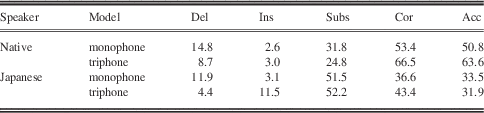
Franco, Neumeyer, Kim and Ronen (Reference Franco, Neumeyer, Kim and Ronen1997) found that for the pronunciation evaluation of non-native English speakers, a triphone model performs worse than a monophone model if the HMMs are trained by native speech; less detailed (native) models perform better for non-native speakers (Franco et al., Reference Franco, Neumeyer, Kim and Ronen1997; Young & Witt, Reference Young and Witt1999; Zhao & He, Reference Zhao and He2001). We also confirmed this fact. A triphone model improved the performance for native speakers more than a monophone model, but not for Japanese speakers (see Table 3), because of the influence of Japanese phonotactics. Japanese cannot correctly pronounce consecutive syllable sequences, so a context-sensitive tri-phone model affects the recognition of English uttered by Japanese.
English phoneme recognition result using monophone and triphone model trained for native data [%]
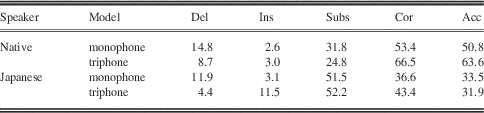
For example, the accuracy for native speakers using triphone models was 64.4% and 50.2% with the monophone models; for Japanese, the accuracy was 30.8% for the triphone models and 33.5% for monophone models.
4. Definition of estimating scores
In this paper, we defined two kinds of scores, pronunciation score and intelligibility, and calculated/estimated them using an automatic evaluation system.
4.1. Pronunciation score
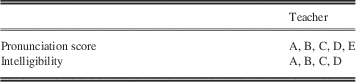
The pronunciation score used in this paper is the average of two scores: a phonetic pronunciation score and a prosody (rhythm, accent, intonation) score. This score was assessed for each of 289 sentences by five native English teachers who ranked each utterance on a scale of 1 (poor) to 5 (excellent).
4.2. Intelligibility score
Typically, the physical measure that is highly correlated with speech intelligibility is called the Speech Intelligibility Index (SII) (Acoustical Society of America SII). SII is calculated from the acoustical measurements of speech and noise/reverberation. In contrast, the intelligibility that we used in this paper is defined as how well the pronunciation of utterances by non-natives is recognized or perceived by native English teachers.
The test data were assessed by four of the above five native English teachers for all 289 sentences and the intelligibility was calculated. The teachers transcribed each sentence by listening to all test data while scoring each speaker. The transcription by one native speaker was not used because it was unreliable. Four transcriptions from the same sentence by English teachers were compared, and if two or more English teachers transcribed the same word, we determined it to be an uttered word and called it man2/4. Once man2/4s for all utterances were extracted, the intelligibility (the correctly transcribed rate) was calculated:
 $$Intelligibility={\raise0.7ex\hbox{$A$} \!\mathord{\left/ {\vphantom {A B}}\right.\kern-\nulldelimiterspace}\!\lower0.7ex\hbox{$B$}},$$
where A represents the number of words in man2/4 and B represents the total number of words in the target sentences. We show two examples below, where the underlined words denote man2/4.
Example of transcription:
Teacher 1: andtoworkrobustlysince it’s spontaneousinputandalsoobviouslybecausespeechrecognitionisnotperfectyet
Teacher 2: andtoworkrobustlysince it spontaneousinputandalsoobviouslybecausespeechrecognition isn’t perfect
Teacher 3: andtoworkrobustlysinceitsspontaneousinputandalsoobviouslybecausespeechrecognitionisnotperfectyet
Teacher 4: andtoworkrobustlyandsinceits spontaneously inputand since speechrecognitionisnotperfect
man2/4: andtoworkrobustlysinceitsspontaneousinputandalsoobviouslybecausespeechrecognitionisnotperfectyet
 $$Intelligibility={A \over B}={{18} \over {19.75}}=0.911$$
Teacher 1: andthenwe uh estimatethe @ parametersautomaticallyfromthesequence
Teacher 2: andthenweestimatethe @ parametersautomaticallyfromthesequence
Teacher 3: andthenweestimatethe armor @ automaticallyfromthesequence
Teacher 4: andthenweestimatetheARMAparametersautomaticallyfromthesequence
man2/4: andthenweestimatethe ¥ parametersautomaticallyfromthesequence
 $$Intelligibility={A \over B}={{10} \over {11.5}}=0.902$$
Here, the mark “@” denotes a word/phrase by the speaker that the teacher heard without understanding it completely, and “¥” denotes that a word is present. However, because we did not have correct transcriptions of the test data from the speakers themselves, we could not obtain the exact number of words in the sentences. Consequently, we assumed that the total number of words in a sentence is the sum of the words transcribed as man2/4 in the sentence and the average number of transcribed words that are not included in the man2/4 figures from the same sentence: in other words, the average number of transcribed words.
4.3. Scoring by English teachers
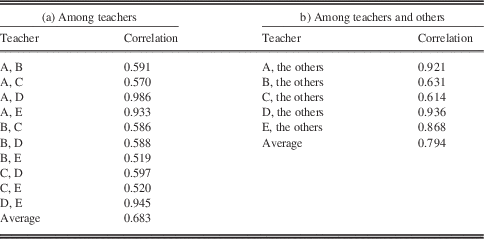
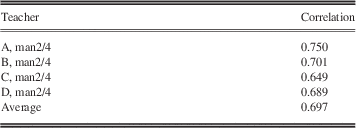
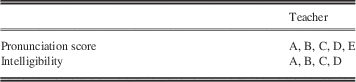
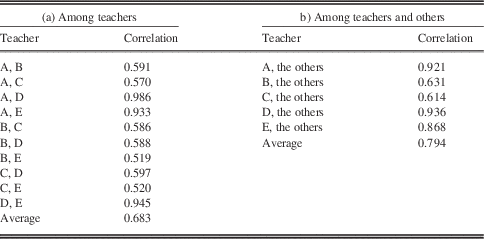
All five teachers scored pronunciation, and four of them transcribed and calculated intelligibility. Table 4 shows the set of teachers who scored pronunciation proficiency and/or intelligibility. Tables 5 and 6 summarize the correlation coefficients between each English teacher’s pronunciation and intelligibility scores, where “A and the others” means the correlation between the score of A and the average score of {B, C, D, E}.
Set of teachers for pronunciation score and intelligibility
Correlation coefficient of inter-teacher pronunciation scores
Correlation of inter-teacher intelligibility scores: based on man2/4
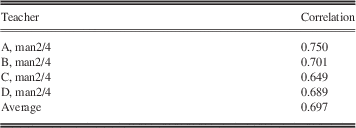
We can determine from Tables 5 and 6 that the target of our automatic evaluation for the correlation between the human’s score and an automatically evaluated score is 0.683~0.794 and 0.697, respectively, to develop an automatic evaluation system with the same ability as human experts. Figure 2 shows the relationship between intelligibility and pronunciation scores rated by native English teachers, where this correlation was found to be 0.717. This evaluation was performed using a presentation’s utterances having a duration of two minutes. Speakers with high pronunciation scores have high intelligibility, i.e., the higher the pronunciation score is, the more the person can correctly comprehend the speaker’s utterances.
Relationship of intelligibility and teacher pronunciation scores (for utterances having a duration of about two minutes); USA means native English speakers and JPN means Japanese English speakers
5. Definition of measures and evaluation
As described in Section 4. 3, since English teachers evaluated the pronunciation and intelligibility scores (or transcription) for a set of utterances, we assumed for convenience that the human score for the set of sentences in two minutes was the same score for every sentence in the set. We previously proposed effective acoustic features (Nakamura, Nakagawa & Mori, Reference Nakamura, Nakagawa and Mori2004; Ohta & Nakagawa, Reference Ohta and Nakagawa2005). In this paper, we added new features to estimate the pronunciation and intelligibility scores. Although the previous work (Nakagawa & Ohta, Reference Nakagawa and Ohta2007) used read-sentence utterances as test sets, this work used presentation (spontaneous) utterances in English. The terminology of log-likelihood and posterior probability using HMM is defined in Appendix A.
5.1. Acoustic measures
(A) Log-likelihood using native and non-native English HMMs and the learner’snative language HMM (Nakamura, Nakagawa & Mori, Reference Nakamura, Nakagawa and Mori2004)
We calculated the correlation rate between the averaged English teacher scores and the log-likelihood (LL) for a pronunciation dictionary sequence based on the concatenation of phone HMMs at the 1-sentence level. The likelihood was normalized by length in the frames. We used native English phoneme HMMs ( $$LL_{{native}} $$
), non-native English phoneme HMMs that are adapted by Japanese utterances (
 $$LL_{{non{\minus}native}} $$
), and native Japanese syllable HMMs (
 $$LL_{{mother}} $$
).
(B) Best log-likelihood for arbitrary phoneme sequences (Nakamura, Nakagawa & Mori, Reference Nakamura, Nakagawa and Mori2004)
The best log-likelihood for arbitrary phoneme sequences is defined as the likelihood of free phoneme (syllable) recognition without using phonotactic language models. We used native English phoneme HMMs ( $$LL_{{best}} $$
).
(C) Likelihood ratio (Nakamura, Nakagawa & Mori, Reference Nakamura, Nakagawa and Mori2004)
We used the likelihood ratio (LR) between native English HMMs and non-native English HMMs, which were defined as the difference between the two log-likelihoods:  $$LR=LL_{{native}} {\minus}LL_{{non{\minus}native}} $$
.
Figure 3 illustrates the Gaussian distributions for native English HMMs and non-native English HMMs/Japanese HMMs. Note that the likelihood is associated with the inverse of distance. A denotes a sample from a typical native English speaker, B denotes a sample from an outlying native English speaker and C denotes a Japanese utterance sample from a non-native speaker. Even if a native English speaker utters his/her mother language, the likelihood, using native English HMMs, is distributed widely from a high to a low value. Therefore, absolute value  $$LL_{{native}} $$
is not suitable for outlying speakers. However, the difference in the likelihoods between
 $$LL_{{native}} {\minus}LL_{{non{\minus}native}} $$
or
 $$LL_{{native}} {\minus}LL_{{mother}} $$
compensates/normalizes this phenomenon. In Figure 3,
 $$LL_{{native}} $$
for samples B and C is almost similar. On the other hand,
 $$LL_{{native}} {\minus}LL_{{non{\minus}native}} $$
for B is larger than that for C, and B is considered a better English utterance sample than C. We assume that this measure has a speaker normalization function as well as a similar effect of Vocal Tract Length Normalization (VTLN); in other words, it is a mother-language-independent English evaluation measure.
Illustration of Gaussian distributions corresponding to native HMMs and non-native HMMs/native Japanese HMMs; A: typical native sample; B: outlying native sample; C: non-native Japanese utterance sample
(D) Posterior probability (Nakamura, Nakagawa & Mori, Reference Nakamura, Nakagawa and Mori2004)
We used the likelihood ratio (LR′) between the log-likelihood of native English HMMs ( $$LL_{{native}} $$
) and the best log-likelihood for arbitrary phoneme sequences (
 $$LL_{{best}} $$
), which means the logarithm of posterior probability:
 $$LR'=LL_{{native}} {\minus}LL_{{best}} $$
(Nakagawa, Reyes, Suzuki & Taniguchi, Reference Nakagawa, Reyes, Suzuki and Taniguchi1997, in Japanese; Nakagawa, Reyes, Suzuki & Taniguchi, Reference Nakagawa, Reyes, Suzuki and Taniguchi1997).
(E) Likelihood ratio for phoneme recognition (Nakamura, Nakagawa & Mori, Reference Nakamura, Nakagawa and Mori2004)
We used the ratio of the likelihood of free phoneme recognition between native and non-native English HMMs ( $$LR_{{adap}} $$
), which were defined as the difference between the two log-likelihoods:
 $$LR_{{adap}} =LL_{{best\_native}} {\minus}LL_{{best\_non{\minus}native}} $$
.
We also used the ratio of the likelihood of the free phoneme (syllable) recognition between native English and native Japanese HMMs ( $$LL_{{mother}} $$
), which were defined as the difference between the two log-likelihoods:
 $$LL_{{mother}} =LL_{{best\_native}} {\minus}LL_{{best\_mother}} $$
.
(F) Phoneme recognition result (Nakamura, Nakagawa & Mori, Reference Nakamura, Nakagawa and Mori2004)
We used the results of the free phoneme recognition. The test data were restricted to the correctly transcribed parts based on man2/4, because this measure requires correct transcription of utterances.
(G) Word recognition result
We used the correct rate of word recognition with a language model called Large Vocabulary Conversational Speech Recognition (LVCSR). We used the WSJ database (WSJ) or Eurospeech ’93 paper (EURO) for training the bigram language models (Ohta & Nakagawa, Reference Ohta and Nakagawa2005). This measure also requires the correct transcription of utterances.
(H) Standard deviation of powers and pitch frequencies
The standard deviations of powers (Power) and fundamental (Pitch) frequencies (FO) are calculated for every utterance.
(I) Rate of speech
We used the rate of speech (ROS) of the sentence. Silences in an utterance were removed. We calculated the ROS of each sentence as the number of phonemes divided by the duration in seconds.
(J) Perplexity and entropy
Perplexity can be used to evaluate the complexity of an utterance. This measure corresponds to the average number of words that can appear in a given left context. We used WSJ and Eurospeech ’93 papers (EURO) for training the bigram language models (Nakagawa & Ohta, Reference Nakagawa and Ohta2007). Entropy H and perplexity PP can be calculated for word sequence  $$w_{1} w_{2} \cdots w_{{n{\minus}1}} w_{n} $$
in a test set, where the word in an out-of-vocabulary (OOV) is classified as an UNKNOWN word (Hirabayashi & Nakagawa, Reference Hirabayashi and Nakagawa2010):
 $$H={\minus}{\textstyle{1 \over n}}\log _{2} P\left( {w_{1} w_{2} \cdots w_{{n{\minus}1}} w_{n} } \right)$$
 $$PP=2^{H} $$
Cases of out-of-vocabulary and adjusted perplexity can be calculated:
 $$APP=\left( {P\left( {w_{1} w_{2} \cdots w_{{n{\minus}1}} w_{n} } \right)m{}^{{n\mu }}} \right)^{{{1 \over n}}} ,$$
where n μ represents the number of out-of-vocabulary words, and m represents the number of out-of-vocabulary items in a test set.
(K) Spectrum changing rate
Since a native speaker’s English utterances are spontaneous, the spectrum’s changing rate may vary rapidly. It can be calculated:
 $$d\left( {x\left( t \right),x\left( {t{\minus}1} \right)} \right)=\sqrt {\sum_{{i=1}}^{n} \left( {x_{i} \left( t \right){\minus}x,\left( {t{\minus}1} \right)} \right).} $$
We examined the Euclid distance between the adjacent frames of the calculated MFCC and used the standard variation and variance, where i represents the i-th index, x i(t) represents the MFCC of the i-th dimension at the t-th frame, and  $x_{i} \left( {t{\minus}1} \right)$
represents the MFCC in the previous frame of the i-th dimension.
(L) Phoneme-pair discrimination score
Using SVM, we identified and discriminated between the following nine pairs of phonemes that are often mispronounced by Japanese native speakers: /l and r/, /m and n/, /s and sh/, /s and th/, /b and v/, /b and d/, /z and dh/, /z and d/ and /dh and d/ (ATR Institute of Human Information, 2000, ATR Institute of Human Information, 1999).
The SVM input data are comprised of fixed length frames, that is, five consecutive frames beginning from the -2 frame of the central frame of the phoneme segment. The features are MFCC and ∆ MFCC.
The phoneme-pair discrimination score is a value that reflects a quantized distinction rate from 1 (poor) to 4 (excellent) for every sentence. Each sentence includes an average of 37 phoneme pairs.
5.2. Correlation between acoustic measure and the teacher’s score
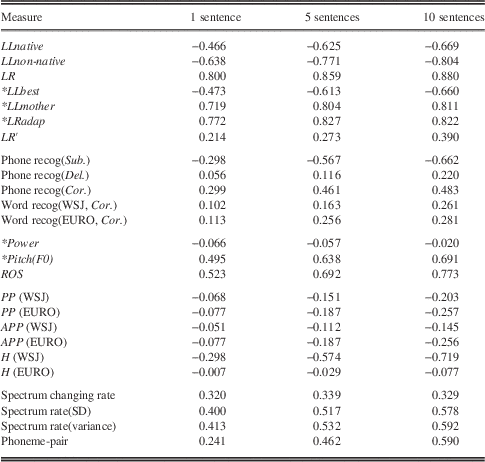
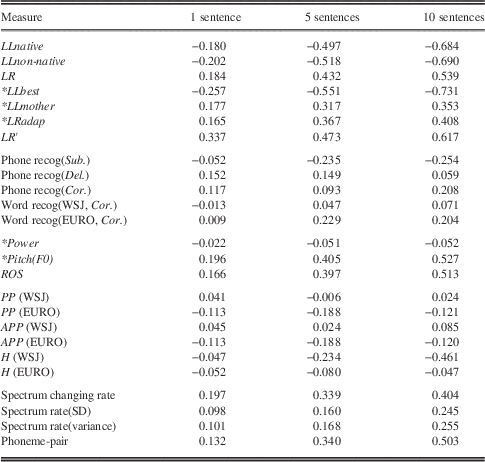
Tables 7 and 8 summarize the correlation between each acoustic or linguistic measure for every sentence and their averaged English teacher scores.
Correlation between acoustic/linguistic measures and pronunciation score
*Represents features calculated without correct transcription.
Correlation between acoustic/linguistic measures and intelligibility
*Represents features calculated without correct transcription.
The number of sentences of each speaker was not constant. Additionally, to keep as many samples as possible, we computed a 5- and 10-sentence level as the following example; to compute a 5-sentence level, we averaged the first 5 sentences’ acoustic/linguistic measure values and averaged from the 2nd to the 6th sentence and so on to build a new averaged list. The correlation between each acoustic measure and human’s score is shown in Tables 7 and 8.
Fairly high correlations are evident from Tables 7 and 8 for most of the likelihood measures (ex. LL non-native, LR, LL mother, LR adap). The correlations between the intelligibility and acoustic/linguistic measures given in Table 8 improved considerably at levels with more than five sentences. These results show that utterances with more than five sentences are necessary to estimate intelligibility and the automatic word recognition performance is only slightly related to intelligibility. The correlation between intelligibility and  $$LL_{{best}} $$
gives the highest negative correlations: −0.551 and −0.731 at 5- and 10-sentence levels. Concerning perplexity, we expected that a speaker with good pronunciation might utter a complicated sentence and unfamiliar words for which a positive correlative value would be observed, but the results showed a negative value. This result indicates that pronunciation and intelligibility scores worsen when a speaker utters a complicated sentence and unfamiliar words.
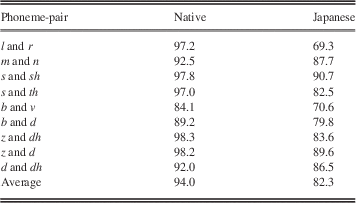
Table 9 shows the phoneme-pair discrimination result.
English phoneme-pair discrimination result using SVM [%]
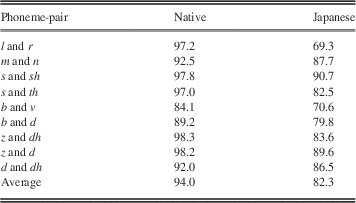
The average correct discriminative rates of native English and Japanese English speakers using SVM were 94.0% and 82.3%. Among the nine phoneme-pairs, the pronunciation of /l and r/, /s and th/, /b and v/, /b and d/ and /z and dh/ was especially difficult for Japanese speakers in comparison with native speakers who can correctly pronounce them. Using these discrimination results, we can evaluate Japanese English pronunciation for individual phonemes.
The mark “*” represents a feature that is calculated without correct transcription. For the pronunciation scores, LL best, LL mother, and LR adap, which are calculated using the likelihood rate, have high correlation. Both Pitch(F0) and the spectrum rate capture accent in English and have good correlation. ROS is also high. Comparing Tables 7 and 8, the correlation of intelligibility for all features except for LR’ was lower than that of pronunciation, because we used man2/4 as the correct transcription, but it might be unstable.
6. Statistical method for evaluating each score and result (Nakamura, Nakagawa & Mori, Reference Nakamura, Nakagawa and Mori2004)
For estimating the pronunciation and intelligibility scores, we proposed a linear regression model that was derived from the relationship between acoustic/linguistic measures and the scores of the English teachers. We established independent variables {x i} for the parameters and value Y for each English teacher’s score and defined the linear regression model as:
 $$Y=\sum_{i} \left( {a_{i} {\times}x_{i} } \right){\plus}{\varepsilon},$$
where ε is a residue (Ohta & Nakagawa, Reference Ohta and Nakagawa2005). The coefficients {a i} are determined by minimizing the square of ε. Next, we experimented with open data for speakers by investigating whether our proposed method is independent of the speaker. In an open experiment with the speakers, we estimated the regression model using the utterances of 20 of the 21 speakers (the remaining speaker’s score was estimated) at all 1-, 5- and 10-sentence levels. We repeated this experiment for each speaker.
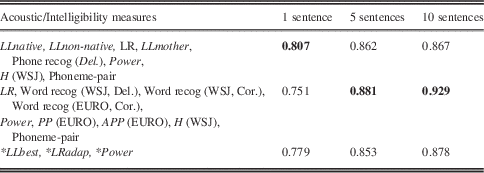
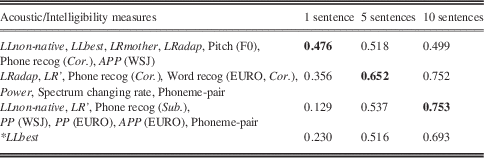
Tables 10 and 11 summarize the evaluation results of the pronunciation and intelligibility scores obtained at the levels of 1-, 5-, and 10-sentences for the open data, which means that for each speaker the test set is different from the training set. Here, boldface text denotes the best value from among the many combinations of feature parameters for every set of 1-, 5- and 10-sentences.
Correlation between combination of acoustic/linguistic measures and pronunciation score rated by humans
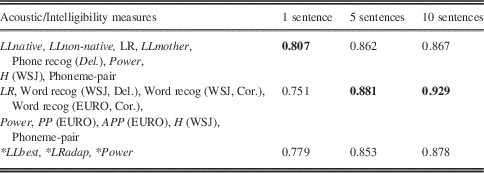
Boldface denotes best value. Last row denotes result with only features calculated without correct transcription.
Correlation between combination of acoustic/linguistic measures and intelligibility rated by humans
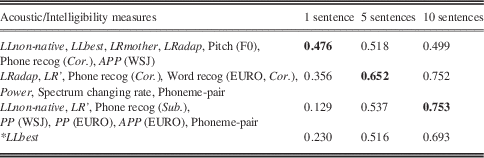
Boldface denotes best value. Last row denotes result with only features calculated without correct transcription.
By combining certain acoustic/linguistic measures, we obtained correlation coefficients of 0.929 and 0.753 for the pronunciation and intelligibility scores using open data with each speaker at the 10-sentence levels. If we only use the features calculated without correct transcription, the correlation becomes 0.878 and 0.693 for the pronunciation and intelligibility scores showing that we can get sufficient performance for any utterance in comparison with native English teachers (Tables 5 and 6).
Figure 4 illustrates the relationship between the estimated pronunciation score/intelligibility and that of the English teachers based on the open data for a set of 10-sentence levels.
Relationship between estimated and teacher scores (ten sentences). (a) Pronunciation score; (b) Intelligibility score
These results confirm that our proposed method for automatic estimation of pronunciation and intelligibility scores has approximately the same effectiveness as actual evaluations performed by English teachers.
7. Real-time estimation system
We designed an online real-time system based on the above method to learn English pronunciation. Since language/pronunciation learning that requires human intervention is expensive and time/space dependent, a Computer Assisted Language Learning system (CALL) is eagerly anticipated by second language learners.
We experimentally investigated whether it is possible to obtain the same performance in real-time both online and offline.
7.1. Description of online real-time system
We designed a real-time system for estimating the pronunciation and intelligibility scores in our laboratory for English pronunciation learning. We calculated the measures of the acoustic features in real-time to show the scores soon after a speaker finishes reading a specific sentence. Our real-time pronunciation and intelligibility scores estimation system consists of a front-end, an intermediate server, two word recognition servers, two likelihood calculation servers, and three phoneme recognition servers (Figure 5). All servers were connected by a network to exchange data to obtain pronunciation and intelligibility scores in real-time. The front-end runs under a Windows operating system while all other programs run under Linux.
Configuration of the execution of the system
Although the word recognition server already had its own protocol for online real-time word recognition, we did not use it for score estimation since the word recognition speed was too slow for real-time estimation. All other servers finished their calculations at the same time as the speaker finished reading.
We normalized the feature parameter Mel Frequency Cepstrum Coefficient (MFCC) by the following equation to normalize the environmental condition in the recording and the speaker’s differences:
 $$\overline{{MFCC\left( i \right)}} ={{MFCC_{0} {\times}\beta {\plus}MFCC_{{total}} \left( {i{\minus}1} \right){\plus}MFCC\left( i \right)} \over {\beta {\plus}i}}$$
where i represents the current frame of an utterance, β represents the weight of MFCC 0 (set to 50), MTCCtotal(i−1) represents the total MFCC from the first frame to frame, and MFCC 0 is an initial value of the standard MFCC average, which is obtained by processing 24 minutes’ worth of read passage recordings by eight members in our laboratory and 24 minutes worth of recordings by 16 individuals from the “English Speech Database Read by Japanese Students” (ERJ) (see Minematsu, Tomiyama, Yoshimoto, Shimizu, Nakagawa, Dantsuji & Makino, Reference Minematsu, Tomiyama, Yoshimoto, Shimizu, Nakagawa, Dantsuji and Makino2002) recorded in quiet rooms.
Figure 6 depicts the front-end interface, where the “legend box” is not displayed. These are English translations of Japanese captions for readers. The following are the system’s outputs: (a) pronunciation score, (b) intelligibility score, (c) pitch/power wave, (d) phoneme-pair recognition result, where blue denotes a well-pronounced word, yellow denotes an ambiguous one, red denotes a badly pronounced one, and green denotes an inserted vowel error between consonants (in Japanese, there is no phonotactics of consecutive consonants), (e) sounds of native speakers or users, and (f) articulation display of confusable consonants.
Illustration of system execution
7.2. Conditions
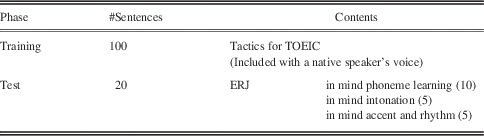
We carried out an experiment with eight male Japanese students at our university to examine how our proposed system affects the learning of English pronunciation (Kibishi & Nakagawa, Reference Kibishi and Nakagawa2011). The eight students participated in the experiment as volunteers, but we paid them an allowance of 1,000 Yen/hour. The English ability of these students was not high, so they were not proficient in English conversation. The learning period lasted for about three weeks, 20 minutes per day, five times per week: fifteen learning sessions. To evaluate the system’s effectiveness, evaluation test data were recorded before the experiment (pre), after ten learning intervals (mid), and again after 15 learning intervals (post). Table 12 gives the details of the read sentence set.
Contents of read sentences
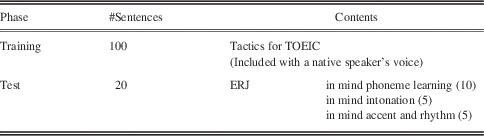
Table 13 summarizes the test data set for our on-line learning evaluation. The regression coefficient value was determined from Table 2 using all 21 speakers.
Training and test data for on-line evaluation

For the learning process, a training set of 100 sentences was prepared from the Tactics for Test of English for International Communication (TOEIC) (Grant, Reference Grant2008). The sentences in this learning set were spoken by a native speaker, so the system presented a native voice to users. In addition, subjects learned the system’s basic operation, so that at the time of learning they could easily use it. The test was performed three times with different sets, each consisting of 20 sentences from the training set. We used the same sentences for all three test iterations. The 20 sentences were selected from ERJ while taking three factors into consideration: pronunciation of phonemes (10 sentences), intonation (5 sentences), and rhythm (5 sentences) as shown in the following examples.
Examples of ERJ:
∙ Irish youngsters eat fresh kippers for breakfast.
∙ He told me that there was an accident.
∙ Legumes are a good source of vitamins.
For each of the 480 test sentences (eight learners×three times×20 sentences), we obtained scores focusing on phoneme pronunciation, fluency, and prosody by six native English teachers (F, G, H, I, J, K).
7.3. Evaluation result
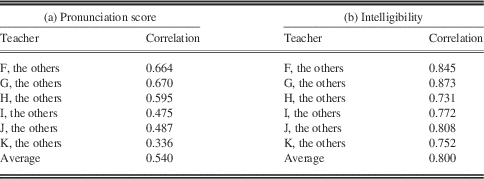
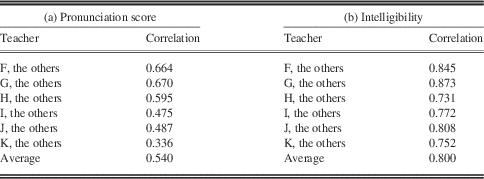
Table 14 shows that the correlation between the score for one native speaker and the average score of the others is moderately high, but not high enough. However, intelligibility’s correlation is high. These correlations show large differences between Tables 5 and 6 and Table 14, because of the different spontaneous speech (off-line) vs. read speech (on-line), a special field content (including unfamiliar words, off-line) vs. a general field content (on-line), and speakers having better English skill (off-line) vs. speakers having standard English skill (on-line).
Correlation coefficient between one native teacher’s pronunciation score/intelligibility and average score of others
Regarding intelligibility, the teachers transcribed 48 user utterances (eight learners×three times×two sentences), which are selected randomly from the training set. Users uttered sentences prepared a priori. Let the number of words in the read sentence be A and the number of words correctly transcribed be B. Intelligibility is calculated as  ${A \over B}$
(see Section 4.2).
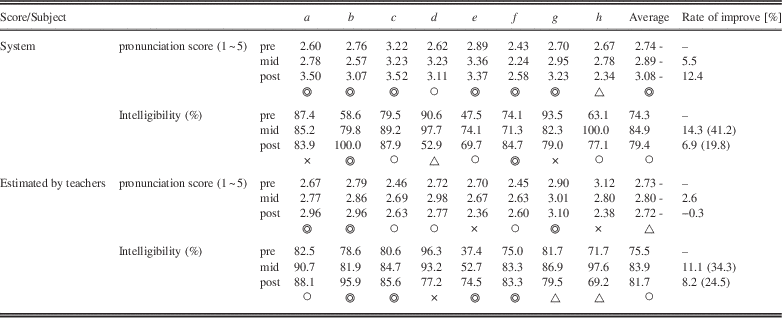
Table 15 gives the experimental results of our online system experiment. Here, the “◎” mark denotes that the post-test achieves the best score of the three tests, “○” denotes that the post-test relatively outperforms the pre- and mid-tests, “∆” denotes that the pre-test is comparable with the post- and mid-tests, and “×” denotes that the pre-test achieves the best score among the three tests. In this result, intelligibility score is different from that of the test set (Kibishi, Hirabayashi & Nakagawa, Reference Kibishi, Hirabayashi and Nakagawa2012, in Japanese), so the score is a little low. We used the (badly pronounced comparatively) utterances in pronunciation practice, because we needed many independent utterances to be transcribed by native teachers. The subject “h” has strong Kansai dialect, therefore his performance was different from other subjects.
Scores of system (estimated score) and native teacher for every test
The values in parentheses denote the mis-perception reduction rate.
We defined the rate of improvement as (difference in score of mid-test or post-test and pre-test)/(score of pre-test). For almost all cases of the on-line pronunciation learning results, the post-test results surpassed those of the pre-test. The rate was about 10% for intelligibility; moreover, the perceptual error reduction rate (improvement rate of intelligibility/mis-perception rate) was about 30% as shown in parentheses. Five to seven out of the eight learners improved their pronunciation and intelligibility scores in the objective and subjective evaluations. Although the improvement in pronunciation was only a few percentage points, the rate increased to 3.7–4.9% in the case of all learners except for subject “h.”
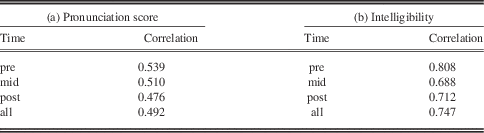
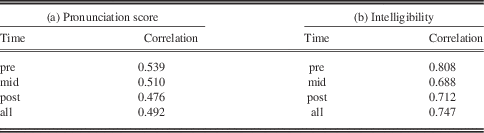
For the pronunciation score/intelligibility, (Table 16 shows the correlation coefficient for the estimated and native teacher scores.
From Tables 14 and 16, since the system estimated the pronunciation score/intelligibility with a correlation of 0.492/0.747 between the estimated and average native scores, we believe that the estimation is adequate, because the correlation among the native teacher scores was 0.540/0.800 (Table 14).
For intelligibility, since Table 14(b) shows that the correlation among teachers is high, teachers stably calculated intelligibility for read speech. Table 16(b) also shows a high correlation between teachers and the system. Our proposed system stably calculated intelligibility in a manner that resembled that of the teachers.
Correlation coefficient between automatically estimated and averaged teacher scores
7.4. Evaluation by questionnaire
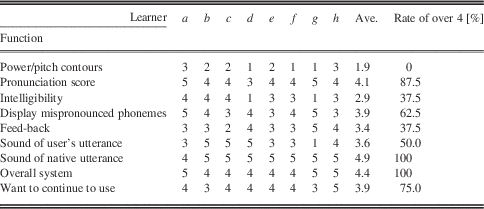
Finally, at the end of our experiment, students completed a questionnaire with the following main questions (5: excellent ~ 1: bad on the average). The feedback in this system denotes functions to indicate mispronounced phonemes, listening to user or native utterances, and showing correct pronunciation. The questions and averaged answers are as follows:
The detailed answers for the functions are summarized in Table 17. From the answers, we found that the pronunciation score, listening to a native speaker’s voice, indication of mispronounced phonemes, and listening to user utterances facilitated learning and simultaneously provided motivation to practice. Almost all of the learners reported that it was better to see one’s own mispronounced phonemes checked by this proposed system. Six out of eight learners reported that they wanted to use this system for learning English pronunciation.
Questionnaire: Whether each functions was useful
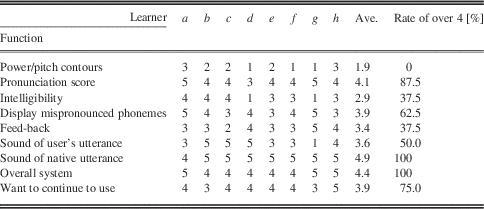
Regarding the intelligibility scores, however, the subjects did not know how to use them for measuring how much native speakers could comprehend their English. The power and pitch contours were also not used during the pronunciation training because users did not know how to practice with them.
In addition, from question responses that compared our system with self-directed learning (e.g., repeating utterance using CDs), it is clear that the estimated scores and display of mispronounced phonemes determined by phoneme-pair discrimination provide motivation for continued practice. From the answers concerning self-directed learning, we ascertained that the information about the quality of the subject’s own pronunciation and which phonemes must be improved is very important.
At the same time as scoring and transcription were performed, native English teachers marked the mispronounced words. We investigated the relationship between the number of mispronounced words, pronunciation score, and the number of incorrectly discriminated phoneme pairs. The correlation between estimated pronunciation score by the system and the number of mispronounced words was found to be 0.493; furthermore, a higher correlation of 0.610 was obtained between the pronunciation score by teachers and the number of mispronounced words. The number of mispronounced words had an even higher correlation, at 0.629, with the rate of incorrectly discriminated phoneme-pairs. These findings support the validity of our system.
Table 17 shows the answers from the questionnaire. The pronunciation score and the display of mispronounced phonemes obtained a good rating as seen by their high average scores. However, some subjects reported that they could not understand how to use the intelligibility score, which denotes how well native teachers perceive the words of the learner’s utterance. They also could not understand how to use power/pitch contours for learning pronunciation. These issues remain for future study. Compared with self-directed learning (e.g., repeating utterances using CDs), it is apparently beneficial to see one’s own mispronounced phonemes using this proposed system.
8. Conclusion
In this paper, we proposed a statistical method for estimating the pronunciation and intelligibility scores of presentations made in English by non-native speakers based on a linear regression model offline. By combining acoustic and linguistic measures, our proposed method evaluated pronunciation and intelligibility scores with almost the same accuracy and effectiveness as native English teachers. Our evaluation system could also estimate these functions without a correct transcription of the learner’s utterances.
We also developed an online learning evaluation system for English pronunciation targeted at Japanese speakers. Through experiments using this system to practice English pronunciation, we confirmed its positive learning effects: The pronunciation proficiency and intelligibility of learners were improved by using the proposed on-line system. From questionnaires, we ascertained that the pronunciation scores, listening to a native voice, indications of mispronounced phones, and listening to the user’s own utterances provided motivation to practice. Six learners out of the eight subjects reported that they wanted to use this system for learning English pronunciation.
Future work will integrate more useful functions into our online system, in particular, graphical user feedback with more emphasis on interpersonal skills. Finally, based on the knowledge obtained here, we want to improve the performance of non-native speech recognition.
Appendix
A.1. Speech Analysis
The speech was down-sampled to 16 kHz and pre-emphasized, and then a 25-ms wide Hamming window was applied every 10-ms. 12-dimensional MFCCs were used as speech feature parameters for a frame. The acoustic features were 12 MFCCs and their ∆ (velocity, time derivation) and ∆∆ (acceleration, 2-nd order time derivation) features, in total of 36 dimensions.
A.2. Formal Model of Speech Recognition
Automatic speech recognition (ASR) task is to find the corresponding word sequence for a given acoustic signal. Given a speech signal A, ASR systems find the corresponding word sequence  $\hat{W}$
that has maximum posterior probability P(W/A) according to Bayes’ theorem as follows:
 $$\eqalignno{ & \mathop{{\hat{W}=\arg \max P\left( {W{\rm /}A} \right)}}\limits_{w} \cr & W={\rm are}\mathop{{\max }}\limits_{w} {{P\left( {A/W} \right)P\left( W \right)} \over {P\left( A \right)}} \cr & W={\rm are}\mathop{{\max }}\limits_{w} \,P\left( {A/W} \right)P\left( W \right) \cr & W={\rm are}\mathop{{\max }}\limits_{w} \left( {\log P\left( {A/W} \right){\plus}\log P\left( W \right)} \right), $$
where P(A/W) is the probability of A given W based on acoustic model, P(W) is the probability of W based on LM. In general, the LM task is to assign a probability to a word sequence. Figure 7 shows the diagram of a general ASR system. P(A) is calculated approximately by
 $$P\left( A \right)=\sum P\left( {A,W} \right)\,\approx\,\max P\left( {A,W} \right)$$
This corresponds to recognition likelihood for arbitrary word (phoneme) sequence without a language model. We call these log- probabilities as log likelihoods.
Diagram of a general ASR system
A.3. Acoustic Model by HMM
P(A/W) is calculated by an acoustic model, which has been represented by HMM Acoustic models based on monophone HMMs were learned by the analyzed speech. The English HMMs were composed of three states, each of which has four Gaussian mixture distributions with full covariance matrices. The number of monophones was 39. The Japanese syllable-based HMMs were composed of four states, each of which has four Gaussian mixture distributions with full covariance matrices. The number of syllables was 117.
In the proposed system, we used three different HMMS as follows (see Figure 1):
/Native English phoneme HMM trained by native English data.
/Non-native English phoneme HMM trained by English data uttered by Japanese.
/Native Japanese syllable HMM trained by Japanese data.
A.4. Language Model by n-gram
The word-based n-gram LM is the most common LM currently used in ASR systems. It is a simple yet quite powerful method based on the assumption that the current word depends only on the preceding words. This LM predicts the current word based on preceding words. Given word history  $$w_{{i{\minus}n{\plus}1}}^{{i{\minus}1}} =w_{{i{\minus}n{\plus}1}} , \ldots ,w_{{i{\minus}1}} $$
, word-based n-gram predicts the current word w i according to the following equation:
 $$P\left( {w_{1}^{n} } \right)=\prod\limits_{i=1}^n {P\left( {w_{i} \,\mid\,w_{1} w_{2} \cdots w_{{i{\minus}1}} } \right)} \,\approx\,\prod\limits_{i=1}^n {P\left( {w_{i} \,\mid\,w_{{i{\minus}n{\plus}1}}^{{i{\minus}1}} } \right)} $$
for some n≥1. The number of n is closely related with the parameter number in the LM. We used the word-level n-gram LM for LVCSR, and the phoneme-level n-gram LM for phoneme recognition.