


%20--%3e%3c!DOCTYPE%20svg%20PUBLIC%20'-//W3C//DTD%20SVG%201.0//EN'%20'http://www.w3.org/TR/2001/REC-SVG-20010904/DTD/svg10.dtd'%3e%3csvg%20version='1.0'%20id='Layer_1'%20xmlns='http://www.w3.org/2000/svg'%20xmlns:xlink='http://www.w3.org/1999/xlink'%20x='0px'%20y='0px'%20width='64px'%20height='64px'%20viewBox='5.5%20-3.5%2064%2064'%20enable-background='new%205.5%20-3.5%2064%2064'%20xml:space='preserve'%3e%3cg%3e%3ccircle%20fill='%23FFFFFF'%20fill-opacity='0'%20cx='37.785'%20cy='28.501'%20r='28.836'/%3e%3cpath%20fill='%23595959'%20d='M37.441-3.5c8.951,0,16.572,3.125,22.857,9.372c3.008,3.009,5.295,6.448,6.857,10.314%20c1.561,3.867,2.344,7.971,2.344,12.314c0,4.381-0.773,8.486-2.314,12.313c-1.543,3.828-3.82,7.21-6.828,10.143%20c-3.123,3.085-6.666,5.448-10.629,7.086c-3.961,1.638-8.057,2.457-12.285,2.457s-8.276-0.808-12.143-2.429%20c-3.866-1.618-7.333-3.961-10.4-7.027c-3.067-3.066-5.4-6.524-7-10.372S5.5,32.767,5.5,28.5c0-4.229,0.809-8.295,2.428-12.2%20c1.619-3.905,3.972-7.4,7.057-10.486C21.08-0.394,28.565-3.5,37.441-3.5z%20M37.557,2.272c-7.314,0-13.467,2.553-18.458,7.657%20c-2.515,2.553-4.448,5.419-5.8,8.6c-1.354,3.181-2.029,6.505-2.029,9.972c0,3.429,0.675,6.734,2.029,9.913%20c1.353,3.183,3.285,6.021,5.8,8.516c2.514,2.496,5.351,4.399,8.515,5.715c3.161,1.314,6.476,1.971,9.943,1.971%20c3.428,0,6.75-0.665,9.973-1.999c3.219-1.335,6.121-3.257,8.713-5.771c4.99-4.876,7.484-10.99,7.484-18.344%20c0-3.543-0.648-6.895-1.943-10.057c-1.293-3.162-3.18-5.98-5.654-8.458C50.984,4.844,44.795,2.272,37.557,2.272z%20M37.156,23.187%20l-4.287,2.229c-0.458-0.951-1.019-1.619-1.685-2c-0.667-0.38-1.286-0.571-1.858-0.571c-2.856,0-4.286,1.885-4.286,5.657%20c0,1.714,0.362,3.084,1.085,4.113c0.724,1.029,1.791,1.544,3.201,1.544c1.867,0,3.181-0.915,3.944-2.743l3.942,2%20c-0.838,1.563-2,2.791-3.486,3.686c-1.484,0.896-3.123,1.343-4.914,1.343c-2.857,0-5.163-0.875-6.915-2.629%20c-1.752-1.752-2.628-4.19-2.628-7.313c0-3.048,0.886-5.466,2.657-7.257c1.771-1.79,4.009-2.686,6.715-2.686%20C32.604,18.558,35.441,20.101,37.156,23.187z%20M55.613,23.187l-4.229,2.229c-0.457-0.951-1.02-1.619-1.686-2%20c-0.668-0.38-1.307-0.571-1.914-0.571c-2.857,0-4.287,1.885-4.287,5.657c0,1.714,0.363,3.084,1.086,4.113%20c0.723,1.029,1.789,1.544,3.201,1.544c1.865,0,3.18-0.915,3.941-2.743l4,2c-0.875,1.563-2.057,2.791-3.541,3.686%20c-1.486,0.896-3.105,1.343-4.857,1.343c-2.896,0-5.209-0.875-6.941-2.629c-1.736-1.752-2.602-4.19-2.602-7.313%20c0-3.048,0.885-5.466,2.658-7.257c1.77-1.79,4.008-2.686,6.713-2.686C51.117,18.558,53.938,20.101,55.613,23.187z'/%3e%3c/g%3e%3c/svg%3e)
%20--%3e%3c!DOCTYPE%20svg%20PUBLIC%20'-//W3C//DTD%20SVG%201.0//EN'%20'http://www.w3.org/TR/2001/REC-SVG-20010904/DTD/svg10.dtd'%3e%3csvg%20version='1.0'%20id='Layer_1'%20xmlns='http://www.w3.org/2000/svg'%20xmlns:xlink='http://www.w3.org/1999/xlink'%20x='0px'%20y='0px'%20width='64px'%20height='64px'%20viewBox='5.5%20-3.5%2064%2064'%20enable-background='new%205.5%20-3.5%2064%2064'%20xml:space='preserve'%3e%3cg%3e%3ccircle%20fill='%23FFFFFF'%20fill-opacity='0'%20cx='37.637'%20cy='28.806'%20r='28.276'/%3e%3cg%3e%3cpath%20fill='%23595959'%20d='M37.443-3.5c8.988,0,16.57,3.085,22.742,9.257C66.393,11.967,69.5,19.548,69.5,28.5c0,8.991-3.049,16.476-9.145,22.456%20C53.879,57.319,46.242,60.5,37.443,60.5c-8.649,0-16.153-3.144-22.514-9.43C8.644,44.784,5.5,37.262,5.5,28.5%20c0-8.761,3.144-16.342,9.429-22.742C21.101-0.415,28.604-3.5,37.443-3.5z%20M37.557,2.272c-7.276,0-13.428,2.553-18.457,7.657%20c-5.22,5.334-7.829,11.525-7.829,18.572c0,7.086,2.59,13.22,7.77,18.398c5.181,5.182,11.352,7.771,18.514,7.771%20c7.123,0,13.334-2.607,18.629-7.828c5.029-4.838,7.543-10.952,7.543-18.343c0-7.276-2.553-13.465-7.656-18.571%20C50.967,4.824,44.795,2.272,37.557,2.272z%20M46.129,20.557v13.085h-3.656v15.542h-9.944V33.643h-3.656V20.557%20c0-0.572,0.2-1.057,0.599-1.457c0.401-0.399,0.887-0.6,1.457-0.6h13.144c0.533,0,1.01,0.2,1.428,0.6%20C45.918,19.5,46.129,19.986,46.129,20.557z%20M33.042,12.329c0-3.008,1.485-4.514,4.458-4.514s4.457,1.504,4.457,4.514%20c0,2.971-1.486,4.457-4.457,4.457S33.042,15.3,33.042,12.329z'/%3e%3c/g%3e%3c/g%3e%3c/svg%3e)
Introduction
Large capital investments and policy interventions are being deployed to accelerate agricultural transitions toward sustainability. A critical component of these voluntary initiatives is the use of strategic communication and standardized terminology to define acceptable practices, structure incentive programs, and track environmental progress. Research in social marketing and environmental communication demonstrates that language does not simply reflect attitudes but actively shapes perceived risk, social norms, and behavioral intentions (Comfort and Park, Reference Comfort and Park2018; Geng et al., Reference Geng, Chen, Ye, Zhou and Chen2019; Whitmarsh et al., Reference Whitmarsh, Xenias and Jones2019). While specific terms can build shared expectations within trusted networks (Norgaard, Reference Norgaard2012), they can also polarize. Even small label shifts can cue different mental models and political reactions: ‘global warming’ tends to evoke more affective associations than ‘climate change’, and ‘resilience’ or ‘stewardship’ frames often increase engagement relative to abstract or explicit mitigation frames (Benjamin et al., Reference Benjamin, Por and Budescu2017; Bolsen and Shapiro, Reference Bolsen and Shapiro2018).
Sustainability- and climate-related terminology is used unevenly across US agricultural stakeholder groups, highlighting the role of language in structuring how environmental priorities are communicated, interpreted, and acted upon. Researchers report deliberately adjusting terminology by audience, using explicit climate terms such as ‘climate change’ less frequently with farmers than with policymakers or the public, and emphasizing ‘sustainability’ more in communications with agribusiness actors (Getson et al., Reference Getson, Church, Radulski, Sjöstrand, Lu and Prokopy2022). Communication targeting farmers is often framed around weather variability, economic risk, and soil health to avoid the polarization associated with climate change-related language (Hunt and Hillis, Reference Hunt and Hillis2025). Farmers are more likely to agree that climate change is occurring than to attribute it primarily to human activity; this ‘attribution gap’ matters because terminology emphasizing mitigation often hinges on anthropogenic framing, whereas support for adaptation remains relatively high even among climate-skeptical farmers (Houser, Reference Houser2018; Hunt et al., Reference Hunt, Burnham, Wilmer and Hillis2026). Consequently, while framing agricultural practices as ‘adaptation’ can raise support (Byfuglien et al., Reference Byfuglien, Kvakkestad and Innocenti2025), explicit climate terminology can deter participation among skeptical producers (Feldman and Hart, Reference Feldman and Hart2018a, Reference Feldman and Hart2018b).
Despite these insights into tailored communication, a disconnect has emerged in practice between localized outreach and the standardized language of emerging sustainability market and incentive programs. Public and private initiatives frequently use abstract terms—such as ‘climate-smart’, ‘regenerative’, and ‘ecosystem services’—to market sustainability goals to boardrooms and consumers (Bless et al., Reference Bless, Davila and Plant2023; Wilson et al., Reference Wilson, Hendrickson and Myers2025). However, deploying these terms without precise definitions introduces operational uncertainty (Newton et al., Reference Newton, Civita, Frankel-Goldwater, Bartel and Johns2020; Trigo et al., Reference Trigo, Marta-Costa and Fragoso2021). This lack of clarity compromises multiple programmatic aspects: determining entry and eligibility, defining technical-assistance strategies, and setting the baseline metrics used to evaluate ecological success.
As this institutional vocabulary proliferates, whether farmer terminology corresponds with on-farm management practices remains empirically unexamined. This possible misalignment may result in a dual failure of conservation delivery. For producers, institutional language may act as a structural barrier to participation; farmers who engage in eligible conservation practices but fail to identify with these terms may face restricted access to conservation incentives and market premiums. For institutions, this disconnect may also introduce structural measurement error into assessments of program efficacy. When initiatives evaluate success based on enrollment or voluntary accounting rather than verified on-farm practices, this baseline may underreport landscape-level conservation progress.
In this study, we assess the empirical relationship between producer terminology and on-farm management practices. We focus on the US dairy sector where a flagship, industry-wide Net Zero Initiative is reliant on voluntary adoption to achieve its goal of greenhouse gas neutrality by 2050 (Innovation Center for US Dairy, 2023). Here, the operational alignment between producer behavior, vocabulary, and institutional program design remains untested. To address this gap, we use survey data from more than 900 US dairy farmers to investigate two primary research questions: (1) To what extent are dairy farmers aware of and utilizing institutional sustainability and climate terminology? (2) How is engagement with this terminology associated with the actual adoption of climate- and sustainability-relevant practices?
Methods
Survey instrument and variables
We developed a questionnaire to assess US dairy farmers’ use of climate-smart practices, terminology, climate perceptions, and farmer demographics and farm characteristics. The survey was developed in partnership with dairy industry experts and pretested with dairy farmers and technical service providers. We distributed the questionnaire to 41,422 dairy farmers nationwide between February and May 2023 using an online survey programmed in Qualtrics and administered following the tailored design method for executing survey research (Dillman et al., Reference Dillman, Smyth and Christian2014). The full survey instrument, including question wording, response options, and display logic, is provided in Supplementary Appendix A. The survey was announced via postcard invitation mailers with a Qualtrics weblink for access, with one reminder postcard approximately five weeks after the initial invitation. Postcard invitations also provided the opportunity for farmers to contact the research team for a paper version of the survey. Respondents could opt into a drawing for twenty $500 prizes. The survey was publicized through advertisements in two trade publications (Progressive Dairy and Hoard’s Dairyman) and promoted by Dairy Management Inc.’s farmer service staff. The survey was assessed and approved under University of Vermont IRB protocol (STUDY00002329).
We obtained contact information for 12,389 dairy farmers from the most recent publicly available Farm Service Agency (FSA) records of farmers who have received payments from federal programs (USDA FSA, 2021; Ulrich-Schad et al., Reference Ulrich-Schad, Li, Arbuckle, Avemegah, Brasier, Burnham, Chaudhary, Eaton, Gu, Haigh, Jackson-Smith, Metcalf, Pradhananga, Prokopy, Sanderson, Wade and Wilke2022), and contact information for 29,033 dairy farmers with 10 or more cows from DTN, an agricultural data service provider, for a combined sampling frame of 41,422 contacts.
This frame exceeds the 24,470 operations with milk sales recorded in the 2022 USDA National Agricultural Statistics Service (NASS) Census of Agriculture. Three features of the source lists account for this difference. First, FSA payment files are organized by payee rather than by operation, so a single dairy operation with multiple payees, for example, a partnership or multigenerational family farm, as well as non-operating landowners, may appear as several contacts. Second, both lists predate survey fielding, during a period of rapid consolidation and exit: the 2017 Census of Agriculture counted 54,599 farms with milk cows (MacDonald et al., Reference MacDonald, Law and Mosheim2020), compared with 36,024 in 2022, a 34% decline (USDA NASS, 2024). Third, the DTN list was defined by cattle inventory (10 or more cows) rather than by milk sales, and so likely included operations that hold dairy cattle but report no milk sales, such as heifer-raising operations and recently dispersed herds, a category the Census milk-sales count excludes by construction. Together, these features mean the frame should be read as a contact list rather than a count of active operations, and they likely reduced the effective response rate.
We collected a total of 920 responses, including 47 responses that were completed in paper format. Including partial and complete responses, this is equivalent to a 2.2% response rate under standard definitions (The American Association for Public Opinion Research, 2016). Because the sampling frame likely included operations that had exited dairy production, we also report an eligibility-adjusted rate: using the Census count of active operations with milk sales as an upper bound on the eligible population yields a response rate of at least 3.8% (920 of 24,470). Because some active operations appeared in neither list, this should be interpreted as an approximate eligibility-adjusted rate rather than an exact one. While this rate is low, it is consistent with declining response trends in survey research generally (Stedman et al., Reference Stedman, Connelly, Heberlein, Decker and Allred2019) and large-scale agricultural surveys specifically (Johansson et al., Reference Johansson, Effland and Coble2017), particularly those lacking up-front monetary incentives (Glas et al., Reference Glas, Getson, Gao, Singh, Eanes, Esman, Bulla and Prokopy2019; Avemegah et al., Reference Avemegah, Gu, Abulbasher, Koci, Ogunyiola, Eduful, Li, Barington, Wang, Kolady, Perkins, Leffler, Kovács, Clark, Clay and Ulrich-Schad2021). Further, prior work demonstrated that while electronically administered surveys typically yield lower response rates than mail surveys, overall response quality is uncompromised (Zahl-Thanem et al., Reference Zahl-Thanem, Burton and Vik2021).
To assess sample representativeness, we compared the geographic distribution of our respondents to the 2022 USDA NASS Census of Agriculture data for active dairy operations (Table S2 in the Supplementary Material). The sample is broadly aligned with the national population distribution, with modest overrepresentation in the Northeast and Central West and underrepresentation in the West and Southeast/Central. Respondents were primarily located in the Great Lakes region (47.5% of respondents; representation ratio = 1.03). This is followed by the Northeast (34.4%; ratio = 1.18), the Southeast/Central (11.5%; ratio = 0.80), the West (4.5%; ratio = 0.65), and the Central West (2.0%; ratio = 1.13). These regional differences reflect broader structural variation in the US dairy sector, in which Eastern regions contain a larger number of smaller and mid-sized farms and a higher prevalence of grazing-based or hybrid production systems (an estimated 27.2% of Eastern farms), while Western regions tend to have larger, confinement-oriented operations, although 19.3% of Western farms include some grazing (USDA APHIS, 2016; MacDonald et al., Reference MacDonald, Law and Mosheim2020).
Definition of terms
Because this study explores the knowledge and use of agricultural terminology, we state our own usage explicitly. Grazing refers here to the housing and feeding system rather than to any single practice: we classify operations as grazing-based if respondents reported grazing their herd outdoors for at least part of the year, and as confinement-oriented otherwise. This measure includes any seasonal grazing, so grazing-based operations range from seasonal and hybrid systems through fully pasture-based ones. Certification status refers to whether an operation currently participates in USDA Organic certification, which we treat as distinct from the grazing–confinement distinction; the survey also recorded grassfed and animal welfare certification, but only organic certification enters our models. We avoid ‘conventional’ as an analytic category because in the dairy sector it typically denotes the absence of organic certification rather than the absence of grazing, and the two distinctions do not coincide: pasture-based operations may be non-certified, and certified organic operations may confine animals for substantial parts of the year depending on geographic and climatic context. Finally, we use ‘sustainability- and climate-relevant practices’ to refer specifically to the eight practices identified by the US Dairy Net Zero Initiative as greenhouse gas mitigation options (Table 1; Innovation Center for US Dairy, 2023). The label describes this practice set and is not a judgment that operations using other practices are unsustainable; many farmers consider their operations sustainable without using this vocabulary and may regard the term itself as an implicit criticism of their farming systems.
Adoption prevalence and description of each sustainable practice by practice domain

Table 1. Long description
The table consists of five columns: Domain, Practice, Description, N, and percentage using practice.
At the top, a summary row indicates that for at least one sustainability- or climate-relevant practice, N is 694 and the adoption rate is 79.0 percent.
Manure-based domain practices include:
- Composting manure: Controlled aerobic decomposition. N is 692, 45.5 percent.
- Aeration of manure: Introducing oxygen into liquid storage. N is 688, 15.8 percent.
- Solids-liquids separation: Mechanical or gravity systems. N is 688, 15.0 percent.
- Anaerobic digesters: Enclosed oxygen-free systems to capture methane. N is 689, 2.6 percent.
- Summary for at least one manure practice: N is 693, 53.7 percent.
Animal-based domain practice:
- Use of feed additives: Compounds like 3-N O P or red seaweed to inhibit enteric methane. N is 689, 11.6 percent.
Land-based domain practices include:
- Diversifying pasture or forage crops: Planting multiple species for soil health. N is 690, 48.4 percent.
- Increasing length of grazing season: Extending grazing days to reduce feed costs. N is 689, 34.0 percent.
- Incorporating rotational or mob grazing: Frequent movement among paddocks. N is 691, 30.5 percent.
- Summary for at least one land practice: N is 691, 60.1 percent.
Variables
We examined the relationship between farmers’ engagement with sustainability- and climate-related agricultural terminology and their adoption of eight agricultural practices (i.e., anaerobic digesters, composting manure, aeration of manure, solids–liquids separation, longer grazing seasons, rotational grazing, diversifying pasture or forage crops, and the use of feed additives). These practices were chosen in partnership with dairy industry experts and reflect the three types of climate mitigation options available to dairy farmers (i.e., land-based, manure-based, and animal-based) (Innovation Center for US Dairy, 2023; Rotz et al., Reference Rotz, Briggs, Hristov, Leytem, Young, Hagevoort and Mullinax2025).
Seven terms were selected to reflect both current policy and market opportunities (i.e., ‘carbon market’ and ‘payment for ecosystem services’) and terms frequently used by government, non-profit, and private sector organizations related to agricultural sustainability (i.e., ‘climate-smart agriculture’, ‘nature-based farming’, ‘carbon farming’, ‘regenerative agriculture’, and ‘sustainable agriculture’). Candidate terms were drawn from three sources: federal program language, including the USDA Partnerships for Climate-Smart Commodities (USDA, 2022); dairy-industry and private-sector initiatives, including the US Dairy Net Zero Initiative, corporate supply-chain commitments, and emerging carbon market programs; and the academic, non-profit, and gray literature, in which nature-based and ecosystem-service framings are common. We refined this list in consultation with dairy industry experts. Terms were retained if they were (1) prominent in active or emerging programs that could deliver incentives to dairy farmers, (2) collectively representative of distinct framings of conservation (ecological or stewardship-oriented, climate-mitigation-oriented, and market-oriented), and (3) anchored by one broadly familiar reference term, ‘sustainable agriculture’. Terms were deliberately not defined for respondents, because the aim was to measure unprompted recognition and self-described use rather than comprehension of a supplied definition. Respondents were asked which of the listed terms or programs they had heard of; for each term they recognized, they then indicated whether they had used the term themselves or had heard other farmers use it. Respondents who recognized a term but did not report using it themselves were classified as aware only.
For each of the seven terms, respondents were categorized into three mutually exclusive engagement levels based on their familiarity and self-reported application: ‘Not aware’ (reference category)—producers who reported no prior familiarity or awareness of the term; ‘Aware only’–producers who reported being familiar with or aware of the term but did not actively apply or identify with it in their operation; and ‘Aware and use’—producers who reported both familiarity with the term and use of the term to describe their farm management. In all Bayesian logistic regression models, engagement variables were entered as unordered categorical predictors with ‘Not aware’ designated as the baseline reference group. Exponentiated posterior regression coefficients (
$ \mathrm{OR}=\exp \left(\beta \right) $
 ) compare the odds of practice adoption for producers in the ‘Aware only’ or ‘Aware and use’ categories relative to unaware producers, holding all other terminology predictors and demographic covariates constant.
Model estimation
To investigate the relationship between farmers’ engagement with sustainability terminology and their adoption of specific agricultural practices, we specified eight multivariable Bayesian logistic regression models (one for each practice outcome). A Bayesian framework was selected due to its ability to reliably estimate rare binary outcomes (e.g., low adoption baseline for anaerobic digesters), provide exact parameter credible intervals without relying on large-sample asymptotic assumptions, and incorporate leave-one-out diagnostic procedures. For each practice model
$ j\in \left\{1,\dots, 8\right\} $
 , the binary adoption outcome
$ {y}_{ij}\in \left\{0,1\right\} $
 for respondent
$ i $
 was modeled using a Bernoulli likelihood with a logit link function:


where
$ {\alpha}_j $
 is the intercept,
$ {\mathbf{X}}_i $
 is the vector of primary predictors, capturing farmers’ engagement across seven terms simultaneously, and
$ {\mathbf{Z}}_i $
 is a vector of farm-level controls. Term engagement predictors (
$ {\mathbf{X}}_i $
 ) were entered as three-level unordered factors (‘Not aware’ [reference], ‘Aware only’, and ‘Aware and use’). Covariates (
$ {\mathbf{Z}}_i $
 ) included education level (associate’s degree or higher), standardized acres owned, standardized herd size, and identification as a Plain community member (e.g., Amish, Mennonite). The survey also recorded participation in USDA Organic certification, grassfed certification, and animal welfare certification. Because organic regulations require ruminants to graze for at least 120 days per year and to obtain at least 30% of dry matter intake from pasture (7 CFR § 205.237(c), § 205.239(a)(2)), and because certified operations may be more exposed to ecological sustainability vocabulary, we fit a second set of models that additionally included current USDA Organic certification as a covariate (Table S6 in the Supplementary Material). The certification question was shown only to respondents who reported having heard of the program; respondents unaware of organic certification were coded as not certified. To separate the contribution of this covariate from that of the smaller analytic sample it defines, we also fit the original covariate set to the subset of respondents with non-missing certification data.
Models were estimated in R (R Core Team, 2025) using the brms package (Bürkner, Reference Bürkner2017) with Stan. We specified weakly informative
$ \mathcal{N}\left(0,1\right) $
 priors on the log-odds scale for all population-level regression coefficients (
$ {\boldsymbol{\beta}}_j,{\boldsymbol{\gamma}}_j $
 ) and intercepts (
$ {\alpha}_j $
 ). Posterior distributions were sampled across four Markov Chain Monte Carlo chains using 4,000 iterations per chain (1,000 warmup iterations; 12,000 total post-warmup draws). We verified sampling quality and convergence using Gelman-Rubin diagnostics (Rˆ < 1.01) and effective sample size thresholds (Bulk ESS > 1,000 and Tail ESS > 1,000; Table S3 in the Supplementary Material).
Model goodness-of-fit and predictive validity were evaluated using Pareto Smoothed Importance Sampling Leave-One-Out Cross-Validation (PSIS-LOO; Vehtari et al., Reference Vehtari, Gelman and Gabry2017). For influential observations with shape parameters
$ k>0.70 $
 , moment matching (moment_match) or exact refitting (reloo) was conducted (Table S4 in the Supplementary Material). Final diagnostic checks confirmed that all maximum Pareto
$ k $
 shape parameters satisfied reliability criteria (
$ k\le 0.70 $
 ; ranging from 0.47 to 0.69). Generative model fit was also visually assessed using posterior predictive checks (PPCs; Gelman, Reference Gelman2013). For each practice model, 1,000 posterior datasets (
$ {y}_{rep} $
 ) were drawn from the posterior predictive distribution and compared against the observed binary outcome counts
$ (y) $
 . All eight models demonstrated predictive accuracy, with posterior simulated counts matching observed adoption distributions (Figure S1 in the Supplementary Material).
Posterior medians and 95% equal-tailed credible intervals (CrIs) were extracted for each term engagement contrast (‘Aware only’ versus ‘Not aware’; ‘Aware and use’ versus ‘Not aware’). Posterior draws were exponentiated (
$ \mathrm{OR}=\exp \left(\beta \right) $
 ) to yield odds ratios (Table S5 in the Supplementary Material). Associations were interpreted as credible if the 95% CrI excluded 1.00; these credible effects are emphasized in heatmap visualizations using bold font and outlined cell boundaries.
Results
Section 1. Farm characteristics, adoption, and term use
Farmer and farm characteristics
Our sample reflects a broad cross-section of US dairy farmers operating across diverse regions and production systems (Table S1 in the Supplementary Material). Most respondents identified as male (79%), and nearly half (48%) reported having at least an associate’s degree. Approximately one-third (35%) identified as members of the Plain community, representing Amish and Mennonite farmers whose operations have distinct cultural practices and technology use profiles, many of whom restrict grid electricity or specific engine-powered equipment. A majority of farmers (72%) reported having at least a partial succession plan in place, and had been farming for a median of 35 years (IQR: 23–45; mean = 34, SD = 15), indicating substantial experience in dairy management.
Farm size and land base were highly variable and right-skewed, so we report medians alongside means. Median herd size was 125 cows (IQR: 70–281; mean = 329, SD = 742). Respondents owned a median of 280 acres (IQR: 150–500; mean = 489, SD = 1,203) and rented a median of 100 additional acres (IQR: 10–292; mean = 249, SD = 434). Financial positions also varied: approximately one-quarter (23.5%) reported no farm debt, about half (51.0%) carried debt up to their annual income (31.3% below 50%, 19.7% at 50–100%), and one-quarter (25.6%) reported debt exceeding annual income.
Respondents were geographically distributed across all major US dairy regions, primarily located in the Great Lakes (47.5%) and Northeast (34.4%), followed by the Southeast/Central region (11.5%), the West (4.5%), and the Central West (2%).
Consistent with this regional composition, 60% of respondents grazed their herds outdoors for at least part of the year—a proportion higher than national estimates, which suggest that approximately 33% of US dairy farms operate grazing or mixed confinement–grazing systems (USDA APHIS, 2016). The greater share of respondents identifying as members of Plain communities aligns with the geographic patterns observed in the sample, particularly in the Northeast and Upper Midwest where Plain community-affiliated farms are a visible presence, though national data on sectarian composition of this group is unavailable.
Certified organic operations made up a small share of the sample: 64 respondents (9.4% of those with valid responses) reported current participation in USDA Organic certification, and 17 (2.5%) held a grassfed certification. As expected given organic grazing requirements, nearly all certified organic respondents grazed (60 of the 63 with a grazing response; 95%). Certified operations nonetheless accounted for only a small fraction of grazing operations: 345 of 405 grazing respondents (85%) were not certified organic. Adoption of land-based practices was substantially higher among certified organic respondents than among non-certified respondents (rotational grazing, 89% versus 24%; longer grazing season, 81% versus 28%; diversified pasture or forage, 84% versus 45%), whereas adoption of manure-based practices was broadly similar between the two groups.
Adoption of sustainable agriculture practices
Adoption of sustainable management practices varied substantially across manure-based, animal-based, and land-based strategies (Table 1). Overall, 79% of dairy farmers reported currently using at least one strategy, with adoption concentrated in land-based (60.1%) and manure-based (53.7%) strategies, and substantially lower uptake of animal-based interventions (11.6%), which are more emergent.
At the practice level, adoption varied widely within domains (Table 1). Among manure-based strategies, composting was the most common, with 46% of farmers reporting current use. In contrast, more capital-intensive technologies such as anaerobic digesters (2.6%), solids–liquids separation (15.0%), and manure aeration (15.8%) were less prevalent. Adoption of animal-based practices was similarly modest: 11.6% of farmers reported current use of feed additives designed to reduce enteric emissions.
Land-based or agroecological strategies were more widely adopted. Nearly half of respondents (48.4%) reported diversifying pasture or forage crops, and one-third (34.0%) reported increasing the length of the grazing season. Rotational or mob grazing was used by 31% of farmers. Overall, we find higher adoption of lower-cost, management-based strategies and comparatively lower adoption of capital-intensive or technologically complex mitigation approaches.
Awareness and use of terms
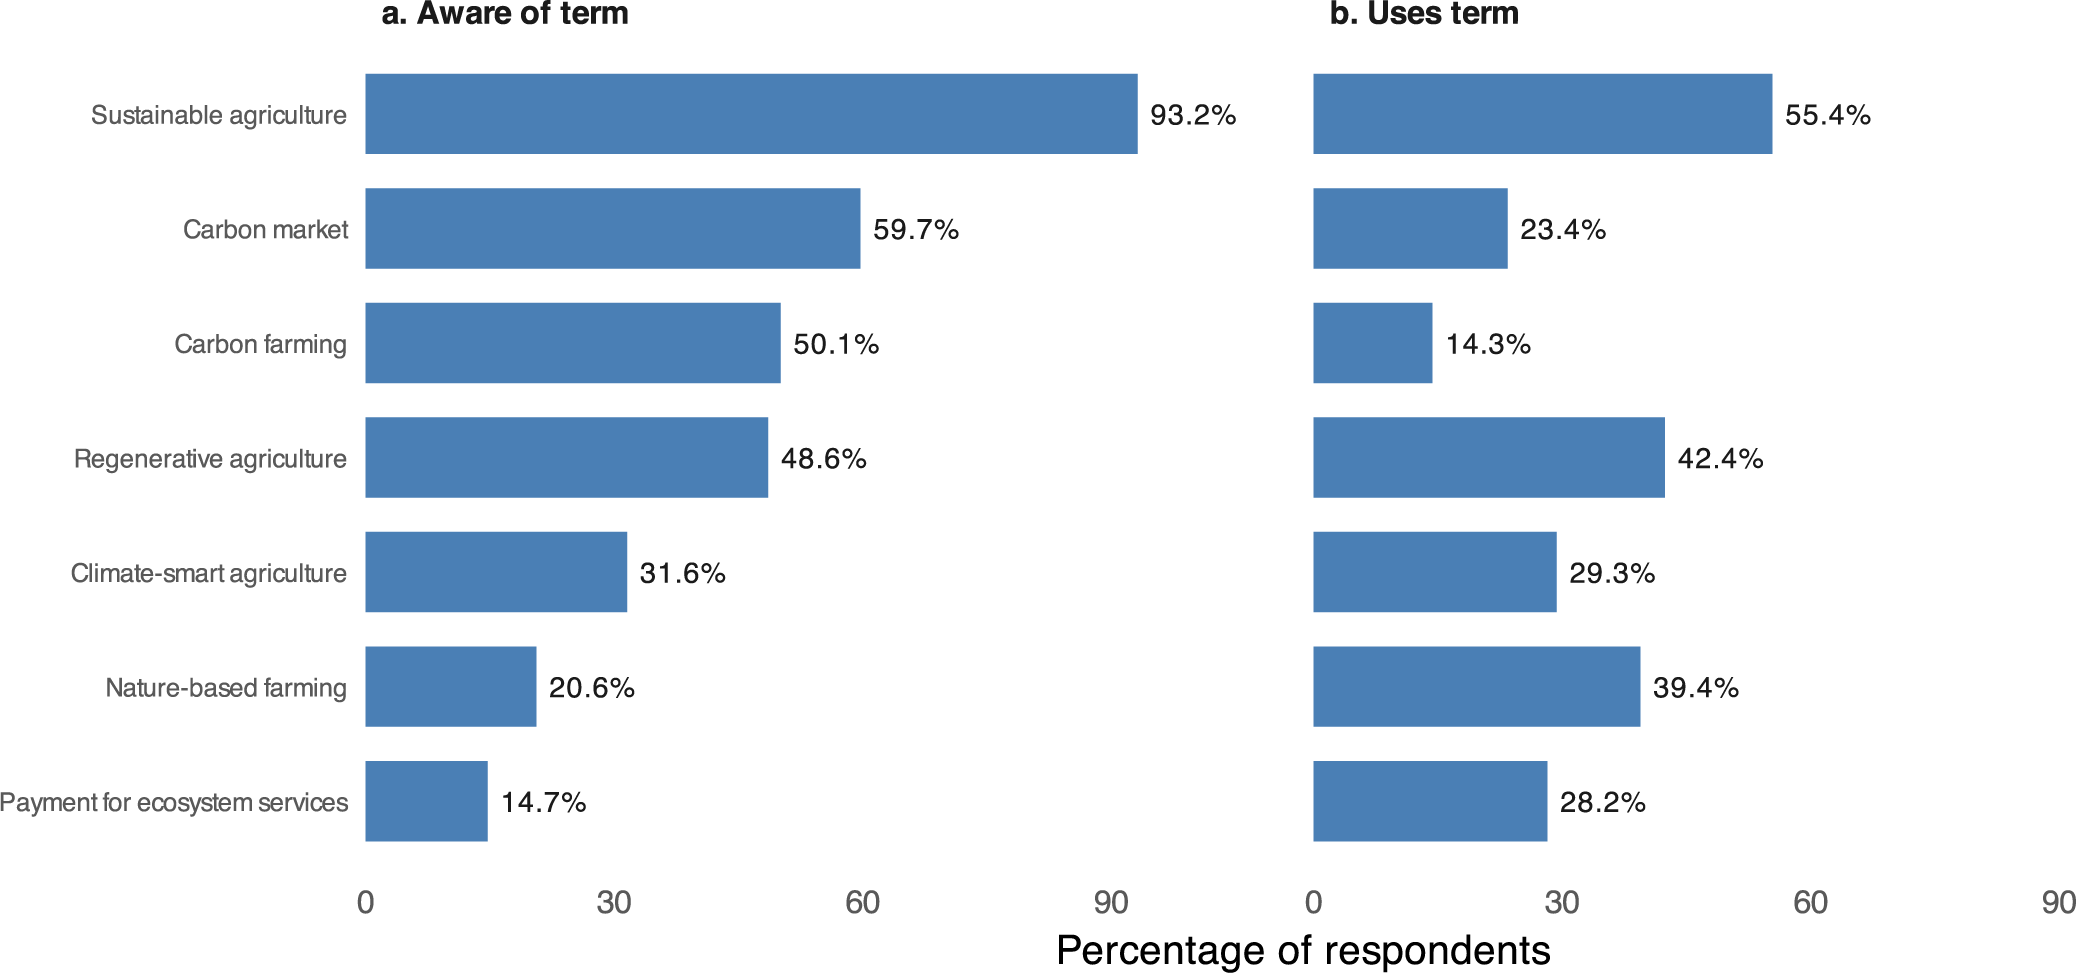
Dairy farmers reported limited familiarity with many of the terms commonly used by government, non-profit, private sector, and academic institutions to describe sustainable agricultural practices (Fig. 1). Fewer than half of respondents were aware of terms such as ‘regenerative agriculture’ (48.6%), ‘climate-smart agriculture’ (31.6%), ‘nature-based farming’ (20.6%), and ‘payment for ecosystem services’ (14.7%). Awareness was highest for ‘sustainable agriculture’, with 93% of respondents indicating familiarity; however, only 55% of those aware reported using the term to describe their own practices. Awareness of ‘carbon market’ (59.7%) and ‘carbon farming’ (50.1%) was more moderate, yet only 23.4% and 14.3% of farmers who recognized these terms, respectively, used them in reference to their operations. Collectively, these patterns highlight a substantial gap between institutional sustainability terminology and the language farmers use to describe their management practices.
Percentage of farmers aware (a) of each term (n = 529); and percentage of aware farmers who reported using each term (b) to describe their practices (conditional on awareness; n = 78–493).

Figure 1. Long description
The two panels share a vertical axis listing seven terms. The horizontal axis for both represents the percentage of respondents from 0 to 90.
Panel a, titled Aware of term, shows a decreasing trend in awareness from top to bottom.
* Sustainable agriculture: 93.2 percent.
* Carbon market: 59.7 percent.
* Carbon farming: 50.1 percent.
* Regenerative agriculture: 48.6 percent.
* Climate-smart agriculture: 31.6 percent.
* Nature-based farming: 20.6 percent.
* Payment for ecosystem services: 14.7 percent.
Panel b, titled Uses term, shows the percentage of aware farmers who use the term.
* Sustainable agriculture: 55.4 percent.
* Carbon market: 23.4 percent.
* Carbon farming: 14.3 percent.
* Regenerative agriculture: 42.4 percent.
* Climate-smart agriculture: 29.3 percent.
* Nature-based farming: 39.4 percent.
* Payment for ecosystem services: 28.2 percent.
Respondents’ views on climate change provide context for these patterns. Among the 590 respondents who answered the item, 16.1% attributed climate change mostly to human activity and 32.2% to human and natural causes equally, while 35.1% considered the causes mostly natural, 5.6% reported that climate change is not occurring, and 11.0% reported insufficient evidence to judge. Consistent with the attribution gap documented in prior work (Houser, Reference Houser2018), a minority of respondents endorsed the anthropogenic framing on which explicitly mitigation-oriented terminology typically rests.
Section 2. Linking terminology to practice adoption
Relationship of term awareness and use conditional on practice adoption
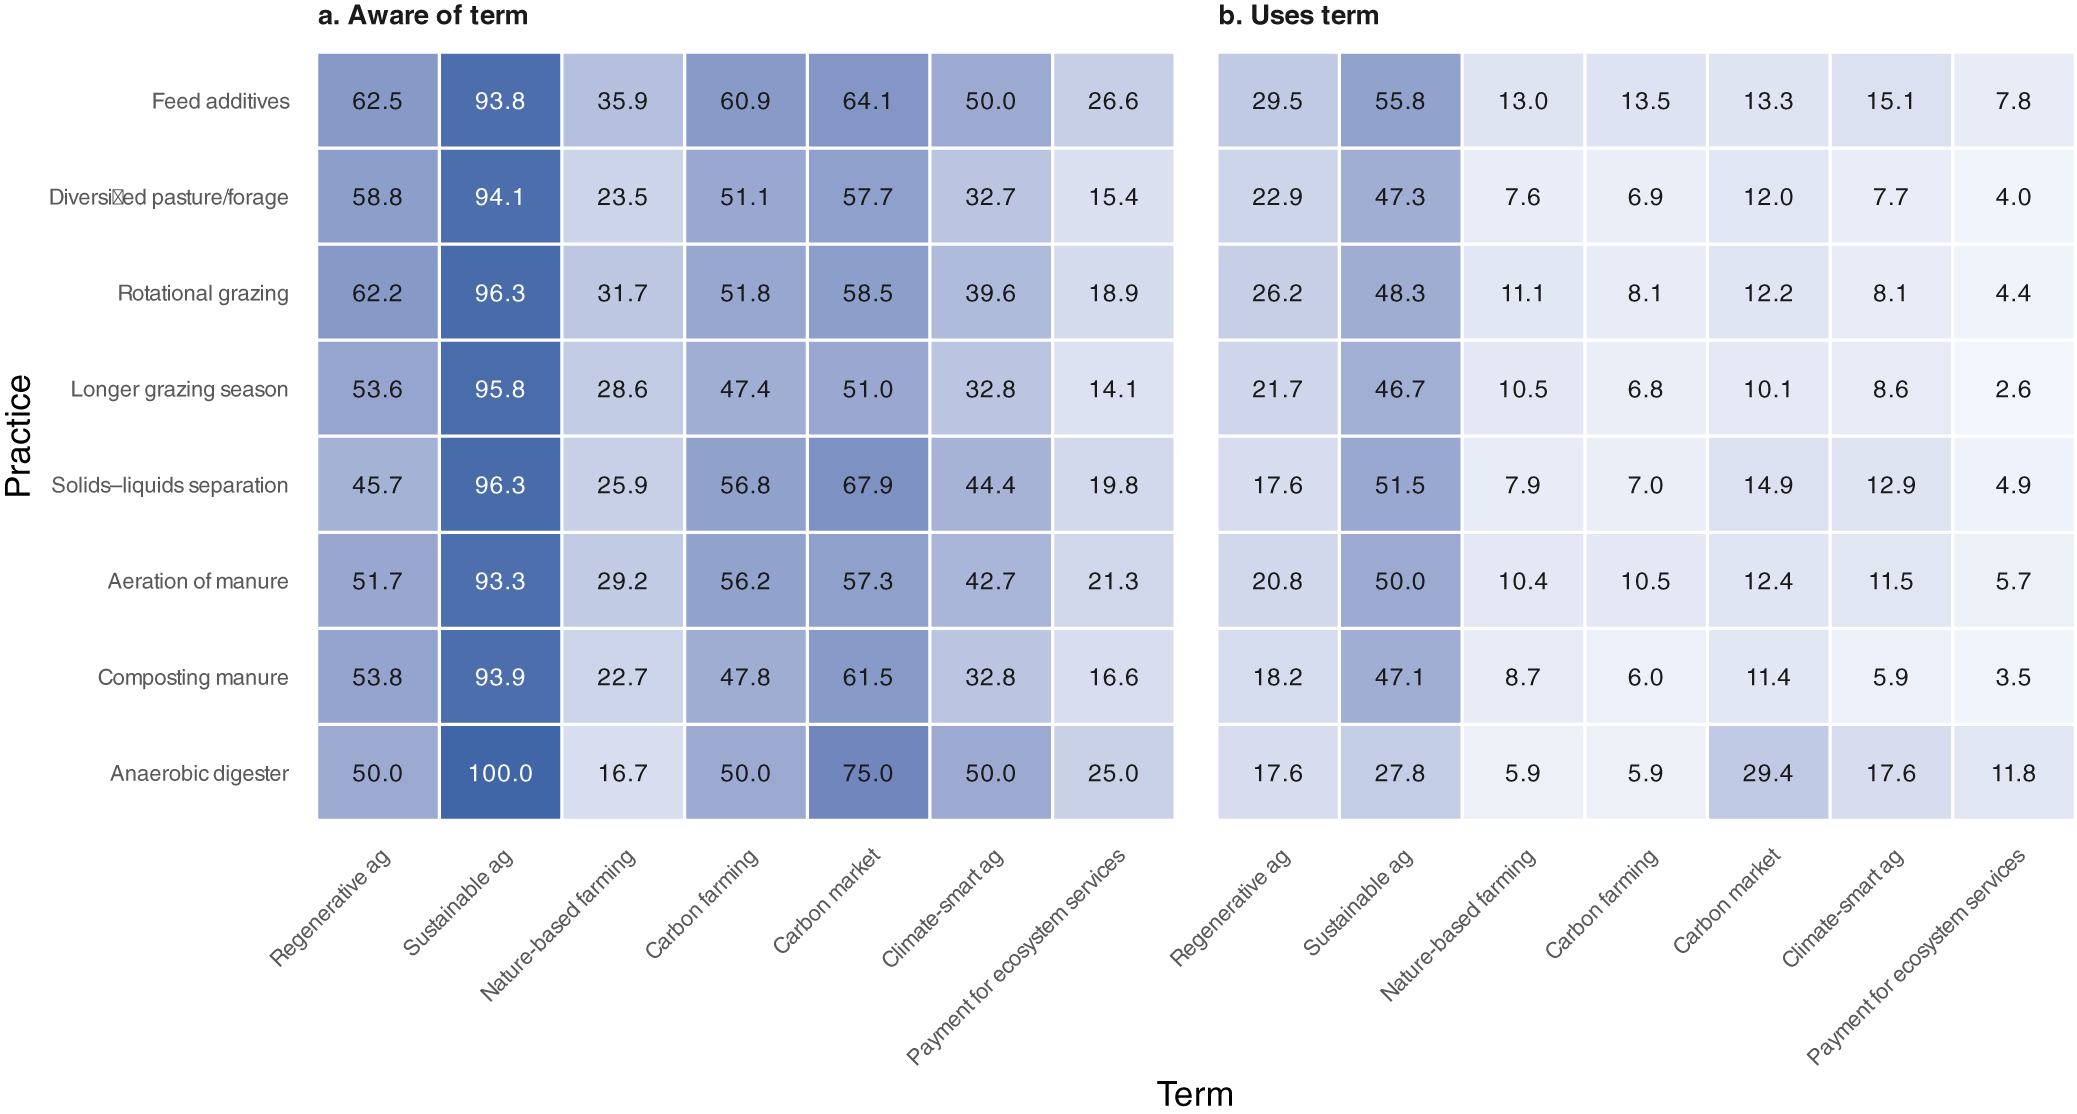
We next assess whether awareness and use of sustainability terminology is associated with adoption of practices, given the possibility that limited term use simply reflects non-adoption. However, we find that even among practice adopters, awareness of sustainability-related terms was uneven and generally low (Fig. 2a). Only ‘sustainable agriculture’ (93–100% awareness) and ‘carbon market’ (51–75% awareness) were recognized by a majority of adopters across all practices. For most terms, awareness among adopters (Fig. 2a) was higher than in the full sample (Fig. 1a) yet remained limited overall. These patterns demonstrate that even farmers actively implementing sustainable practices often lack familiarity with the institutional and market terminology used to describe those practices.
Awareness (a) and use (b) of sustainability-related terminology among farmers adopting each practice. Values are the percentage of farmers currently using each practice (rows) who had heard of each term (a), or who reported using the term to describe their operation (b). Denominators are all farmers currently using the practice, including those who had not heard the term. Both panels share one color scale. For example, among farmers using feed additives, 93.8% were aware of the term ‘sustainable agriculture’ and 55.8% used it.

Figure 2. Long description
The figure consists of two side-by-side heatmaps, panel a titled Aware of term and panel b titled Uses term. Both share a vertical Y axis labeled Practice and a horizontal X axis labeled Term. The color scale uses darker blue for higher percentages and lighter blue for lower percentages.
Shared Y axis practices from top to bottom: Feed additives, Diversified pasture or forage, Rotational grazing, Longer grazing season, Solids-liquids separation, Aeration of manure, Composting manure, and Anaerobic digester.
Shared X axis terms from left to right: Regenerative ag, Sustainable ag, Nature-based farming, Carbon farming, Carbon market, Climate-smart ag, and Payment for ecosystem services.
Panel a (Awareness):
* Sustainable ag has the highest awareness across all practices, ranging from 93.3 to 100.0 percent.
* Carbon market awareness is also high, ranging from 51.0 to 75.0 percent.
* Payment for ecosystem services has the lowest awareness, ranging from 14.1 to 26.6 percent.
* Regenerative ag awareness is moderate, between 45.7 and 62.5 percent.
Panel b (Usage):
* Sustainable ag is the most used term, but values are lower than awareness, ranging from 27.8 to 55.8 percent.
* Regenerative ag usage ranges from 17.6 to 29.5 percent.
* Usage for all other terms is significantly lower, often falling below 15 percent. For example, Nature-based farming usage ranges from 5.9 to 13.0 percent.
* The lowest usage is for Payment for ecosystem services, ranging from 2.6 to 11.8 percent.
While adopters demonstrated limited awareness of many terms, they were even less likely to use these terms to describe their own operations or management practices (Fig. 2b). ‘Sustainable agriculture’ was the most commonly used term; however, even this term was used by only about half of practice adopters (47–56%), and by just 27.8% of farmers operating anaerobic digesters. The highest alignment between adoption and term use occurred among the small subset of farmers using methane-reducing feed additives, 55.8% of whom reported using the term ‘sustainable agriculture’.
‘Regenerative agriculture’ was the next most frequently used term, but remained a minority frame, with only 18–29% of adopters across practices employing it. Use of other relevant terms was substantially lower, with generally less than 20% of farmers who had adopted a sustainable strategy using terms related to the practice. Explicitly climate-oriented language showed particularly low uptake: only 6–18% of practice adopters used ‘climate-smart agriculture’ or ‘carbon farming’ to describe their operations. Overall, these patterns indicate that even farmers actively implementing sustainable practices rarely use the terminology most prevalent in policy, market, or scientific discourse, reinforcing a persistent disconnect between institutional language and farmers’ own descriptions of management.
Associations between term awareness, use, and practice adoption
To formally assess associations between terminology awareness and use with on-farm practice adoption, we estimated Bayesian logistic regression models controlling for key demographic and farm characteristics. Overall, engagement with ecological terms demonstrated positive associations with several practices, whereas associations for climate- and market-focused terms were predominantly weak to null.
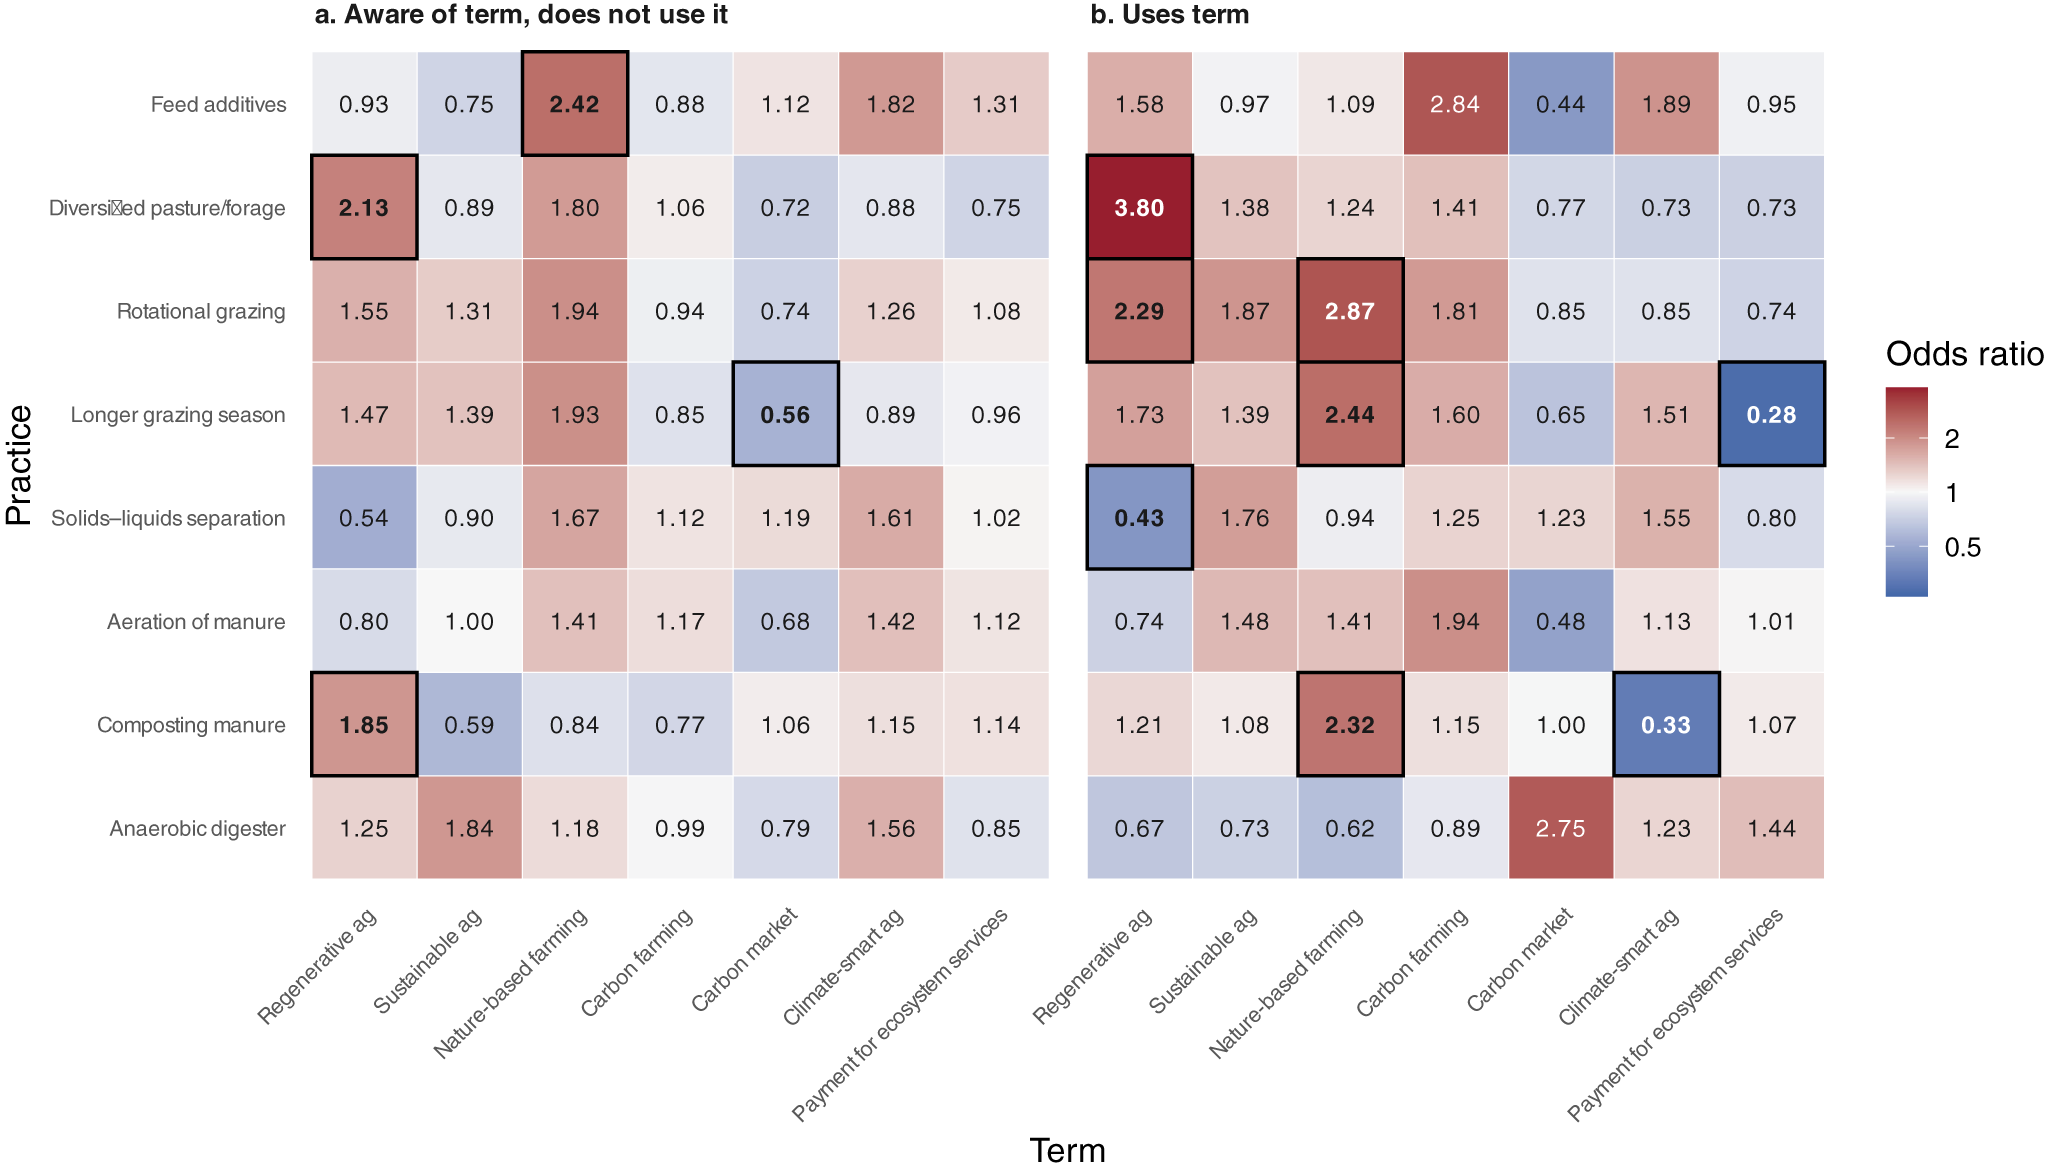
Engagement with terms such as regenerative agriculture’ and ‘nature-based farming’ was positively associated with specific practices, particularly grazing and composting (Fig. 3). Farmers who were aware of ‘regenerative agriculture’ had higher odds of composting manure (OR = 1.85; 95% CrI: 1.11–3.07) and diversifying pasture and forage crops (OR = 2.13; 95% CrI: 1.28–3.51). Among farmers who both knew and used ‘regenerative agriculture’ to describe their practices, associations were stronger, including higher odds of rotational grazing (OR = 2.29; 95% CrI: 1.17–4.54) and diversifying pasture and forage (OR = 3.80; 95% CrI: 2.00–7.29). Similarly, farmers who used the term ‘nature-based farming’ had higher odds of composting manure (OR = 2.32; 95% CrI: 1.06–5.17), extending their grazing season (OR = 2.44; 95% CrI: 1.04–5.78), and adopting rotational grazing (OR = 2.87; 95% CrI: 1.19–6.87). Farmers aware of the term also had higher odds of using feed additives (OR = 2.42; 95% CrI: 1.06–5.33).
Heatmap of associations between term engagement and practice adoption. Cells show posterior median odds ratios (ORs) from Bayesian logistic regressions estimating the association between farmers’ engagement with each term and adoption of eight practices, relative to farmers not aware of the term. Panel (a) shows farmers who were aware of a term but did not use it, and panel (b) shows farmers who used the term. Red indicates greater odds of adoption and blue indicates lower odds. The color scale is logarithmic, so ORs of equal magnitude above and below 1 (for example, 2 and 0.5) are shaded with equal intensity. Bold, outlined cells indicate associations whose 95% credible intervals exclude 1.

Figure 3. Long description
A two-panel heatmap with a shared Y-axis labeled Practice and a shared X-axis labeled Term. A color scale on the right indicates Odds Ratio O R, where dark red is 2, white is 1, and dark blue is 0.5.
Panel a, Aware of term, does not use it:
* Y-axis practices from top to bottom: Feed additives, Diversified pasture/forage, Rotational grazing, Longer grazing season, Solids-liquids separation, Aeration of manure, Composting manure, Anaerobic digester.
* X-axis terms from left to right: Regenerative ag, Sustainable ag, Nature-based farming, Carbon farming, Carbon market, Climate-smart ag, Payment for ecosystem services.
* Significant positive associations (bold outline, red): Diversified pasture/forage with Regenerative ag (2.13), Feed additives with Nature-based farming (2.42), and Composting manure with Regenerative ag (1.85).
* Significant negative association (bold outline, blue): Longer grazing season with Carbon market (0.56).
Panel b, Uses term:
* Significant positive associations (bold outline, red): Diversified pasture/forage with Regenerative ag (3.80), Rotational grazing with Regenerative ag (2.29) and Nature-based farming (2.87), Feed additives with Carbon farming (2.84), Longer grazing season with Nature-based farming (2.44), and Composting manure with Nature-based farming (2.32).
* Significant negative associations (bold outline, blue): Solids-liquids separation with Regenerative ag (0.43), Composting manure with Climate-smart ag (0.33), and Longer grazing season with Payment for ecosystem services (0.28).
Against the mostly null backdrop for climate- and market-focused concepts, we identified a few negative associations, though these estimates generally had wider credible intervals. For instance, awareness of ‘carbon market’ was associated with lower odds of adopting longer grazing seasons (OR = 0.56; 95% CrI: 0.33–0.92). Additionally, lower odds of composting were observed among those utilizing the term ‘climate-smart agriculture’ (OR = 0.33; 95% CrI: 0.14–0.77), lower odds of solids–liquids separation were linked to the use of ‘regenerative agriculture’ (OR = 0.43; 95% CrI: 0.18–0.97), and use of ‘payment for ecosystem services’ was associated with lower odds of maintaining a longer grazing season (OR = 0.28; 95% CrI: 0.08–0.90).
Demographic and structural covariates reflected previously observed trends (MacDonald et al., Reference MacDonald, Law and Mosheim2020). Specifically, larger herd sizes strongly predicted the adoption of capital-intensive infrastructure like anaerobic digesters (OR = 2.38; 95% CrI: 1.48–4.04) but were negatively associated with pasture-based practices such as rotational grazing (OR = 0.14; 95% CrI: 0.05–0.31). Identifying as a Plain community member was likewise negatively associated with rotational grazing (OR = 0.41; 95% CrI: 0.23–0.71). Holding an associate’s degree or higher increased the odds of adopting management- and knowledge-intensive practices, including manure aeration (OR = 2.21; 95% CrI: 1.27–3.92), composting manure (OR = 1.62; 95% CrI: 1.05–2.50), and rotational grazing (OR = 1.79; 95% CrI: 1.11–2.88).
Education was also associated with terminology itself. Descriptively, farmers with at least an associate’s degree were more likely to have heard of most terms and, among those aware, more likely to use them (Table S7 in the Supplementary Material). In models adjusting for Plain community membership, herd size, and acres owned (Table S8 in the Supplementary Material), this association was concentrated in term use rather than in awareness. Among farmers aware of a term, holding an associate’s degree or higher was associated with using ‘climate-smart agriculture’ (OR = 2.43; 95% CrI: 1.13–5.31), ‘carbon market’ (OR = 2.10; 95% CrI: 1.15–3.86), ‘regenerative agriculture’ (OR = 1.74; 95% CrI: 1.01–3.00), and ‘sustainable agriculture’ (OR = 1.56; 95% CrI: 1.02–2.38). Awareness itself was associated with education only for ‘regenerative agriculture’ (OR = 1.98; 95% CrI: 1.32–3.01). Identifying as a member of a Plain community was more strongly associated with awareness, with lower odds for most terms (e.g., ‘regenerative agriculture’, OR = 0.41; 95% CrI: 0.26–0.63). Formal education therefore appears to shape whether farmers adopt institutional vocabulary as their own more than whether they have encountered it.
Models that additionally included organic certification (Table S6 in the Supplementary Material) indicate that part of this pattern is related to certification. Certification was strongly associated with land-based practices (rotational grazing, OR = 12.36, 95% CrI: 5.39–31.20; longer grazing season, OR = 10.39, 95% CrI: 4.62–25.68; diversified pasture or forage, OR = 4.84, 95% CrI: 2.11–12.52) but was not credibly associated with any manure-based practice. Accounting for certification, the associations between ‘regenerative agriculture’ and diversified pasture or forage (aware and use: OR = 3.27; 95% CrI: 1.71–6.42) and composting manure (aware only: OR = 1.70; 95% CrI: 1.01–2.82) remained credible, as did the negative associations for ‘climate-smart agriculture’ and ‘carbon market’. The associations between ecological terms and rotational grazing and grazing-season length were reduced and no longer credible, although all point estimates remained above 1, indicating that these associations are carried in part by certified organic operations.
Discussion
Our findings reveal a persistent disconnect between the climate- and sustainability-related terminology used by government, industry, non-profit and academic actors, and the language dairy farmers use to describe their own management. While 79% of farmers in our sample engaged in at least one sustainable management practice (primarily management-based strategies such as rotational grazing, diversified forage, and composting), awareness and use of common sustainability terms remained limited. Even among practice adopters, only a minority of farmers used terms like ‘regenerative agriculture’, ‘climate-smart agriculture’, ‘carbon farming’, or ‘nature-based farming’ to describe their practices. This suggests that farmers do not readily conceptualize their work within the top-down frameworks used to organize and market sustainability initiatives, raising questions about the on-the-ground resonance of these programs.
Within this broader disconnect, the associations between term engagement and adoption suggest segmentation across communities of practice: an ecological, land-stewardship framing versus a climate-mitigation, market-mechanism framing. The ecological framing, typified by ‘regenerative agriculture’ and ‘nature-based farming’, showed the strongest links with land and grazing management. Farmers who used these terms had higher odds of adopting longer grazing seasons, pasture diversification, and manure composting. This segmentation is consistent with prior research suggesting that farmers’ linguistic choices reflect underlying decision-making orientations corresponding to distinct management approaches (Findlater et al., Reference Findlater, Satterfield, Kandlikar and Donner2018).
This ecological framing is partly associated with organic certification. Certified organic operations, which are required to graze, were both more likely to use regenerative and nature-based vocabulary and far more likely to adopt grazing practices. Adjusting for certification attenuated the associations between ecological terms and rotational grazing and grazing-season length (Table S6 in the Supplementary Material). The association between ‘regenerative agriculture’ and forage diversification and composting persisted after adjustment, indicating that ecological vocabulary signals a management orientation extending beyond certification. Certified operations are also a small minority of the grazing farms in our sample: 85% of respondents who graze are not certified organic. The decoupling of practice from institutional language is therefore most pronounced among precisely those non-certified grazing operations, which represent the larger share of the practitioners that conservation programs seek to reach.
Our measures cover USDA Organic and grassfed certification but not emerging regenerative certifications, such as Regenerative Organic Certified, whose standards invoke the terminology we examine. Whether entering a certification regime that carries a particular vocabulary leads farmers to adopt that vocabulary, and whether doing so narrows or widens the gap between practice and language that we observe among non-certified operations, is a question these data cannot answer and a useful direction for further work.
In contrast, farmers who implemented capital-intensive, climate-relevant manure-based strategies (such as solids–liquids separation, manure aeration, or anaerobic digesters) showed no positive associations with any sustainability terminology. Adopters of solids–liquids separation were less likely to use the term ‘regenerative agriculture’. This pattern suggests that farmers operating capital-intensive manure systems, which are more common on larger, confinement-oriented operations, may be especially unlikely to identify with sustainability language, particularly regenerative and climate-focused vocabulary. The pattern persists despite evidence that manure-based technologies offer substantial greenhouse gas reductions in confinement systems (Miranda et al., Reference Miranda, Tuomisto and McCulloch2015; Aguirre-Villegas et al., Reference Aguirre-Villegas, Larson and Sharara2019; Dida et al., Reference Dida, Garcia and Gonzalez2025; Rotz et al., Reference Rotz, Briggs, Hristov, Leytem, Young, Hagevoort and Mullinax2025). Consequently, farmers operating these systems may be systematically less likely to recognize, access, or participate in market and policy incentive programs, even when their practices offer substantial mitigation potential, reinforcing asymmetric participation across production systems.
Importantly, these practice clusters do not map neatly onto environmental or conservation outcomes. While grazing management and manure composting align with an ecological stewardship philosophy, their capacity to mitigate greenhouse gas emissions is variable (Alemu et al., Reference Alemu, Kröbel, McConkey and Iwaasa2019; Ba et al., Reference Ba, Qu, Zhang and Groot2020; Rotz et al., Reference Rotz, Briggs, Hristov, Leytem, Young, Hagevoort and Mullinax2025), with recent evidence suggesting little difference in whole-farm greenhouse gas footprints between confinement-based and grazing-based dairy operations (Chen et al., Reference Chen, Brask, Sembach, Thorup and Østergaard2026). Ultimately, conservation performance is multifaceted; an operation may simultaneously adopt practices that improve soil health while remaining relatively unengaged in practices that reduce greenhouse gas emissions. Because conservation and climate resilience opportunities exist across all production systems, effective governance must prioritize operation-specific interventions over wholesale shifts between systems (Hunt et al., Reference Hunt, Mitchell and Niles2026; Vargas et al., Reference Vargas, Menezes, Auvermann, Derner, Thoma, Hales, Johnson, Leytem, Place, Plaut, Ritten, Thompson and Stackhouse- Lawson2024).
Across all practices relevant to both confinement-oriented and grazing-based operations, carbon- and climate-oriented terminology showed weak or null associations with farm management. Engagement with terms such as ‘carbon market’ or ‘climate-smart agriculture’ was generally unrelated to practice adoption. This lack of resonance implies that these terms are misaligned with farmers’ own vocabulary and priorities (Barbato and Strong, Reference Barbato and Strong2023; Han and Niles, Reference Han and Niles2023). This gap is consistent with evidence that climate-related terminology circulates unevenly, with scientists and institutions themselves using explicit climate language less frequently in communications with producers than with other stakeholder groups (Getson et al., Reference Getson, Church, Radulski, Sjöstrand, Lu and Prokopy2022). While ecological terms appear to successfully signal a specific management philosophy to a subset of farmers, the null associations for carbon framings indicate that ‘climate-smart’ language has failed to bridge the gap between policy objectives and on-farm decision-making.
This misalignment highlights a vulnerability in voluntary sustainability governance: institutional terminology can create unintended barriers to participation. Where programs are described in this vocabulary, familiarity with it can determine whether farmers recognize them as relevant to their own operations (Rust et al., Reference Rust, Jarvis, Reed and Cooper2021). Consequently, producers who do not use or understand institutional jargon may be overlooked or feel excluded, even when their management practices directly align with program goals (Ulrich-Schad et al., Reference Ulrich-Schad, de Jalón, Babin, Pape and Prokopy2017). By implicitly equating vocabulary usage with program readiness, these initiatives risk prioritizing already well-connected networks, thereby reinforcing existing disparities in information access and uptake (Wilmer et al., Reference Wilmer, Meadow, Brymer, Carroll, Ferguson, Garba, Greene, Owen and Peck2021; Eaton et al., Reference Eaton, Burnham, Robertson, Arbuckle, Brasier, Burbach, Church, Hart-Fredeluces, Jackson-Smith, Wildermuth, Canfield, Córdova, Chatelain, Fowler, el A. Hendawy, Kirchhoff, Manheim, Martinez, Mook, Mullin, Murrah-Hanson, Onabola, Parker, Redd, Schelly, Schoon, Sigler, Smit, van Huysen, Worosz, Eberly and Rogers2022; Hunt et al., Reference Hunt, Thompson and Niles2025).
This selection appears to operate along educational lines. Accounting for farm structure and Plain community membership, formal education was associated with whether farmers used institutional terms to describe their own operations, but not consistently with whether they had encountered those terms at all. What separates producers is therefore not exposure to sustainability vocabulary so much as its adoption as self-description. Outreach and eligibility framed in institutional language may therefore select not for the practices programs aim to encourage, but for producers who already describe their work in program vocabulary—a distinction that matters precisely because the practices themselves are already widespread.
Using the US dairy sector as a case study, our findings indicate that most farmers are neither familiar with nor actively using many sustainability terms frequently employed by governance, corporate, and academic institutions. Because terminology shapes program accessibility, institutional language choices influence who participates in sustainability initiatives and who is inadvertently excluded. Initiatives may achieve greater efficacy by building from farmers’ existing conceptual frameworks. Rather than relying on abstract or externally derived labels, programs should emphasize familiar terms such as ‘sustainable agriculture’ or concrete, high-priority outcomes such as animal welfare, soil health, and farm productivity (Niles et al., Reference Niles, Goldstein, Hunt, Mitchell and Tabor2024). For conservation professionals delivering outreach and technical assistance, meeting farmers with their existing vocabulary is a practical lever for expanding program reach equitably. Continuing to develop voluntary conservation initiatives using institutional labels risks missing the very practitioners whose grazing, forage, and manure management are already delivering meaningful environmental benefits.
Supplementary material
The supplementary material for this article can be found at http://doi.org/10.1017/S1742170526100659.
Data availability statement
The dataset and codebook associated with this article are available through Ag Data Commons at https://doi.org/10.15482/USDA.ADC/31079356.
Acknowledgements
Many thanks to our previous lab members Zachary Goldstein and Sarah Tabor who contributed to the development, implementation, and analysis of the survey. We thank colleagues Nathan Mueller, Ermias Kebreab, and Jasmine Dillon for their feedback throughout the survey design and analysis process. Many thanks to Dairy Management Inc. for the support of this project, and especially thanks to Stephanie Masiello Schuette for sharing her guidance, engagement, and expertise in dairy sustainability.
During the preparation of this work, the authors used ChatGPT-4o/5 (OpenAI) for occasional language refinement, editing, and organizational clarity during proofreading in June and July 2026. During revision, in September 2026, the authors used Claude Opus 5 (Anthropic) to assist with organic-certification and education sensitivity models, formatting supplementary tables, reconciliation of the estimates reported in the text with the model output, and proofreading revisions to the text and response to reviewers. After using these tools, the authors reviewed and edited the content as needed and took full responsibility for the content of the published article.
Author contributions
Conceptualization: L.H., M.T.N.; Data curation: L.H.; Formal analysis: L.H.; Funding acquisition: M.T.N.; Investigation: M.T.N., R.C.M.; Methodology: L.H.; Project administration: R.C.M.; Software: L.H.; Supervision: M.T.N.; Visualization: L.H.; Writing—original draft: L.H.; Writing—reviewing and editing: L.H., R.C.M., M.T.N.
Funding statement
This work was supported by the United States Department of Agriculture, National Institute of Food and Agriculture, Inter-Disciplinary Engagement in Animal Systems (IDEAS) Grant, ‘Productivity, Animal Welfare, and Environmental Implications of Weather Variability for US Dairy Systems’ Award 2021-68014-34141, and Dairy Management Inc. ‘Assessing US Dairy Producer Perceptions Surrounding Climate Change Adaptation and Mitigation Strategies’ Grant 3711-0.
Competing interests
The authors have no competing interests to report.
Ethical standards
This research involved human participants and was reviewed and approved by the University of Vermont Institutional Review Board (protocol STUDY00002329). Prospective respondents were provided with a research information sheet describing the study’s purpose, procedures, risks, compensation and confidentiality protections before beginning the survey, and consent was indicated by proceeding. Participation was voluntary, respondents could decline any question, and they could withdraw at any time.



 Open access

