





Highlights
What is already known?
The I-squared statistic has enjoyed considerable success in meta-analysis. It has recently been stated that, informally, I-squared can be considered to reflect the extent to which confidence intervals displayed in a forest plot do not overlap with each other.
What is new?
We investigate mathematically how I-squared is calibrated to the extent to which confidence intervals do, and do not, overlap. By doing so, we are able to formalise this interpretation of I-squared.
Potential impact for RSM readers
Readers may not be aware of this particular interpretation of I-squared. Our work opens up possibilities, based on forest plots and confidence interval overlap, for measuring inconsistencies in trial results in meta-analysis.
1. Introduction
The I-squared statistic,Reference Higgins and Thompson
1
,
Reference Higgins, Thompson, Deeks and Altman
2
hereafter referred to as
$I^2$
 , has enjoyed considerable success in meta-analysis, to the extent that it will require no introduction to those already familiar with the standard meta-analytic toolkit. Higgins and López-LópezReference Higgins and López-López
3
recently reflected on this statistic and it is a comment made in their paper that motivated the work presented here.
We recognise the limitations of
$I^2$
 statistics, which mostly arise from misunderstanding what they measure.Reference Rücker, Schwarzer, Carpenter and Schumacher
4
–
Reference Hoaglin
6
However, as explained by Higgins and López-López,Reference Higgins and López-López
3
$I^2$
 helps to overcome some of the limitations of other measures, such as tests for heterogeneity and the estimated between-study variance. Furthermore,
$I^2$
 is important in determining the performance of standard methods for meta-analysis,Reference Jackson and Turner
7
and so is useful in theoretical work. This note also sits in the realm of theoretical work and draws on relatively simple statistical results, such as basic properties of the multivariate normal distribution, means and variances, and elementary combinatorics.
This work was motivated by two sentences from Higgins and López-López,Reference Higgins and López-López
3
who state that ‘Informally, [
$I^2$
 ] can be considered to reflect the extent to which confidence intervals displayed in a forest plot do not overlap with each other. This is the rationale for the characterization of
$I^2$
 as a measure of inconsistency’, where the italics are theirs, not ours. This perspective is one that is rarely contemplated or discussed, even by experienced meta-analysts. In this note, we will formalise this statement mathematically and explore its potential implications. This will help us to understand some interesting properties of the
$I^2$
 statistic that may not be widely appreciated.
2. Another perspective
We take equation (3) from Higgins and López-LópezReference Higgins and López-López 3 as our conceptual starting point, namely,

where
$\tau ^2$
 is the between-study variance parameter and
$\sigma ^2$
 is a measure of within-study variance. This presentation is cosmetically different from equation (3) in Higgins and López-LópezReference Higgins and López-López
3
because they use
$i^2$
 to represent this ‘parametric form’ of the computed statistic and they also present this as a percentage. As explained by Higgins and López-López,Reference Higgins and López-López
3
$\sigma ^2$
 is a clearly defined parameter only if all studies have the same within-study variance. Otherwise,
$\sigma ^2$
 needs to be interpreted as a ‘typical’ within-study variance across the studies included in the meta-analysis. There are numerous different ways for computing a ‘typical’ within-study varianceReference Higgins and López-López
3
and equation (9) from Higgins and ThompsonReference Higgins and Thompson
1
is conventionally used for this purpose. For the purposes of theoretical work,Reference Jackson and Turner
7
it simplifies matters to assume that the study sizes are not too disparate so that this typical within-study variance is representative of all studies. To simplify presentation, we will ‘assume’ that all studies have the same within-study variance
$\sigma ^2$
 , but, in reality, this is just an approximation whose accuracy will depend on the distribution of the within-study variances. Our main focus lies in how the probability that study-specific confidence intervals do, and do not, overlap depends on
$I^2$
 , motivated by the statement made by Higgins and López-López.Reference Higgins and López-López
3
2.1. The probability that confidence intervals in a forest plot overlap
Consider, without loss of generality, the first two study estimates under the random-effects model,Reference Higgins, Thompson and Spiegelhalter
8
,
Reference DerSimonian and Laird
9
$Y_1 \sim N(\mu , \sigma ^2+\tau ^2)$
 and
$Y_2\sim N(\mu , \sigma ^2+\tau ^2)$
 . Assuming that the within-study variances are known without error, the corresponding 95% confidence intervals, displayed on a forest plot, are given by
$(Y_1 - 1.96\sigma , Y_1 + 1.96\sigma )$
 and
$(Y_2 - 1.96\sigma , Y_2 + 1.96\sigma )$
 . If
$-2\times 1.96\sigma < Y_2 - Y_1 < 2\times 1.96\sigma ,$
 then their 95% confidence intervals overlap. This is because these confidence intervals extend
$1.96\sigma $
 in each direction from
$Y_1$
 and
$Y_2$
 , so that we have overlap if the absolute difference between the point estimates is less than
$2\times 1.96\sigma $
 . Let us define
$D=Y_2 - Y_1 \sim N(0, 2(\sigma ^2+\tau ^2))$
 . Then the probability that the 95% confidence intervals in a forest plot overlap,
$P(\text {overlap})$
 , is

Defining
$Z=D/\sqrt {2(\sigma ^2+\tau ^2)} \sim N(0,1)$
 , we can write this as

Then, from the definition of
$I^2$
 in equation (1),

Noting that Z is standard normal, this is

where
$\Phi (\cdot )$
 is the standard normal cumulative distribution function. The key function is
$f(I^2) = \sqrt {2}\times 1.96\sqrt {1-I^2}$
 . Using this definition, we have

There are many equivalent ways to write this quantity but we cannot make further analytical progress. From the symmetry of the normal distribution,
$\Phi (-x) = 1- \Phi (x)$
 , we can write this as

There are
$n(n-1)/2$
 pairs of confidence intervals, where n is the number of studies. Therefore, the expected number of pairs of confidence intervals that overlap on a forest plot,
$E(\text {overlap})$
 is

If
$I^2=1/2,$
 then
$f(I^2)=1.96$
 , so that
$P(\text {overlap}) = 2\Phi (1.96) -1 = 0.95$
 . Hence, if
$I^2=1/2$
 , then the probability of confidence interval overlap is equal to the coverage probability of the confidence intervals. The function
$f(I^2)$
 is decreasing in
$I^2$
 , and
$P(\text {overlap})$
 in equation (2) is increasing in
$f(I^2)$
 , so that
$P(\text {overlap})$
 is decreasing in
$I^2$
 . This investigation therefore formalises the statement made by Higgins and López-LópezReference Higgins and López-López
3
that
$I^2$
 can be considered to reflect the extent to which confidence intervals displayed in a forest plot do not overlap with each other. Equation (2) describes this intuition in simple and direct mathematical form.
2.2. The probability that confidence intervals in a forest plot do not overlap
Higgins and López-LópezReference Higgins and López-López
3
focus on
$I^2$
 as reflecting the extent to which confidence intervals displayed in a forest plot do not overlap with each other. We have instead derived results for the probability that these confidence intervals do overlap. We have done this because this simplifies the presentation of our mathematical derivations; we can then evaluate the probability that a normally distributed random variable lies within one interval of finite length (
$-2\times 1.96\sigma < D<2\times 1.96\sigma $
 ), instead of two intervals of infinite length (
$D> 2\times 1.96\sigma $
 or
$D< -2\times 1.96\sigma $
 ). This becomes more useful in Section 2.5 where we calculate the probability that a bivariate normal random variable lies within a finite square, centred at the origin. However, all our results are easily communicated in terms of
$P(\text {not overlap})$
 , which is simply the complement of equation (2). Furthermore, in Section 2.5, we can easily derive the mean and variance of
$1-O$
 , which is the proportion of confidence intervals that do not overlap.
2.3. Other straightforward extensions
Critical values other than
$k=1.96$
 could also be considered, where natural choices are
$k=1$
 and
$k=0.675$
 . The former value uses error bars of one standard deviation and the latter corresponds to confidence interval coverage of 1/2, so that these two values capture typical variation in two different senses. Alternatively, critical values corresponding to other significance levels could also be used. If an alternative value to
$k=1.96$
 is used, then the key function becomes
$f(I^2, k) = \sqrt {2}\times k \sqrt {1-I^2}$
 and all formulae then apply with this new function. If
$k=1.96,$
 then all results simplify to those given previously, so that
$f(I^2, 1.96) = f(I^2)$
 . However, using alternatives to
$k=1.96$
 would require access to the meta-analytic dataset. This is because forest plots are rarely, if ever, presented using alternatives to 95% confidence intervals. This information may however be deducible in some instances from reported aggregate-level information. In practice, without this, it may in any case often be difficult to determine if confidence intervals in published forest plots overlap. This may need to be determined using high-level scans of these plots, and a keen eye or specialist software, unless these confidence intervals are also displayed numerically.
The above analysis required to compute
$P(\text {overlap})$
 in equation (2) is straightforward to generalise to the case where every study has different
$\sigma _i^2$
 . If desired,
$E(\text {overlap})$
 in equation (3) could then be computed by summing the
${n(n-1)}/{2}$
 different values of study pair specific
$P(\text {overlap})$
 . However, the connection with
$I^2$
 would then be lost. The motivation for
$I^2$
 in any case rests on the assumption that a typical within-study variance is suitable. Hence, when investigating the implications of
$I^2$
 statistics mathematically, it is therefore probably most appropriate to consider the case where all studies have the same within-study variance, as we have here.
2.4. Numerical results
In Figure 1, we show the overlap probability (equation (2)) as a function of
$I^2$
 for three values of
$k=0.675$
 (green),
$1$
 (blue), and
$1.96$
 (black). We also show a vertical dotted line at
$I^2=1/2$
 and horizontal lines connecting the curves to the vertical axis at the overlap probabilities, at
$I^2=1/2$
 , of 1/2,
$2\Phi (1)-1=0.683$
 and 0.95, to aid interpretation. The probability that confidence intervals overlap is not very sensitive to the value of
$I^2$
 until this becomes larger than
$1/2$
 , but nevertheless the connections between
$I^2$
 and
$P(\text {overlap})$
 are clear.
Probability of confidence interval overlap as a function of
$I^2$
 for
$k=0.675$
 (green),
$k=1$
 (blue), and
$k=1.96$
 (black). Dotted lines at
$I^2=1/2$
 and the corresponding confidence interval overlap probabilities are also shown to aid interpretation.

Figure 1 Long description
The x-axis is labeled I-squared and ranges from 0.0 to 1.0. The y-axis is labeled Overlap probability and ranges from 0.0 to 1.0. Three downward-sloping curves represent different k values.
* The top curve is black (k equals 1.96), starting near 1.0 probability at I-squared 0.0 and maintaining a high probability until dropping sharply after I-squared 0.8.
* The middle curve is blue (k equals 1), starting at approximately 0.85 probability and decreasing steadily.
* The bottom curve is green (k equals 0.675), starting at approximately 0.65 probability and decreasing steadily.
A vertical dashed line is positioned at I-squared equals 1/2 (0.5). Horizontal dashed lines extend from the y-axis to meet each curve at this vertical line.
* For the black curve, the intersection is at approximately 0.95 probability.
* For the blue curve, the intersection is at approximately 0.68 probability.
* For the green curve, the intersection is at 0.5 probability.
All three curves converge to 0.0 probability as I-squared reaches 1.0.
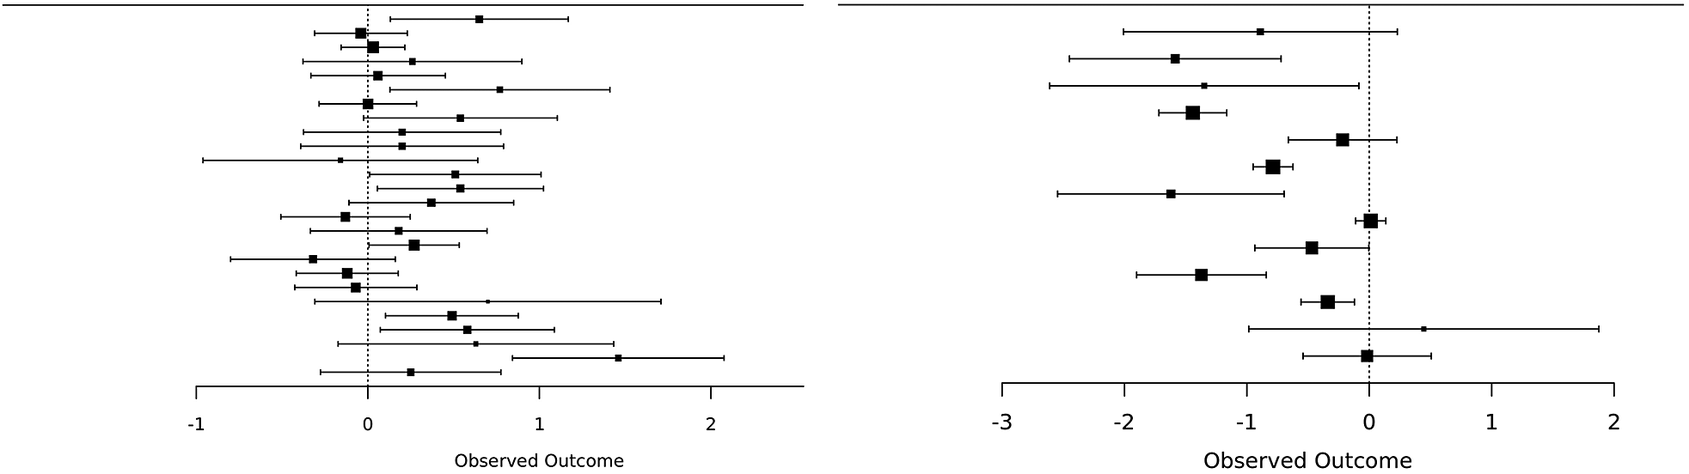
In Figure 2 (left), we show the essential elements of a conventional forest plot for an exampleReference Viechtbauer and Cheung
10
that has been used many times previously in methods work. Briefly, this example includes 26 studies exploring the effectiveness of writing-to-learn interventions. With 26 studies, there are
$26\times 25/2 = 325$
 pairs of confidence intervals that may, or may not, overlap. A standard random-effects meta-analysis, using the DerSimonian and Laird estimatorReference DerSimonian and Laird
9
of
$\tau ^2$
 , using the metafor packageReference Viechtbauer
11
provided
$I^2=55.9$
 %. Metafor was also used to compute a 95% confidence interval for
$I^2$
 of (31.8%, 82.2%).
Essential elements of forest plots examples exploring the effectiveness of writing-to-learn interventions (left) and the BCG vaccine against tuberculosis (right).

Figure 2 Long description
Two forest plots are displayed side-by-side.
Left Panel: Writing-to-learn interventions.
The x-axis is labeled Observed Outcome and ranges from -1 to 2. A vertical dashed line of no effect is positioned at 0. There are 20 individual data points represented by black squares of varying sizes, each with horizontal error bars representing confidence intervals. The majority of the data points are clustered between 0 and 1, indicating a positive effect. Several confidence intervals cross the zero line, while others remain entirely to the right of it. One outlier at the bottom shows a significantly higher positive outcome near 1.5.
Right Panel: B C G vaccine against tuberculosis.
The x-axis is labeled Observed Outcome and ranges from -3 to 2. A vertical dashed line of no effect is positioned at 0. There are 13 data points. The distribution is more spread out compared to the left panel. Most data points and their confidence intervals are located to the left of the zero line, ranging between -2 and 0, suggesting a protective effect. Two data points at the bottom have confidence intervals that cross the zero line, with one point estimate slightly above 0.
A computer program was written to enumerate the number, and proportion, of overlapping 95% confidence intervals in Figure 2 (left). This computed that
$311/325=95.7$
 % of the pairs of confidence intervals in Figure 2 (left) overlap. The majority of 95% confidence intervals therefore overlap, which might be thought to be contradictory to the quite large
$I^2=55.9$
 %. However, computing the overlap probability (equation (2)) with
$I^2=55.9$
 % gives 93.4%. Repeating this calculation with
$I^2=31.8$
 % and 82.2% gives 97.8% and 75.8%. Hence, the
$I^2$
 statistic for this example can be seen to be in good agreement with the proportion of overlapping confidence intervals (Figure 2, left).
In Figure 2 (right), we show the essential elements of a conventional forest plot for another familiar example. Briefly, this example includes 13 studies exploring the effectiveness of the BCG vaccine against tuberculosis and was taken from the metafor package.Reference Viechtbauer
11
This example displays very considerable between-study variation. Analysis, conducted in the same way for the previous example, resulted in
$I^2=92.1$
 %, with 95% confidence interval (81.9%, 97.7%). Here, 55 of the 78 (70.5%) pairs of confidence intervals overlap. Computing the overlap probability (equation (2)) with
$I^2=92.1$
 % gives
$56.4$
 %. Repeating this calculation with
$I^2=81.9$
 % and 97.7% gives 76.2% and 32.6%. Hence, the
$I^2$
 statistic for this example can also be seen to be in agreement with the proportion of overlapping confidence intervals (Figure 2, right).
We have used two examples with notable between-study heterogeneity because, as noted above, the probability of confidence interval overlap is not sensitive to small values of
$I^2$
 (Figure 1). For examples with moderate or mild
$I^2$
 , for example, less than 30%, the vast majority of 95% confidence intervals will overlap. For examples such as these, analyses like the ones we have conducted would be much less interesting. This is because the conclusion that nearly all confidence intervals overlap, in agreement with the mild
$I^2$
 statistic, would be almost inevitable. In practice, our new results will be insightful for more heterogeneous datasets, such as the two we have explored here. The supplementary materials provide data, and R code, to produce all numerical results.
2.5. Further mathematical considerations
Although the above mathematical analysis requires only very elementary mathematical statistics, we would like to point out some subtle points for those who might consider extending this further. More generally, we might be interested in the properties of the random variable O, defined to be the proportion of confidence intervals in the forest plot that overlap. Let
$N=n(n-1)/2$
 be the number of pairs of confidence intervals in the forest plot, which may or may not overlap. Place the pairs of confidence intervals in a list and let
$I_i$
 ,
$i=1, 2, \ldots N,$
 be an indicator that the ith pair in this list overlap. We can then define

Continuing to assume that all studies have the same within-study variance,
$\sigma ^2$
 , the expected value of O is simply

as given previously in equation (2), where
$P(\text {overlap})$
 is a function of
$I^2$
 .
However, other properties, such as the variance of O, are harder to derive. This is because some, but not all,
$I_i$
 are independent. For example, if
$I_1$
 relates to the confidence intervals from studies 1 and 2, and
$I_2$
 relates to studies 1 and 3, then
$I_1$
 and
$I_2$
 are dependent. This is because the results from study 1 then contribute to both
$I_1$
 and
$I_2$
 , invoking dependence between them. However,
$I_1$
 is independent of
$I_3$
 , if
$I_3$
 relates to studies 3 and 4. This is because estimates from studies 1 and 2 are independent of those from studies 3 and 4. In the former case,
$I_1$
 and
$I_2$
 ‘share studies’ but in the latter case
$I_1$
 and
$I_3$
 do not ‘share studies’ in this way. However, we have that

Hence, because all
$I_i$
 are Bernoulli with probability
$P(\text {overlap})$
 , we have

The main challenge is computing the second term, which consists of covariances, some of which are zero (where
$I_i$
 and
$I_j$
 do not ‘share studies’) and others are non-zero (where
$I_i$
 and
$I_j$
 do ‘share studies’). Some relatively simple combinatorics come to our rescue. Every
$I_i$
 shares a study with exactly
$2(n-2)$
 other
$I_j$
 . This is because two studies are required to define
$I_i$
 . This leaves
$n-2$
 other studies that may be used to define
$I_j$
 , any of which may be shared with either of the two studies that define
$I_i$
 . There are
$N=n(n-1)/2$
 different
$I_i$
 , so that in total there are
$(2(n-2))\times (n(n-1)/2)= n(n-1)(n-2)$
 combinations of
$I_i$
 and
$I_j$
 that share studies and so are not independent. Hence, equation (4) is

where
$I_i^*, I_j^*$
 share a study in their definition in equation (5); the superscripts
$*$
 are intended to emphasise that
$I_i$
 ,
$I_j$
 ‘share studies’. The identity
$N=n(n-1)/2$
 may be substituted into equation (5) so that, in terms of the dependence of the number of studies, this can be written entirely in terms of n.
The more challenging part is evaluating
$\text {Cov}(I_i^*, I_j^*)$
 in equation (5). However, this can be computed as
$\text {Cov}(I_i^*, I_j^*) = E(I_i^* I_j^*) - E(I_i^*) E(I_j^*)$
 , where
$E(I_i^*)=E(I_j^*)=P(\text {overlap})$
 . Hence, only
$E(I_i^* I_j^*)$
 remains to be computed. This is then computed by considering, without loss of generality, the first three estimates
$Y_1$
 ,
$Y_2$
 , and
$Y_3$
 , where
$I_1^*=1$
 if the confidence intervals from studies 1 and 2 overlap, and
$I_2^*=1$
 if those from studies 1 and 3 overlap. Then, under the random-effects model where all studies have the same within-study variance
$\sigma ^2$
 , we have

where
$\textbf {1}$
 is the
$3 \times 1$
 column vector where all entries are one, and
$\mathbf {I}$
 is the
$3 \times 3$
 identity matrix. Now consider the random variables
$D_2 = Y_2-Y_1$
 and
$D_3 = Y_3-Y_1$
 that have distribution

where
$\mathbf {0}$
 is the
$2 \times 1$
 column vector where both entries are zero. Then
$I_1^*=1$
 if
$-2 \times 1.96 \sigma < D_2 < 2 \times 1.96 \sigma $
 , and
$I_2^*=1$
 if
$-2 \times 1.96 \sigma < D_3 < 2 \times 1.96 \sigma $
 . Now consider standardised versions
$Z_2=D_2/\sqrt {2(\sigma ^2+\tau ^2)}$
 and
$Z_3=D_3/\sqrt {2(\sigma ^2+\tau ^2)}$
 , where

Next,
$I_1^*=1$
 and
$I_2^*=1$
 if
$-\sqrt {2} \times 1.96 \sqrt {1-I^2} < Z_2 < \sqrt {2} \times 1.96 \sqrt {1-I^2}$
 and
$-\sqrt {2} \times 1.96 \sqrt {1-I^2} < Z_3 < \sqrt {2} \times 1.96 \sqrt {1-I^2}$
 , respectively. This probability is easily computed using standard software, for example, one call of the pmvnorm function, from the R package mvtnorm, can be used. This is because the region where
$(Z_2, Z_3)$
 results in confidence interval overlap in both instances is simply a finite square centred at the origin. Furthermore, this probability is equal to
$E(I_i^* I_j^*)$
 , which was the last term required to compute
$\text {Cov}(I_i^*, I_j^*)$
 in equation (5). Taking the marginal distributions from the bivariate normal for
$(Z_2, Z_3)$
 above gives the same probability for confidence interval overlap as shown previously in equation (2).
We can therefore write the mean of O solely in terms of
$I^2$
 and its variance in terms of
$I^2$
 and the number of studies. Simulations suggest that the distribution of O can be very skew, especially when
$I^2$
 is moderate or very large. This is because
$P(\text {overlap})$
 is then either close to 1 or 0, respectively. Perhaps not surprisingly, a Beta distribution, with mean and variance matched to that of O, has been found to provide a reasonable approximation for large n. As in Section 2.3, it is mathematically straightforward, but computationally complex, to generalise to the situation where studies have different within-study variances. The connection with
$I^2$
 is then again lost, however. It continues to be straightforward to consider alternative values of k where the analysis in this section simply generalises where 1.96 may be replaced by any other k. One important point of this section is to make it clear that, although the mean of O is easy to compute, other aspects of its distribution are much harder to derive. Hence, this section is intended to provide a ‘safety note’ for those who might consider taking this work further.
3. Discussion
We have shown mathematically how
$I^2$
 relates to the probability of confidence intervals overlapping, and hence to the probability of them not overlapping, on forest plots. Our work is sufficient to show how the distribution of the proportion of overlapping confidence intervals is related to
$I^2$
 .
$I^2$
 statistics have also been proposed in more complicated meta-analytic settingsReference Jackson, Law and Barrett
12
but these have different conceptual bases. It may however be possible to derive new interpretations of these and other measures of heterogeneity in meta-analysis. Study-specific prediction intervalsReference Aert, Schmid, Svensson and Jackson
13
have also been proposed and exploring how they might depend on
$I^2$
 and other quantities may be of interest.
Our work may motivate other possibilities, such as basing measures of between-study heterogeneity on the proportions of confidence intervals that overlap and the extent to which multiple (more than two) of these intervals overlap. Other measures of the extent to which confidence intervals ‘agree’ with each may also be feasible. We leave these ideas as possible avenues for further work.
We tentatively propose that providing the number or proportion of confidence intervals that overlap in a forest plot could be a useful further descriptive statistic. For example, this could be calibrated in terms of its accompanying
$I^2$
 statistic to assess if this statistic is performing well in terms of its property of defining inconsistency in this way. By proposing a Beta approximation to O, further methods work and applications are also facilitated. However, it would be audacious, or even foolhardy, to base any formal statistical inference on O or variations thereof. A safer implication of our work would be to encourage consumers of systematic reviews to visually inspect forest plots even more carefully than they already do. They could also consider reporting statistics such as O, and a new type of
$I^2$
 statistic that is based on ‘back-transforming’ O to
$I^2$
 using the results derived here. Visual inspections of forest plots are vitally important when assessing between-study variation and our work serves to further emphasise this important point.
To summarise, we have uncovered some relatively simple results relating to the interpretation of
$I^2$
 as a measure of inconsistency, defined in terms of the probability of confidence interval overlap (or, equivalently, of non-overlap). We hope that this work will be illuminating for those already familiar with the
$I^2$
 statistic and encourage them to further appreciate its value. Finally, it is perhaps inspiring to note that this work was motivated by the reflection on two sentences from a recently published paper. This may serve to remind us that, sometimes, a few especially well-chosen words can inspire other researchers.
Author contributions
Conceptualisation: D.J., J.P.T.H., and J.A.L.-L.; Data curation: D.J.; Formal analysis: D.J.; Investigation: D.J. and J.A.L.-L.; Methodology: D.J., J.P.T.H., and J.A.L.-L.; Project administration: D.J.; Validation: J.A.L.-L.; Visualisation: D.J.; Writing—original draft: D.J., J.P.T.H., and J.A.L.-L.; Writing—review and editing: D.J., J.P.T.H., and J.A.L.-L.
Competing interests
D.J. is employed by AstraZeneca. The remaining authors declare that no competing interests exist.
Data availability statement
All data are made available in the supplementary materials.
Funding statement
J.P.T.H. is supported in part by the National Institute for Health and Care Research (Grant Nos. NIHR203807, NIHR153861, NIHR168894, and NIHR200181). J.A.L.-L. is supported by the Seneca Foundation—Science and Technology Agency of the Region of Murcia (Grant No. 22064/PI/22).
Supplementary material
The supplementary material for this article can be found at https://doi.org/10.1017/rsm.2026.10125.




 Open access

