INTRODUCTION
In the field of second language acquisition, an increasing number of studies have explored the relationship between the effects of corrective feedback and cognitive abilities such as working memory (Goo, Reference Goo2012; Révész, Reference Révész2012), language analytic ability (Arroyo & Yilmaz, Reference Arroyo, Yilmaz and Gurzynski-Weiss2017; Li et al., Reference Li, Ellis and Zhu2019), overall language aptitude (Yilmaz & Granena, Reference Yilmaz and Granena2016), inhibitory control (Yilmaz & Sağdıç, Reference Yilmaz and Sağdıç2019), and implicit sequence-learning ability (Yilmaz & Granena, Reference Yilmaz and Granena2019). These cognitive abilities can be categorized as explicit and implicit language aptitude, with the former referring to abilities for conscious, effortful information processing and the latter to abilities for unconscious computations of the probabilistic relationships existing in linguistic input. Previous feedback studies mainly examined the mediating effects of explicit language aptitude, and only one recent study (Granena & Yilmaz, Reference Granena and Yilmaz2019) has investigated the role of implicit language aptitude in second language (L2) learning when corrective feedback was provided. This study aims to contribute to the research on aptitude-feedback associations by investigating the relationship between implicit (procedural memory) and explicit (declarative memory and working memory) aptitude and L2 learning when feedback was provided under different timing conditions.
LITERATURE REVIEW
IMPLICIT AND EXPLICIT LANGUAGE APTITUDE
Language aptitude is a set of cognitive abilities predictive of learning rate and ultimate attainment in a second language (Li, Reference Li2015, Reference Li2016, Reference Li and Gurzynski-Weiss2017a). In traditional conceptualization, aptitude consists of three components: phonetic coding, analytic ability, and rote memory (Carroll, Reference Carroll, Parry and Stansfield1990). Research has demonstrated that traditional aptitude is more strongly correlated with the effects of explicit instruction than implicit instruction, suggesting that it is a set of cognitive abilities that are more important in explicit learning than implicit learning (Yilmaz & Granena, Reference Yilmaz and Granena2019), which led to the distinction between explicit and implicit aptitude in recent aptitude research. Explicit aptitude includes traditional language aptitude—the type measured by the MLAT (Carroll & Sapon, Reference Carroll and Sapon2002) and similar tests—as well as other cognitive abilities in the explicit paradigm such as working memory. It is necessary to clarify that rote memory, a component of traditional aptitude, is named declarative memory in the Declarative/Procedural (abbreviated as D/P) model (Ullman, Reference Ullman, Hickok and Small2016). Declarative memory is a type of explicit long-term memory. Implicit aptitude refers to the ability to learn a second language unconsciously and has been operationalized by some researchers (e.g., Granena, Reference Granena2013) as sequence learning, referred to as procedural memory in the D/P model (Ullman, Reference Ullman, Hickok and Small2016). Procedural memory is a type of implicit long-term memory in cognitive psychology and is often contrasted with declarative memory (Goldstein, Reference Goldstein2011). This study investigates the interface between immediate and delayed feedback and three cognitive abilities: declarative and working memory in the explicit paradigm and procedural memory in the implicit paradigm. The following discussion centers on the three types of memory.
Based on the D/P model (Ullman, Reference Ullman, VanPatten and Williams2015, Reference Ullman, Hickok and Small2016), procedural memory stores knowledge about rules characterized as knowledge “how,” including motor skills (e.g., swimming), cognitive skills (e.g., applying grammatical rules), and habit learning. In procedural memory, knowledge is accumulated gradually because the learning process of this system “requires extended practice” (Ullman, Reference Ullman, VanPatten and Williams2015, p. 138) and “repeated exposure” (p. 141). Therefore, the D/P model predicts that language learning occurs in the procedural memory system while learners are integrating and applying knowledge during activities involving massive exposure and repeated practice. A wide range of tests has been adopted to measure procedural memory, such as the Serial Reaction Time (SRT) test, which measures the difference between learners’ reaction time to a patterned and a random sequence (Brill-Schuetz & Morgan-Short, Reference Brill-Schuetz and Morgan-Short2014); the Tower of London task, which calculates the improvement in learners’ reaction time while completing a set of learning trials that require learners to move three balls between three pegs following certain rules (Kaller et al., Reference Kaller, Unterrainer and Stahl2012); and the Weather Prediction tasks, where learners predict weather conditions based on patterns of tarot cards (Brill-Schuetz & Morgan-Short, Reference Brill-Schuetz and Morgan-Short2014).
Declarative memory, according to the D/P model (Ullman, Reference Ullman, VanPatten and Williams2015, Reference Ullman, Hickok and Small2016), stores semantic and episodic knowledge, both of which are referred to as knowledge “that.” In contrast to procedural memory, learning in the declarative memory system occurs rapidly “with as little as a single exposure of the stimulus” (Ullman, Reference Ullman, VanPatten and Williams2015, p. 138). Ullman predicts that for both L1 and L2, learning occurs initially in the declarative memory system and subsequently in the procedural memory system where declarative knowledge is applied and practiced. Declarative memory has been measured through tests tapping two types of memory: semantic and episodic. In a test of semantic memory, learners are required to memorize the associations between pictures and words or between unknown words. An example test of the former ability is the LLAMA_B (Hamrick, Reference Hamrick2015) and of the latter is Part V of the MLAT (Faretta-Stutenberg & Morgan-Short, Reference Faretta-Stutenberg and Morgan-Short2018). A test of episodic memory gauges the ability to recall events encountered in previous experiences, such as the California Verbal Learning Test (Carpenter, Reference Carpenter2008), where learners were presented with categories of words (e.g., animals, vegetables, ways of traveling, and furniture) and then asked to recall them; and the Continuous Visual Memory Task (Morgan-Short et al., Reference Morgan-Short, Faretta-Stutenberg, Brill-Schuetz, Carpenter and Wong2014), where learners were repeatedly presented with certain images in the exposure stage and asked to recognize them among new images in the testing stage.
In this study, another examined cognitive factor that constitutes explicit language aptitude is working memory, a cognitive device responsible for temporarily storing and processing information simultaneously (Li, Reference Li and Gurzynski-Weiss2017a, Reference Li, Loewen and Sato2017b, Reference Li, Godfroid and Hoppin press; Wen & Li, Reference Wen, Li, Schwieter and Benati2019). Working memory involves four components: the phonological loop, the visual-spatial sketchpad, the central executive, and the episodic buffer (Baddeley, Reference Baddeley2018). The phonological loop stores and rehearses auditory information. The visual-spatial sketchpad stores and rehearses information about shapes, colors, and locations. The central executive is responsible for attention control. The episodic buffer is a transitional device between the two storage components (the phonological loop and the sketchpad) and the central executive, its main function being to integrate information from the two stores and establish connections with long-term memory before the integrated information is delivered to the central executive (Li, Reference Li and Gurzynski-Weiss2017b). Two types of working memory tests have been utilized. One gauges learners’ phonological short-term memory, such as nonword repetition (e.g., Carpenter, Reference Carpenter2008) and digit span (e.g., Ettlinger et al., Reference Ettlinger, Bradlow and Wong2014), which only tap the storage function of working memory. The other assesses learners’ ability to store and manipulate information simultaneously. Example tests include listening span (Li, Reference Li2013a), reading span (Révész, Reference Révész2012), and operation span (Li & Fu, Reference Li and Fu2018). Visual-spatial short-term memory has received little attention in second language research.
THE TIMING OF CORRECTIVE FEEDBACK
The timing of corrective feedback can be conceptualized in two ways: online versus offline and immediate versus delayed. The online–offline distinction is based on the context in which feedback is provided, with online feedback referring to feedback provided during a communicative task and offline feedback to feedback provided after a task is completed. The Interaction Hypothesis (Long, Reference Long2015) holds that online feedback is potentially more effective than offline feedback because online feedback is likely more favorable for the acquisition of implicit knowledge—the type of knowledge drawn upon in spontaneous communication—while offline feedback may facilitate explicit knowledge because it is provided in isolation. This view of feedback timing is similar to the framework of Spada’s integrated and isolated form-focused instruction, according to which online feedback constitutes integrated form-focused instruction and offline feedback isolated form-focused instruction. Long further argued that online feedback is ideal because it is provided at a propitious time when the learner is grappling with linguistic forms to meet a communicative need; the corollary is that offline feedback is less favored because it is made available at a time when the communicative need is no longer present. Long also favored recasts over other types of feedback when feedback is provided online because by reformulating an erroneous utterance, a recast juxtaposes the correct and incorrect form, thus enabling the learner to make an immediate comparison between them and providing a cognitive window for L2 learning. Li et al. (Reference Li, Zhu and Ellis2016) pointed out that the superiority of online feedback also lies in the opportunities for proceduralizing the knowledge learned through feedback and the participatory demands for attending to feedback (learners take feedback seriously). Recently, several studies (e.g., Arroyo & Yilmaz, Reference Arroyo and Yilmaz2018; Li et al., Reference Li, Zhu and Ellis2016; Quinn, Reference Quinn2014) have been conducted to investigate the differential effects of online and offline CF. The studies showed that, by and large, online CF was more effective than offline CF, which confirmed the arguments of the Interaction Hypothesis.
The immediate-delayed distinction in feedback timing is made based on the schedule of feedback. It refers to whether feedback is provided at the beginning of an instructional cycle immediately after form-focused instruction is provided or delayed after learners complete some communicative practice (Fu & Li, Reference Fu and Li2020). This distinction can be cast in Skill Acquisition Theory, where learning happens in three stages: declarative knowledge, proceduralization, and automatization (DeKeyser, Reference DeKeyser2007). Declarative knowledge, which refers to knowledge about language, is learned through grammar instruction at the beginning of an instructional cycle. Declarative knowledge is proceduralized through practice, and repeated practice leads to automatized L2 knowledge. Feedback can be provided during immediate practice following the instruction or after a certain amount of practice. With regard to the best timing of error correction, DeKeyser points out that CF should not be provided immediately because it may disrupt the proceduralization of declarative knowledge but it “should not be delayed too much” (DeKeyser, Reference DeKeyser2007, p. 4) because delayed CF could lead to error fossilization. However, DeKeyser did not specify the best time to provide CF. To date, Fu and Li (Reference Fu and Li2020) is the only study investigating the comparative effects of immediate and delayed feedback, and they found an advantage for immediate feedback over delayed feedback. Fu and Li argued that immediate CF was more effective than delayed feedback because (a) errors can be more easily corrected before they are entrenched or proceduralized, (b) the effects of feedback are optimal when it is in close proximity with instruction, and (c) immediate feedback is followed by practice activities where learners can proceduralize the knowledge learned from CF. Based on the findings of this study and studies on online and offline feedback, the researchers recommended addressing errors immediately after instruction and during communicative practice. However, due to limited research, the findings and implications pertaining to immediate and delayed feedback need to be further examined. This study investigates CF timing from the perspective of whether different feedback conditions manipulated on the basis of feedback schedule draw on different cognitive abilities in different ways.
LANGUAGE APTITUDE AND CORRECTIVE FEEDBACK
What has research demonstrated about the role of language aptitude in corrective feedback, the focus of this study? Li (Reference Li and Gurzynski-Weiss2017a) conducted a meta-analysis on the empirical research examining the associations between the effects of oral feedback, on one hand, and language aptitude and working memory, on the other. According to the meta-analysis, language aptitude measured using traditional aptitude tests is a significant predictor of the effects of feedback, with a mean correlation of .42 for immediate effects and .32 for delayed effects. However, when feedback was divided into explicit and implicit feedback, aptitude showed significantly stronger correlations with the effects of explicit feedback than implicit feedback. With respect to working memory, Li (Reference Li and Gurzynski-Weiss2017a) reported that its mean correlation with the immediate effects of feedback was weak but significant, r = .23; however, for delayed effects, the correlation was near zero, r = .08. The meta-analysis further showed that similar to aptitude, working memory’s associations with explicit feedback were significantly stronger than with implicit feedback. A few studies have examined the role of language analytic ability in written corrective feedback (Benson & DeKeyser, Reference Benson and DeKeyser2019; Sheen, Reference Sheen2007; Shintani & Ellis, Reference Shintani and Ellis2015; Stefanou & Revesz, Reference Stefanou and Revesz2015). Overall the studies showed that language analytic ability is important when the feedback encourages learners to “work out the grammar rules for themselves” (Benson & DeKeyser, Reference Benson and DeKeyser2019, p. 719) such as when direct corrections are provided without metalinguistic explanations (Stefanou & Revesz, Reference Stefanou and Revesz2015).
The studies discussed in the preceding text all examined explicit aptitude, and there has been little research on the role of implicit aptitude in corrective feedback and in instructed L2 learning in general. Yilmaz and Granena (Reference Yilmaz and Granena2019) introduced the concept of implicit aptitude into feedback research. They found that implicit aptitude (procedural memory) significantly predicted the effects of recasts while explicit aptitude (phonological short-term memory) was significantly associated with the effects of explicit correction. Based on the results of the study, Granena and Yilmaz proposed a double dissociation hypothesis regarding aptitude-instruction associations, which states that implicit aptitude is involved in implicit instruction but not explicit instruction, while explicit aptitude is drawn on in explicit instruction but not implicit instruction. Several studies have examined the predictive power of procedural, declarative, and working memory under different learning conditions (Antoniou et al., Reference Antoniou, Ettlinger and Wong2016; Ettlinger et al., Reference Ettlinger, Bradlow and Wong2014). These studies did not examine how the three types of memory are related to feedback, but one commonality between the studies and the current study is that they examined the three types of memory simultaneously. Thus, their findings may provide useful implications for the roles of the three types of memory in the effectiveness of L2 instruction. The studies by Ettlinger et al. (Reference Ettlinger, Bradlow and Wong2014) and Antoniou et al. (Reference Antoniou, Ettlinger and Wong2016) showed that under an incidental learning condition, procedural memory was implicated in the learning of a simple structure, declarative memory was involved in the learning of a complex structure, and working memory was not a significant predictor of any learning outcomes. Faretta-Stutenberg and Morgan-Short (Reference Faretta-Stutenberg and Morgan-Short2018) revealed that for study-abroad learners, procedural memory was a significant predictor of their grammaticality judgment test scores, and that procedural and working memory were significant predictors of learners’ changes in neurological processing during their study-abroad experience. For at-home learners, however, none of the three types of memory was a significant predictor of any outcome variable. Overall these studies suggest that (a) the three memory abilities have differential roles under different learning conditions, (b) procedural memory seems to be a consistent predictor, and (c) working memory seems to be the least consistent predictor. The weak predictive power of working memory is probably because the studies either involved incidental learning or study-abroad experience, and in both cases learners did not face a heavy cognitive load resulting from online information processing, which would have tapped working memory resources.
There has been no research on the interface between procedural, declarative, and working memory and the timing of corrective feedback—the focus of this study. Theoretically, the three types of memory may play a prominent role in mediating the effects of immediate and delayed CF. Based on the D/P model (Ullman, Reference Ullman, VanPatten and Williams2015, Reference Ullman, Hickok and Small2016) and Skill Acquisition Theory (DeKeyser, Reference DeKeyser2007), it can be hypothesized that procedural memory will be involved in delayed feedback while declarative memory in immediate feedback. Procedural memory will correlate with the effects of delayed feedback because the feedback is provided after several treatment sessions, at a stage where declarative knowledge is practiced and proceduralized. Declarative memory will be involved in immediate feedback because the feedback is provided at the beginning of the instructional cycle, when declarative knowledge is learned through grammar instruction and solidified through feedback. Working memory, a third cognitive ability examined in this study, can be predicted to be important in both immediate and delayed feedback. This is because the feedback in both conditions is provided during communicative tasks and requires the learner to employ their working memory recourses to store and process the information contained in feedback simultaneously. Working memory is essentially a cognitive device implicated in situations that involve online information processing, not in situations in which learners are alleviated from the burden of handling incoming stimuli under time pressure.
The review of the literature shows that the research on aptitude and feedback has focused predominantly on explicit aptitude, and there is a need to examine the joint and unique effects of implicit and explicit aptitude on L2 development. This study examines the interaction between aptitude and feedback from a unique and novel perspective—the relationships between three types of memory representing implicit and explicit aptitude and the timing of corrective feedback. Specifically, the study seeks to answer the following question:
What are the roles of procedural, declarative, and working memory in the acquisition of the English past tense under immediate, delayed, and no feedback conditions?
METHODS
PARTICIPANTS
The participants were 112 seventh-grade EFL students enrolled in a private school in Eastern China, with an average age of 12.94 years. According to the school’s curriculum, the participants received about 4.5 hours of English instruction each week that included six English lessons each lasting 45 minutes. Among the six lessons, five were integrated lessons targeting all skills and one focused on speaking. The participants were divided into three groups and received immediate CF (n = 39), delayed CF (n = 39), or no CF (n = 34), depending on their group assignment. The participants met the researcher (the first author) outside their regular classes and received a gift for their participation after completing the final posttest. One-way ANOVA did not detect significant between-group differences in their overall L2 proficiency represented by their mid-term examination scores, F (2, 109) = .69, p = .50, their pretest scores on the untimed grammaticality judgment test, F (2, 107) = 1.90, p = .15, and their pretest scores on the elicited imitation test, F (2, 101) = 3.00, p = .06.
TARGET STRUCTURE
The English simple past tense was selected as the target structure based on the following considerations. First, the literature shows that it is challenging for Chinese EFL learners to use the English simple past tense accurately, partly because the learners’ L1, Mandarin Chinese, does not have tense morphology (Yang & Lyster, Reference Yang and Lyster2010). Second, the participants’ limited prior knowledge of the target structure, represented by their low pretest scores (out of 24, the learners scored an average of 3.15 on a grammaticality judgment test and 3.32 on an elicited imitation test), may avoid possible ceiling effects on their L2 development.
INSTRUCTIONAL TREATMENT
The instructional treatment lasted about 4.67 hours and consisted of three components: (a) a mini grammar lesson, (b) six communicative tasks each lasting about 45 minutes, and (c) immediate and delayed feedback treatments operationalized as corrective recasts.
Mini Grammar Lesson
A 10-minute grammar lesson was provided to the learners prior to their performance of the six communicative tasks. The grammar lesson followed VanPatten’s (Reference VanPatten and VanPatten2004) Processing Instruction, which involves three steps. First, the researcher explained the metalinguistic knowledge of the English past tense to the learners. The provision of explicit grammar instruction about the target structure was crucial for the learners because their insufficient prior knowledge of the target structure may prevent them from generating self-corrections during the CF treatments. Self-correction is an integral component of the feedback provided in this study, which consists of a prompt that encourages self-corrections followed by a recast in the absence of a self-correction. Self-correction, which constitutes successful uptake (responses after feedback), can potentially enhance feedback effects (Loewen, Reference Loewen2005). Second, the researcher reminded the learners to pay attention to the differences in how the past tense is represented or encoded between Chinese and English. Finally, the learners were required to complete a structured input activity assisting them to build correct form-meaning connections. During the activity, the learners had to understand the times of the events of given sentences based on tense markers because time expressions were not included in the input (see Appendix A).
Communicative Tasks
The participants completed six communicative tasks during the three treatment sessions to elicit and practice the target structure. The tasks included two dictogloss tasks in Session 1, a spot-the-difference task and a sequencing task in Session 2, and two dictogloss tasks in Session 3. The tasks were implemented according to the following steps (Li et al., Reference Li, Zhu and Ellis2016):
-
1. Leading in. The learners watched a short video, sang a song related to the topic of the task (e.g., friendship), or answered some topic-related questions (e.g., who is your best friend?), which aimed to activate their schemata about the topics and instigate their interest in the task.
-
2. Providing input. After the lead-in activity, the learners read a list of keywords aloud after the instructor to get familiar with the vocabulary that would appear in the upcoming tasks. Following the vocabulary familiarization stage, for each dictogloss task, the instructor narrated the input material three times, which was an incomplete story and therefore required the learners to provide an ending. The instructor read at a normal speech rate for the first and the last round of reading, and during the second reading, the instructor presented the narrative through 10 PowerPoint slides. The instructor paused for about 5 seconds between every two slides and read the target verbs with prosodic emphasis to draw learners’ attention to the linguistic target. The learners were given a set of pictures to follow throughout the task. For the spot-the-difference task and the sequencing task, the learners were provided with input materials consisting of a written text and a set of pictures. They then studied the materials for 5 minutes before engaging in group work, which is the next step.
-
3. Group work. After the input-providing stage, the learners worked in groups to prepare for group presentations. During the dictogloss task, the students worked in groups of four to put the task pictures into the order introduced by the researcher, retell the story, and create a sensible story ending. For the spot-the-difference task and the sequencing task, the learners worked in pairs to locate 12 sets of differences between their pictures or to reach an agreement regarding the sequence of the given pictures. Learners were encouraged to complete the tasks using the target verbs listed below each picture.
-
4. Public reporting. For each dictogloss task, each group presented their completed story with a made-up ending. Two students described six pictures, three for each, and the other two students described four pictures including the story ending, two for each. The dicogloss tasks were completed in the first and final treatment sessions. The Immediate CF group received feedback in the reporting stages of the dictogloss tasks in the first session, and the Delayed CF group received feedback in the final session. The Task Only group did not receive feedback. For the spot-the-difference task and the sequencing task, each pair shared their identified differences and sequenced story with the audience. Feedback was not provided during these two tasks, which were completed in the middle treatment session.
-
5. Wrap-up. In the end, the researcher asked the participants to vote for the most interesting story ending for each dictogloss task and the best-sequenced storyline for the sequencing task. For the spot-the-difference task, the researcher checked the accuracy of the reported differences and handed out prizes to those who successfully identified all the differences.
The topics of the communicative tasks were related to learners’ daily life at school or at home, such as friendship, a bad day, and planting pumpkins. Twelve target verbs were seeded in each of the six tasks to ensure that the learners had equal opportunities to practice the target verbs. The researchers created the task materials and consulted the students’ English teachers for their appropriacy before finalizing all the materials for this study.
Corrective Feedback
In the first and final treatment sessions, the Immediate and Delayed CF group received CF treatments operationalized as corrective recasts, a concept introduced by Doughty and Varela (Reference Doughty, Varela, Doughty and Williams1998). A corrective recast involves two moves: an output-prompting move aiming at eliciting a self-correction, followed by an input-providing move if a self-repair is not provided or is not successful. The effects of corrective recasts have been frequently reported in CF literature (Erlam & Loewen, Reference Erlam and Loewen2010; Li et al., Reference Li, Zhu and Ellis2016; Quinn, Reference Quinn2014; Zhao & Ellis, Reference Zhao and Ellis2020). Li et al. (Reference Li, Zhu and Ellis2016, p. 280) commented that it is a “potentially ideal CF strategy” because it incorporates the benefits of both output-prompting and input-providing CF strategies (Long, Reference Long2015; Lyster, Reference Lyster2004). In this study, corrective recasts were implemented by adhering to the following steps. When a learner produced an erroneous form of the English past tense, the researcher repeated the error with a prosodic emphasis and a rising tone, with a view to eliciting a self-repair. The researcher waited for about 5 seconds for a self-correction. If the presenter was able to conduct a successful self-correction, the researcher confirmed the correct sentence produced by the presenter and signaled the presenter to continue his/her speech. If the presenter’s self-correction was unsuccessful, the researcher reformulated the erroneous sentence to provide the correct form.
During the public presentation stage where individualized corrective feedback was provided to the presenter, other students were required not to interact with the instructor in order to control the influence of peer correction. The Immediate CF group received a larger number of CF treatments (N = 58) than the Delayed CF group (N = 39), and the Delayed CF group generated more successful self-repairs (N = 11) than the Immediate CF group (N = 7). The methodological details of CF treatments in the two CF groups are presented in Appendix C. Figure 1 illustrates the implementation of corrective recasts in this study.
The implementation of corrective recasts.

MEASUREMENT
The participants’ implicit and explicit language aptitude, operationalized as procedural memory, declarative memory, and working memory, was measured through an SRT, a recognition memory test, and an operation span test, respectively. The effects of immediate and delayed CF treatments were gauged through an untimed grammaticality judgment test (UGJT) and an elicited imitation test (EIT). The content and procedures of each test are explained in the following sections.
Procedural Memory
An SRT was used to measure learners’ procedural memory (Gabriel et al., Reference Gabriel, Meulemans, Parisse and Maillart2015; Hamrick, Reference Hamrick2015; Kaufman et al., Reference Kaufman, DeYoung, Gray, Jimenez, Brown and Mackintosh2010; Lum & Kidd, Reference Lum and Kidd2012). During the test, the learners responded to the head icon of a famous cartoon character displayed in one of the four locations on a computer screen corresponding to one of the four marked buttons (z, x, >., and ?/) on a keyboard. The test consisted of six blocks, including a random block (block 1), four learning blocks (blocks 2–5), and a second random block (block 6) (Hamrick, Reference Hamrick2015). The learners were initially exposed to a random sequence to prevent them from noticing the sequenced pattern in the following learning blocks. They then completed five learning blocks, and in each learning block, an eight-element pattern (1-3-4-2-3-1-2-4) was repeated eight times (Gabriel et al., Reference Gabriel, Meulemans, Parisse and Maillart2015). After completing the five learning blocks, they responded to a random block that did not follow a fixed sequence. There were 10 trial items at the beginning of the test and 64 target items in each block. Altogether, the students responded to 394 items. During the test, the participants were required to press on a corresponding button based on the location of the head icon as quickly as possible. After the completion of the SRT test, the participants were asked if they had noticed any pattern in the landing locations of the head icon. None of the participants reported recognizing a sequence, suggesting that the participants completed the task without engaging in conscious learning of the built-in sequence. Each participant’s procedural memory score was calculated based on their reaction times which were converted to z scores “to control for within-subject variability in motor speed” (Lum et al., Reference Lum, Conti-Ramsden, Page and Ullman2012, p. 1144). Following Hamrick (Reference Hamrick2015), learners’ procedural memory scores were calculated by subtracting the z scores of the final learning block from those of the final random block (procedural memory score = zblock6 – zblock5), and the difference score represented the change in reaction time as a result of repeating the same sequence in the learning blocks.
Declarative Memory
Learners’ declarative memory was measured through a recognition memory test adapted from the test developed by the Brain and Language Lab at Georgetown University. The recognition memory test was presented through DMDX and consisted of two phases, a learning phase followed by a testing phase. In the learning phase, the learners viewed 64 items, including 32 items of real objects such as animals and vehicles and 32 novel objects that are nonexistent. The learners made a real/novel judgment by pressing one of the two shift keys on their keyboards within 6,000 milliseconds. Upon the completion of the learning phase, the participants rested for about 10 minutes. During the testing phase, the learners viewed 64 items, 32 of which were selected from the learning phase (old items) and 32 were new items. The participants had to decide whether they had seen the items before within 6,000 milliseconds by pressing one of the shift keys.
To minimize the effects of response bias, normalized d’ scores (d-prime) were calculated as the indexes of learners’ declarative memory (Lukács et al., Reference Lukács, Kemény, Lum and Ullman2017). The calculation of d’ scores followed three steps. First, the hit rate (the percentage accuracy) and the false alarm rate (the percentage of selecting “old” for new items) of the testing phase for each learner were calculated. Second, the calculated hit rate and the false alarm rate were transformed to z scores. The final d’ scores were calculated by subtracting the z scores of the false alarm rate from the z scores of the hit rate (d’ = z(hit rate) − z(false alarm rate)).
Working Memory
The participants’ individual difference in working memory was measured through an operation span test which has been frequently used in previous CF studies (Li et al., Reference Li, Ellis and Zhu2019). Each test item consisted of a math problem and a letter and was presented through DMDX, which automatically recorded learners’ answers and reaction time for each item. The test included 12 testing sets, with the number of items in each set ranging from four to seven. The number of items in each set is called span size, and each span size is repeated three times, resulting in a total number of 66 testing items. For each item, the learners viewed a math problem and a letter for about 0.2 seconds (e.g., 9 ÷ 3 = 5? F) and made a judgment for the correctness of the math problem while memorizing the letter. The learners repeated the same procedure with the remaining items of the set. After completing the whole set, the learners recalled all the letters following the sequence in which they appeared on an answer sheet.
The scores of the working memory test included three components: the number of correctly recalled letters, the number of accurately judged math problems, and the learners’ mean reaction time for correct judgments. Results of the three components were converted to z scores. Following Li (Reference Li2013a, Reference Li, Sanz and Lado2013b) and Li et al. (Reference Li, Ellis and Zhu2019), the averaged z scores of the three components were the final working memory scores for each participant. Given that a longer reaction time indicated lower working memory ability, reaction times were multiplied by −1 before being converted to z scores to align with scores on other tests.
Tests of Treatment Effects
Treatment effects were measured by means of a written UGJT and an oral EIT. According to Ellis (Reference Ellis2005), UGJTs measure learners’ explicit knowledge of the linguistic target because learners are encouraged to consciously retrieve and apply their knowledge about the L2 without time constraint. EITs gauge learners’ implicit knowledge of the target structure as they have to rely on their intuitive knowledge about the L2 that is retrieved under time pressure. The UGJTs and EITs targeted the same 24 verbs that were recycled in the five versions of the tests. An EIT was always administered before a UGJT at each testing point to limit learners’ access to explicit knowledge during the EIT.
During each UGJT, learners received a booklet with 34 test items, including 24 ungrammatical target items and 10 grammatical distractors. For each item, learners were asked to judge whether the given sentence was grammatical and to correct the error if it was ungrammatical. The full score of the test was 24. One point was allocated to each accurate judgment plus the correct form of the target verb. Partial credits were granted when the answers provided by the learners involved spelling errors (e.g., “aswered” for “answered”). The learners who failed to provide the correct forms of the target verbs were not awarded any points. The first author marked all the testing papers, and around 20% of them were also marked by a PhD student majoring in applied linguistics. The interrater reliability was .98.
The EITs were presented through DMDX and involved 24 test items, each targeting one verb. For each item, learners listened to a statement read by the first author, decided whether the statement applied to them (e.g., “I watched a movie yesterday”) by pressing one of the two shift keys on the keyboard, and finally repeated the statement in correct English. Half of the test items were grammatical and half were ungrammatical. The full mark of each EIT was 24. One point was awarded to each elicited sentence using the correct past form of the target verb. Partial credits were given when the target verbs involved pronunciation errors (e.g., “god” for “got”). The researcher scored all the recordings and about one-fifth of them were also marked by a PhD student majoring in applied linguistics. The interrater reliability was .93.
PROCEDURE
The data collection lasted about 8 weeks. In week 1, the participants completed the pretest, including a written UGJT, an oral EIT, and a vocabulary test assessing learners’ knowledge of the target verbs that would appear in the treatments. In the first treatment session, which was 1 week after the pretest, the three groups performed two dictogloss tasks and only the Immediate CF group received CF treatments during the presentation stage of each task. Immediately after the completion of the two tasks, the three groups completed the first posttest. The second treatment session happened 1 week after the first treatment session. During this session, the three groups performed a spot-the-difference task and a sequencing task, and CF was not provided. One week after the second session, the learners partook in the final treatment session. In this session, the three groups carried out two dictogloss tasks, but only the Delayed CF group received CF treatments during their group presentations. The three groups took posttest 2 immediately after the performance of the two dictogloss tasks. Two weeks after the final treatment session, in week 6, the learners completed posttest 3 and the three language aptitude tests. In week 8, the three groups completed posttest 4 and an exit questionnaire.
ANALYSIS
Multiple regression analysis was performed to analyze the data. The predictor variables of each regression model were the three memory variables (procedural memory, declarative memory, and working memory) and learners’ UGJT or EIT pretest scores. Pretest scores were included as a fourth predictor because they had shown strong predictive power for posttest scores in the literature (Li et al., Reference Li, Ellis and Zhu2019). The dependent or criterion variable for each regression analysis was each UGJT or EIT posttest score for each group. Before the regression analysis, data points with transformed z scores higher than 3.29 or lower than −3.29 were considered outliers (Field, Reference Field2013) and removed from the dataset. Altogether 24 regression models (3 groups × 4 posttests × 2 test modalities) were built, each for one treatment group on one posttest. For each regression model, the four assumptions of multiple regression analysis, including absence of collinearity, linearity, homoscedasticity, and normality of residuals, were checked. Absence of collinearity between the four predictors was checked through a correlation matrix (see Appendix B); the linearity and homoscedasticity were examined through scatterplots; and the assumption of normality was checked through Shapiro–Wilk tests. Given that the results of the assumption tests showed no violation of assumptions, the data were considered suitable for linear regression analysis. For each regression model, the regression coefficients (β) and the significance values (p) of the predictors were reported. Also, after removing the nonsignificant predictors, the adjusted R2 value was calculated and reported, which represents the percentage of the variance explained by the significant predictors of each model.
RESULTS
DESCRIPTIVE STATISTICS
The participants’ procedural memory was measured using an SRT. The learners’ reaction time showed an overall decrease from the first practice block to the final practice block (block 5) and an increase from the final practice block to the following random block (block 6). Paired-sample t tests comparing the reaction time of blocks 5 and 6 showed that the increases in the reaction time of the Immediate CF group (p < .01), the Delayed CF group (p < .01), and the Task Only group (p < .01) were all statistically significant, which suggested that learning had occurred in the SRT (Lum et al., Reference Lum, Conti-Ramsden, Page and Ullman2012). A one-way ANOVA did not detect statistically significant differences among the three groups in their SRT scores, F(2,79) = .05, p = .96. A reliability test showed that the Cronbach’s alpha for the procedural memory test was .89. The means and standard deviations (SD) of the z scores of the learners’ reaction time and their final procedural memory scores are presented in Appendix D.
The learners’ declarative memory was measured through a recognition memory test that included three components: false alarm rate, hit rate, and mean reaction time. It was found that the false alarm rates and hit rates of the three groups were similar, although the Immediate CF group spent slightly more time completing the test. The reliability of the declarative memory test, indexed by Cronbach’s alpha, was .83. Results of a one-way ANOVA showed that the three groups were not significantly different in their declarative memory ability, F(2,106) = .05, p = .95. The means and SDs of the three components of the declarative memory test and those of the composite declarative memory scores (d’) are reported in Appendix E.
The participants’ working memory was gauged using an operation span test. The Cronbach’s alphas were .89, .85, and .79, for reaction time, math judgment, and letter recall, respectively. Similar to the results for the procedural and declarative memory scores, a one-way ANOVA did not detect significant differences among the three groups’ composite working memory scores, F (2, 103) = .17, p = .85. The means and SDs of the three components of the working memory test—reaction time, number of correct math judgments, and number of correctly recalled letters—and the composite working memory scores appear in Appendix F.
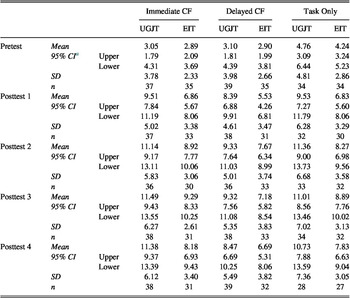
Table 1 displays the means and SDs of the learners’ scores on the two language achievement tests (UGJT and EIT) at the five testing points. Overall, the three groups improved from the pretests to the posttests, regardless of the test format. For the UGJTs, the Immediate CF group achieved greater gains than the other two groups, and the effects of the immediate CF were also better retained than were those of the other two treatments. For the EIT scores, the Immediate CF group also showed the largest development among the three groups, and the L2 gains of the Immediate CF and Task Only groups were better maintained (from posttest 1 to 3) than those of the Delayed CF group (from posttest 1 to 2). The internal reliability of the pretest scores and the four posttest scores, indexed by Cronbach’s alpha, was .92, .95, .94, .95, and .94 for the UGJTs and .66, .62, .68, .76, and .79 for the EITs (Figures 2 and 3).
Descriptive statistics for UGJT and EIT scores.

a 95% confidence interval for mean.
Group means of the UGJT scores at the five testing points.

Group means of the EIT scores at the five testing points.

INFERENTIAL STATISTICS
Table 2 displays the results of the multiple regression analyses on the UGJT scores. The memory variables were not predictive of any UGJT posttest scores for the two CF groups, but declarative memory was a significant predictor of the posttest 3 scores of the Task Only group, β = .39, p = .02. Pretest scores significantly predicted the posttest 1 scores of the Immediate CF group, the posttest 2 scores of the Delayed CF group, and all the posttest scores of the Task Only group.
Significant predictors for the UGJT scores.

a Procedural memory.
b Declarative memory.
c Working memory.
d UGJT pretest scores.
e Standardized regression coefficient.
f Adjusted R2 calculated after removing nonsignificant predictors from the regression models.
g Only the results of the significant predictors are reported in this table.
* p < .05; †p < .055.
Table 3 shows the significant predictors of the four EIT posttest scores in the three groups. The results showed that procedural memory marginally predicted the posttest 2 scores of the Immediate CF group, β = .45, p = .05; declarative memory significantly predicted two posttest scores of the Delayed CF group, β = .36, p = .05 for posttest 2 and β = .39, p = .04 for posttest 4; and working memory was a near-significant predictor of the posttest 1 scores of the Immediate CF group, β = .31, p = .05, and it significantly predicted the posttest 2 scores of the Delayed CF group, β = .52, p = .02. Pretest scores were significantly predictive of all the posttest scores of all groups, except the posttest 2 scores of the Immediate CF group.
Significant predictors for the EIT scores.

a Procedural memory.
b Declarative memory.
c Working memory.
d EIT pretest scores.
e Standardized regression coefficient.
f Adjusted R2 calculated after removing the nonsignificant predictors from the regression models.
g Only the results of the significant predictors are reported in this table.
*p < .05; †p < .055.
DISCUSSION
The results of this study showed that procedural memory predicted the effects of immediate CF, declarative memory predicted the effects of delayed feedback and task only, and working memory predicted the effects of immediate and delayed CF. All the predictive relationships concerned EIT scores, except for the one between declarative memory and the UGJT scores of Task Only. The finding that procedural memory was involved in immediate feedback while declarative memory was implicated in delayed feedback is inconsistent with the prediction of the D/P model. The D/P model (Ullman, Reference Ullman, VanPatten and Williams2015, Reference Ullman, Hickok and Small2016) predicts that procedural memory is more important at later stages of learning when declarative knowledge is being proceduralized, and the research has confirmed the hypothesis empirically (Hamrick, Reference Hamrick2015; Morgan-Short et al., Reference Morgan-Short, Faretta-Stutenberg, Brill-Schuetz, Carpenter and Wong2014). The disparity can be accounted for by consulting the claims of the theory and inspecting the methodological differences between this study and other studies. The D/P model’s prediction is premised on the assumption that declarative knowledge—knowledge about language such as grammar rules—is learned initially in declarative memory, and that declarative knowledge is proceduralized at later stages through practice. This claim fits the studies based on the model where learners are typically exposed to a novel language, such as an artificial language that learners have no previous knowledge about (Hamrick, Reference Hamrick2015; Morgan-Short et al., Reference Morgan-Short, Faretta-Stutenberg, Brill-Schuetz, Carpenter and Wong2014). In these studies, learners are not provided with rule explanations, and grammar or declarative knowledge is learned through meaning-focused comprehension-based activities at the initial stages of instruction. In the absence of grammar instruction, learners must draw on their declarative memory to learn declarative knowledge. In this study, however, grammar was taught via a mini grammar lesson where rule explanation was provided, followed by structured input practice helping the learners build form-meaning connections. The corrective feedback provided immediately after the grammar lesson solidified and reinformed the declarative knowledge learned through the grammar instruction. Thus, the grammar lesson and feedback may have alleviated the burden on declarative memory. The burden on declarative memory was further eased by the fact that the target structure—English simple past—involved transparent form-meaning mapping and therefore constituted a relatively simple structure. Declarative memory may have played a greater role had the target structure been more complex (DeKeyser, Reference DeKeyser2016). The close proximity of feedback to the grammar lesson in this learning condition may have also played a key role in reducing the difficulty in learning declarative knowledge and neutralizing the effect of declarative memory. Therefore, the lack of a significant effect for declarative memory in Immediate CF likely resulted from a combination of the grammar lesson, corrective feedback, the simple target structure, and the contiguity between the grammar instruction and the feedback.
Declarative memory was implicated in Delayed CF as well as Task Only. There are two possible explanations for the significant effect of declarative memory on delayed feedback: one relates to the recall function of declarative memory and one to its learning function. Regarding the recall function, it is possible that the feedback provided on the learners’ wrong use of the past tense prompted them to recall the grammar/declarative knowledge provided to them in the first treatment session that happened 2 weeks before, making associations between the received feedback and the grammar instruction. By the learning function, it is meant that the learners utilized their declarative memory to learn new grammar/declarative knowledge about the linguistic target based on the feedback they received in the final treatment session. The two explanations also apply to Task Only, albeit in slightly different ways. In the Task Only condition, the treatment activities where learners were exposed to tokens of the linguistic target and used the structure in production tasks may have prompted the learners to reflect on the grammar knowledge received during the grammar lesson using their declarative memory; they may have also attempted to acquire new dimensions of the target structure based on the input materials. It needs to be further pointed out that the significant effects for declarative memory were all evident on the second posttests and absent on the first posttest at the end of the first treatment session, suggesting that declarative memory was drawn on in later treatment sessions when grammar instruction was no longer available.
Contrary to what is predicted by the D/P model, procedural memory was involved in immediate feedback, which was provided at an early stage of the instructional cycle, but not involved in delayed feedback, which was provided at a later stage. It is possible that immediate feedback, which was provided after the learners secured declarative knowledge through the grammar lesson, triggered and expedited the proceduralization of declarative knowledge during subsequent communicative practice. It is also possible that the learners in the immediate feedback condition were able to better proceduralize L2 knowledge because of the more solid base of declarative knowledge afforded through the initial grammar instruction and reinforced by the immediate feedback. Proceduralization was less likely to occur in Delayed CF and Task Only, probably due to insufficient declarative knowledge, which in turn was attributable to the lack of immediate feedback that made positive and negative evidence available to the learners. DeKeyser (Reference DeKeyser, VanPatten, Keating and Wulff2020) stated that to optimize proceduralization, learners must have sufficient or a solid base of declarative knowledge. It is necessary to clarify that the significant effects of procedural memory did not surface until the second posttest, similar to studies carried out based on the D/P model where significant effects for procedural memory tended to appear after several treatment sessions (Morgan-Short et al., Reference Morgan-Short, Faretta-Stutenberg, Brill-Schuetz, Carpenter and Wong2014) or sometime after the treatment was completed (Hamrick, Reference Hamrick2015). In this sense, the results of this study did accord with the D/P model. However, the results of this study are seemingly different from Yilmaz and Granena’s (Reference Yilmaz and Granena2019) study, which also examined the relationship between aptitude and corrective feedback. In their study, the significant effects for procedural memory (implicit aptitude) were evident on the immediate posttest that was administered upon the completion of the instructional treatment (the study did not include a delayed posttest). However, a closer inspection of the study revealed that the posttest was given at the end of the second treatment session, not the first treatment session. Therefore, the research has seemed to show one emerging pattern, that is, the effects of procedural memory tend to appear after learners experience a certain dose of training or practice. The amount of training that is required for the influence of procedural memory to surface is unclear, and proceduralization of L2 knowledge is likely subject to multiple factors such as the linguistic target, the intensity of training, the availability of declarative knowledge, and so forth.
Working memory was significantly predictive of the effects of both Immediate and Delayed CF, but not Task Only. This finding is in line with previous findings on the role of working memory in corrective feedback. For example, Li et al. (Reference Li, Ellis and Zhu2019) found that working memory was correlated with the effects of the two treatment conditions where feedback was provided, but not with the effects of the treatment where learners only performed communicative tasks. Li’s (Reference Li and Gurzynski-Weiss2017a) meta-analysis found that working memory showed significantly stronger associations with the effects of explicit feedback than implicit feedback and that the mean correlation for implicit feedback was nonsignificant. Li argued that the strong correlation working memory has with explicit feedback is probably not due to the salience of the feedback as feedback is salient in nearly all feedback studies where a large dose of feedback is provided on a single target structure. Learners have no trouble recognizing the corrective force of feedback, even when implicit feedback is provided. Li continued to argue that what foregrounds the role of working memory in explicit feedback is the heavy processing load imposed on learners while receiving feedback. In this study, the feedback contained a prompt that encouraged learners to self-correct, followed by a recast in the absence of self-corrections. The feedback was not only explicit but also imposed cognitive pressure on the storage and processing functions of working memory, hence the significant effects for working memory in the two feedback conditions and the absence of significant effects for working memory in Task Only where no feedback was provided.
Finally, the study showed that except for the significant associations between declarative memory and the Task Only group’s UGJT scores, all other significant effects related to learners’ EIT scores. UGJT purported to measure explicit knowledge, and EIT was intended to measure implicit knowledge. Theoretically, the effect of procedural memory, which is a measure of implicit aptitude, should be evident on the EIT, and the effects of declarative memory and working memory, which are explicit aptitude, should be evident on the UGJT. However, the hypothesized match between implicit and explicit aptitude, on one hand, and implicit and explicit knowledge, on the other, was not entirely borne out in this study. The effects of declarative and working memory both appeared on the EIT, but not the UGJT. The match is also not confirmed in previous research. For example, Yilmaz and Granena (Reference Yilmaz and Granena2019) demonstrated that procedural memory was significantly correlated with learners’ UGJT scores but not with their scores on an oral production task—a measure of implicit knowledge. Morgan-Short et al. (Reference Morgan-Short, Faretta-Stutenberg, Brill-Schuetz, Carpenter and Wong2014) also found significant effects for procedural memory on a UGJT; and in fact, UGJTs are typically used in studies investigating procedural and declarative memory (e.g., Faretta-Stutenberg & Morgan-Short, Reference Faretta-Stutenberg and Morgan-Short2018; Hamrick, Reference Hamrick2015). It would seem that to researchers in the D/P model, whether measured knowledge is explicit or implicit is less of a concern. Therefore, the links between implicit and explicit cognitive abilities and implicit and explicit knowledge are equivocal and need further theorization and empirical verification. It is possible that implicit aptitude facilitates explicit knowledge and explicit aptitude enhances implicit knowledge. It is also possible that the measures of explicit and implicit knowledge lack construct validity and need further validation.
CONCLUSION
This study investigated the associations between implicit and explicit language aptitude, namely procedural memory, declarative memory, and working memory, and the acquisition of the English past tense under the conditions of Immediate CF, Delayed CF, and Task Only. The results showed that the role of Implicit and explicit language aptitude in L2 learning varied under different CF timing conditions. More specifically, procedural and working memory were predictive of the effects of immediate feedback, and declarative and working memory were predictive of the effects of delayed feedback. The results suggest that the role of declarative memory may be minimized when declarative knowledge is available and when the target structure is simple and that its effects are evident when declarative knowledge is unavailable and/or when learners retrieve information from long-term memory. Procedural memory may start to function when learners have sufficient declarative knowledge and when they are ready to apply the knowledge and integrate it into language use in communicative tasks. Working memory is important when online feedback is provided, especially if the feedback imposes a heavy cognitive load on the learner’s cognitive resources. The results show that the relationship between cognitive abilities and L2 instruction is complicated and dynamic and subject to the subtleties of the learning condition and the available instruction.
The roles of the three types of memory in L2 learning and their interface with instruction type are far from clear, and it is beyond doubt that further research is needed to explore the many unexplored and underexplored territories. For example, what is the relationship between cognitive aptitudes and the nature of the linguistic target? Granena (Reference Granena2013) found implicit aptitude (procedural memory) important for structures involving agreements between linguistic elements such as subject-verb agreement but not structures involving form-meaning mapping. While some researchers (DeKeyser, Reference DeKeyser1995) argue that complex structures are amenable to implicit learning/aptitude and simple structures to explicit learning/aptitude, others find the opposite (Antoniou et al., Reference Antoniou, Ettlinger and Wong2016). Another question is whether the three types of memory impact learning in parallel or in sequence. Both the D/P model and Skill Acquisition Theory seem to suggest that declarative and procedural memory act on learning at initial and later stages and that they do not exert their influence simultaneously. Although initial empirical research seems to have confirmed the hypotheses (Morgan-Short et al., Reference Morgan-Short, Faretta-Stutenberg, Brill-Schuetz, Carpenter and Wong2014), more research is needed before a definitive conclusion can be reached. Working memory, however, seems to “coexist” with either declarative or procedural memory. For example, in this study, both working and procedural memory were involved in immediate feedback, and both working and declarative memory were implicated in delayed feedback. It would seem that as a gateway to long-term memory, which includes declarative and procedural memory, working memory is the initial threshold and can boost the effects of either declarative or procedural memory. However, a related question is how the three types of memory are related to each other. The literature seems to show inconsistent correlations between working and declarative memory, although both are explicit (Antoniou et al., Reference Antoniou, Ettlinger and Wong2016; Faretta-Stutenberg & Morgan-Short, Reference Faretta-Stutenberg and Morgan-Short2018). The picture for their associations with procedural memory seems clearer: neither working memory (Granena & Yilmaz, Reference Granena and Yilmaz2019) nor declarative memory (Hamrick, Reference Hamrick2015) is correlated with procedural memory. We would like to bring up these issues to exemplify directions for future research and encourage researchers to investigate the issues or interpret their findings along these lines.
APPENDIX A
WORKSHEET OF THE SI ACTIVITY
You will hear 12 sentences, and you need to determine whether the action happens regularly (Always) or if it happened in the past (Yesterday).

Input material of the SI activity: 1. I get an e-mail. 2. I broke a cup. 3. I went to school by bus.
APPENDIX B
CORRELATIONS BETWEEN THE FIVE OBSERVED VARIABLES

APPENDIX C
METHODOLOGICAL DETAILS OF THE CF TREATMENTS IN THE TWO CF GROUPS

APPENDIX D
DESCRIPTIVE STATISTICS OF PROCEDURAL MEMORY

APPENDIX E
DESCRIPTIVE STATISTICS OF DECLARATIVE MEMORY

APPENDIX F
DESCRIPTIVE STATISTICS OF WORKING MEMORY