In cases of so-called grammatical variation, speakers have a choice between different syntactic or morphosyntactic constructions that are semantically equivalent. In English, examples of grammatical variation are the competition between the of-genitive and the s-genitive, between the more-comparative and the -er comparative, or the choice between two kinds of object constructions with ditransitive verbs of transfer (e.g., give). The variation between two kinds of object constructions with ditransitive verbs of transfer is commonly referred to as dative alternation. It has been shown that native speakers are sensitive to probabilistic (rather than categorical) factors that govern the selection of a particular variant in a given context. On the basis of such cases of grammatical variation (and other gradient phenomena; see, e.g., the papers in Bod, Hay, & Jannedy, Reference Bod, Hay and Jannedy2003), it has been argued that grammatical knowledge must have a probabilistic component (e.g., Bresnan & Hay, Reference Bresnan and Hay2008). Thus, it can be shown that the probability of finding a particular variant in a certain context in a corpus correlates with the intuitions of speakers in acceptability judgment tasks, given the same context (e.g., Bresnan, Reference Bresnan, Featherston and Sternefeld2007; Bresnan & Ford, Reference Bresnan and Ford2010). Footnote 1 It has also been demonstrated that speakers’ choices depend on a variety of influential factors (such as animacy, syntactic complexity, definiteness) that together determine the selection of a particular variant in a particular context (see, e.g., Mondorf, Reference Mondorf2009, on the comparative; Hinrichs & Szmrecsanyi, Reference Hinrichs and Szmrecsanyi2007, on the genitive; and Bresnan & Ford, Reference Bresnan and Ford2010, on the dative alternation).
The study of second language (L2) syntax has largely focused on the acquisition of syntactic patterns and constructions as such, neglecting phenomena of grammatical variation and the acquisition of probabilistic constraints that govern the selection of variants. This article presents a study of the role of such constraints in advanced German learners of English, focusing on the dative alternation.
In the English dative alternation we find two ways of expressing what seems to be the same kind of event with two different syntactic structures (i.e., either with a prepositional object [PP dative] or with a noun phrase object [NP dative]), with different orders of theme and recipient, as shown in (1).
-
(1) Mary gave the wonderful watch to her mother.
-
Mary gave her mother the wonderful watch.
There is growing consensus in the literature that the constructions in (1) are syntactic variants without any clear semantic differences (e.g., Bresnan & Ford, Reference Bresnan and Ford2010; Bresnan & Nikitina, Reference Bresnan, Nikitina, Uyechi and Wee2009; Bresnan, Cueni, Nikitina, & Baayen, Reference Bresnan, Cueni, Nikitina, Baayen, Bouma, Krämer and Zwarts2007; Collins, Reference Collins1995), contra earlier approaches that tried to attribute the alternation to semantic differences (e.g., Krifka, Reference Krifka2003; Oehrle, Reference Oehrle1976; Pinker, Reference Pinker and Bresnan1982). Recent studies employ various factors such as animacy and syntactic complexity of recipient and theme to successfully predict which structure is chosen in a given context (e.g., Bresnan & Ford, Reference Bresnan and Ford2010; Bresnan & Nikitina, Reference Bresnan, Nikitina, Uyechi and Wee2009; Bresnan et al., Reference Bresnan, Cueni, Nikitina, Baayen, Bouma, Krämer and Zwarts2007).
Most available studies exploring the dative alternation focus on English native speakers of different varieties. Comparatively few studies address the dative alternation in English as a L2 (ESL), and most of these studies were interested in the acquisition of the two syntactic patterns and not in their competition. Furthermore, many of the studies were conducted in the 1980s (e.g., R. Hawkins, Reference Hawkins1987; Le Compagnon, Reference Le Compagnon1984; Mazurkewich, Reference Mazurkewich1981, Reference Mazurkewich1984, Reference Mazurkewich1985), a time in which transformational and semantic approaches were prevalent and little was known about the multiple factors governing the dative alternation. Additionally, statistical methods necessary to make predictions using all of these factors were only beginning to be used in linguistic research. Even recent studies often employ monofactorial analyses to test whether the predictors that are influential in English as a first language (L1) have an effect on learner language as well (e.g., the effect of length and information status; Callies & Szeczesniak, Reference Callies, Szczesniak, Walter and Grommes2008, or the given-new distinction; Chang, Reference Chang2004). There is an absence of studies that employ the kind of multifactorial analysis that would be necessary to substantiate claims about individual factors or general tendencies. The present study seeks to fill this gap.
The study of probabilistic constraints in L2 acquisition raises new questions concerning the role of transfer and of processing constraints in the development of grammatical knowledge. Transfer is usually discussed assuming a nonprobabilistic, categorical view of grammar (see, e.g., the full transfer/full access hypothesis by Schwartz & Sprouse, Reference Schwartz and Sprouse1996), and there is little work on how transfer may influence the acquisition of probabilistic constraints.
In a categorical transfer approach to the problem, one may want to predict for German learners of English that there are no transfer effects because the syntax of German also employs NP datives and PP datives. If frequency is allowed to play a role in transfer, learners should prefer the double object construction, in which the recipient precedes the theme, over the PP dative because this is the most frequent word order in German dative constructions (Pechmann, Uszkoreit, Engelkamp, & Zerbst, Reference Pechmann, Uszkoreit, Engelkamp and Zerbst1994).
However, what is the real nature of these probabilistic constraints? It has been argued that at least some of the probabilistic constraints are, in fact, constraints on processing. For example, an ordering of shorter before longer constituents has advantages for short-term memory (e.g., J. A. Hawkins, Reference Hawkins1994, Reference Hawkins2014). If probabilistic constraints have their origin in processing, it is unclear how such processing constraints can be integrated into a theory of syntactic acquisition. There is one theory, processability theory (Pienemann, Reference Pienemann1998, Reference Pienemann2005), which presents an account of how processing constraints determine the stages of syntactic acquisition. However, this theory addresses the acquisition of L2 morphosyntactic structures and the processing procedures necessary for the implementation of L2 morphosyntactic structures in speech production. The theory says nothing about phenomena of grammatical variation in which, in the case of the dative alternation, two processing procedures for constructing a verb phrase (VP) are in competition. However, if we take the spirit rather than the letter of processability theory, we may want to predict that the structure that is easier to process will be acquired first and will be used more frequently later. This is allegedly the PP dative (e.g., R. Hawkins, Reference Hawkins1987; Mazurkewich, Reference Mazurkewich1981, Reference Mazurkewich1984, Reference Mazurkewich1985).
The present study addresses the aforementioned issues based on a replication of a sentence rating study conducted with L1 speakers of Australian and American English by Bresnan and Ford (Reference Bresnan and Ford2010). The participants in the present study are advanced German learners of English who were asked to rate dative constructions. In particular, we will address the following questions. First, this study examines whether, in general, learners of English prefer the PP over the NP dative, as has often been claimed in the literature (Chang, Reference Chang2004; R. Hawkins, Reference Hawkins1987; Mazurkewich, Reference Mazurkewich1981; Reference Mazurkewich1984; Reference Mazurkewich1985). Second, we test whether the learners’ choices are influenced by the same predictors that have been put forward in the L1 literature and whether these predictors have the same kind of effects in German-English interlanguage.
THE DATIVE ALTERNATION IN ENGLISH (L1 AND L2) AND GERMAN
In this section we will give an overview of different approaches that have been employed to account for the dative alternation in English as a L1 and English as a L2. The examples in (2) illustrate the structures at issue, with the pertinent terminology.
-
(2) a. Prepositional dative (PP dative):
-
He brought [a pony] NP theme [to my children] PP recipient.
-
-
b. Double object construction (NP dative):
-
He brought [my children] NP recipient [a pony] NP theme.
-
As we will see, many L2 studies on the dative alternation have been carried out on the basis of the results and theoretical implications of pertinent L1 studies.
The Dative Alternation in L1 English
Early generative work has centered around questions such as what the underlying or base generated structure is (Edmonds, Reference Edmonds1972, Reference Edmonds1976; Fillmore, Reference Fillmore1965; Jackendoff & Culicover, Reference Jackendoff and Culicover1971), how preference patterns of individual verbs are to be represented in the lexicon (Jackendoff, Reference Jackendoff1975; Oehrle, Reference Oehrle1976), and whether there are and the extent of semantic differences between the two competing constructions (Krifka, Reference Krifka2003; Pinker, Reference Pinker and Bresnan1982).
Recent work, however, has convincingly shown two things about the alternation. First, the dative alternation is not based on underlying semantic differences. Second, the dative alternation is not a categorical phenomenon but a gradient (i.e., probabilistic) one, which can be statistically modeled using a whole range of predictors (e.g., Bresnan & Nikitina, Reference Bresnan, Nikitina, Uyechi and Wee2009; Bresnan et al., Reference Bresnan, Cueni, Nikitina, Baayen, Bouma, Krämer and Zwarts2007). For example, the categories of alternating and nonalternating verbs proposed in early approaches cannot be upheld because numerous counterexamples to the proposed classification have been found. Verbs such as pull, which have been traditionally classified as nonalternating verbs that permit the PP dative only, can be found in both constructions as shown in (3), taken from Bresnan et al. (2007, p. 73).
-
(3) Nothing like heart burn food. “I have the tums.” Nick joked. He pulled himself a steaming piece of the pie [original emphasis]. “Thanks for being here.”
In contrast to a categorical classification, in which each verb licenses only one constituent order, it has been shown that the dative verbs have a specific lexical bias. This lexical bias is the statistical tendency of each verb to occur in one or the other construction, all else being equal (see Bresnan & Ford, Reference Bresnan and Ford2010, p. 178, for biases of individual verbs). In addition to the verb bias, numerous other predictors have been shown to influence the dative alternation and have been successfully used to predict the occurrence of a particular construction in a certain context. These factors will be briefly discussed in what follows.
One of these factors is syntactic weight. In general, the relative weight (or length) of constituents has been shown to be influential in the choice of syntactic constructions (Arnold, Wasow, Losongco, & Ginstorm, Reference Arnold, Wasow, Losongco and Ginstorm2000; J. A. Hawkins, Reference Hawkins1994). Speakers tend to place long and heavy constituents at the end of a sentence, an effect that is also known as the end-weight principle (e.g., Behagel, Reference Behagel1909; Wasow, Reference Wasow2002). This principle is standardly interpreted as having its origin in processing complexity (e.g., J. A. Hawkins, Reference Hawkins1994, Reference Hawkins2014).
The end-weight principle is reported to have an effect on the dative alternation as well (e.g., Bresnan et al., Reference Bresnan, Cueni, Nikitina, Baayen, Bouma, Krämer and Zwarts2007; Collins, Reference Collins1995). Thus, sentence (4a) is preferred over sentence (4b). In example (4b), nine words have to be processed before the second constituent is recognized; in sentence (4a), it is only three, which makes (4a) preferable to (4b) (see J. A. Hawkins, Reference Hawkins1994; Wasow, Reference Wasow1997, for discussion).
-
(4) a. I gave [Sue] [the almost antique and very expensive watch].

-
b. I gave [the almost antique and very expensive watch] [to Sue].

Another factor that influences the choice of constructions is the type of NP (Aissen, Reference Aissen1999; O’Connor, Anttila, Fong, & Maling, Reference O’Connor, Anttila, Fong and Maling2004; Silverstein, Reference Silverstein and Dixon1976). Pronominal constituents precede nonpronominal ones in the dative alternation. Furthermore, definiteness and animacy are known to play a role in constituent ordering. Definite constituents occur before indefinite ones and animate constituents before inanimate ones (e.g., Bresnan & Ford, Reference Bresnan and Ford2010; Bresnan et al., Reference Bresnan, Cueni, Nikitina, Baayen, Bouma, Krämer and Zwarts2007).
These factors can be summarized in the so-called harmonic alignment pattern, illustrated in (5) (adapted from Bresnan et al., Reference Bresnan, Cueni, Nikitina, Baayen, Bouma, Krämer and Zwarts2007), which summarizes the effects found in their corpus studies.
-
(5) animate before inanimate
-
definite before indefinite
-
pronoun before nonpronoun
-
less complex before more complex
Harmonic alignment was originally used in optimality theory “to preserve hierarchical structure between different prominence hierarchies of constraints” (Bresnan & Ford, Reference Bresnan and Ford2010, p. 183; for details see Aissen, Reference Aissen1999; Prince & Smolensky, Reference Prince and Smolensky1993) but was adapted by Bresnan and Ford (2010, p. 183) to account for the quantitative patterns that can be observed in postverbal constituent ordering with respect to prominence on a linguistic scale of hierarchy. Less prominent constituents have a tendency to fill a less prominent slot in a sentence. For constituent ordering, this means that animate constituents (more prominent) occur before inanimate ones (less prominent), definite ones before indefinite ones, pronouns before nonpronouns, and less complex constituents before more complex ones.
This alignment pattern has consequences for the choice of the two dative constructions. If the recipient is animate, definite, a pronoun, and less complex than the theme, the recipient will have a tendency to precede the theme. This is the order that we can achieve with the NP dative, in which the recipient NP precedes the theme NP. If, however, the theme is animate, definite, a pronoun, and less complex than the recipient, the theme is more likely to occur before the recipient. For this order, the PP dative can be used, in which the theme NP precedes the recipient PP.
According to Bresnan and Ford (Reference Bresnan and Ford2010), the harmonic alignment pattern can possibly be explained by the principle of uniform information density proposed by Tily and colleagues (2009), which states that a sentence rises in information density toward the end. More predictable items are mentioned before less predictable ones. As pronominal, definite, and short constituents are more likely to have been mentioned in earlier discourse than nonpronominal, indefinite, and long ones (see Bresnan et al., Reference Bresnan, Cueni, Nikitina, Baayen, Bouma, Krämer and Zwarts2007, for discussion), nonpronominal, indefinite, and long constituents are also more likely to be more informative.
This principle of uniform information density is in line with another factor that is known to influence the dative alternation: the accessibility of the constituent. The given-before-new principle, proposed, for example, by Smyth, Prideaux, and Hogan (Reference Smyth, Prideaux and Hogan1979), states that constituents that have been mentioned in previous discourse occur before those that have not been mentioned. Thus, we could extend the harmonic alignment pattern by one more claim—namely, given before new.
In addition to the aforementioned factors, other factors such as person and number of theme and recipient, concreteness of theme, and the previous occurrence of a PP dative have been shown to play a role in predicting the dative alternation and other types of syntactic variation. Noun phrases that refer to local persons (i.e., first and second person) have been observed to occur before nonlocal NPs (i.e., third person; Bresnan & Nikitina, Reference Bresnan, Nikitina, Uyechi and Wee2009, p. 27; Bresnan, Dingare, & Manning, Reference Bresnan, Dingare, Manning, Butt and Holloway King2001). The results of the corpus study by Bresnan and colleagues (2007, p. 17) show that plural recipients trigger the double object construction, whereas plural themes trigger a PP dative. The NP dative is also more likely when the theme is not concrete. The effects of all these factors are robust across different varieties of English and also across different types of data and experimental paradigms such as corpus studies, grammaticality judgments, sentence completion tasks, and reading time studies (Bresnan & Ford, Reference Bresnan and Ford2010; Bresnan & Nikitina, Reference Bresnan, Nikitina, Uyechi and Wee2009; Bresnan et al., Reference Bresnan, Cueni, Nikitina, Baayen, Bouma, Krämer and Zwarts2007; Collins, Reference Collins1995).
One problem is, however, that these factors are interdependent. Personal pronouns are always short and definite, usually their referent has been mentioned in previous discourse, and they are often animate. Indefinite constituents are often longer than definite ones because they have not been mentioned before (i.e., they are new) and, thus, need to be described more explicitly than definite ones. These problems are addressed (e.g., by Bresnan et al., Reference Bresnan, Cueni, Nikitina, Baayen, Bouma, Krämer and Zwarts2007, or Bresnan & Ford, Reference Bresnan and Ford2010) by using statistical techniques such as multiple logistic regression and linear mixed-effect models. This solves the problem in so far as the models allow us to look at the effect of one factor while keeping the others constant. However, sometimes a predictor may be inextricably related to another predictor. For example, pronominality inevitably combines the effects of length, definiteness, and accessibility. Such interdependence can cause suppression effects in the statistical models (e.g., Holling, Reference Holling1983). We will discuss such potential problems as we go along.
In spite of the methodological problems multivariate approaches have faced, it has been established in recent studies that the dative alternation is subject to a variety of factors whose simultaneous presence results in a probabilistic rather than categorical choice between the two dative constructions.
Dative Constructions in German
To be able to discuss the possibility of L1 transfer with respect to the dative alternation, we need to inspect German dative constructions. The constituents in the dative construction are case marked in German (subject = nominative case, direct object = accusative case, indirect object = dative case), and permutations of the constituents are allowed, as reported in Pechmann et al. (Reference Pechmann, Uszkoreit, Engelkamp and Zerbst1994) and illustrated in (6) (example taken from Pechmann et al., Reference Pechmann, Uszkoreit, Engelkamp and Zerbst1994, p. 8):
-
(6) Dann wird [der Dirigent] NOM [dem Geiger] ACC
Then will the conductor the violinist
[den Taktstock] DAT geben.
the baton give.
“Then the conductor will give the violinist the baton.”
a. Dann wird der Dirigent [dem Geiger] recipient [den Taktstock] theme geben.
b. Dann wird der Dirigent [den Taktstock] theme [dem Geiger] recipient geben.
c. Dann wird [dem Geiger] recipient der Dirigent [den Taktstock] theme geben.
d. Dann wird [dem Geiger] recipient [den Taktstock] theme der Dirigent geben.
e. Dann wird [den Taktstock] theme der Dirigent [dem Geiger] recipient geben.
f. Dann wird [den Taktstock] theme [dem Geiger] recipient der Dirigent geben.
Pechmann and colleagues (1994, p. 8) claim that all of these sentences are grammatical but vary in their degree of acceptability. These authors show in numerous experiments that the word order displayed in (6a) is prevalent in German, in which the subject is followed by the recipient and the recipient by the theme.
Some verbs (e.g., schicken “send,” senden “dispatch,” überschreiben “sign over”) allow for an additional permutation in which a directional preposition can be inserted, with the recipient as its complement, as shown in example (7). Thus, German also has a kind of PP dative, but the sequencing of NP and PP is not as restricted as in English.
-
(7) Lotte hat den Brief an Monika geschickt.
Lotte has the letter to Monika sent.
“Lotte sent the letter to Monika.”
a. Lotte hat [Monika] NP recipient [den Brief ] theme geschickt.
b. Lotte hat [den Brief] theme [Monika] NP recipient geschickt.
c. Lotte hat [den Brief] theme [an Monika] PP recipient geschickt.
d. Lotte hat [an Monika] PP recipient [den Brief] theme geschickt.
Various attempts to account for these word order alternations have been made in generative and nongenerative frameworks (see, e.g., Büring, Reference Büring, Féry and Sternefeld2001; Lenerz, Reference Lenerz1977; and Røreng, Reference Røreng2011). Røreng (Reference Røreng2011) tests the influence of linguistic factors such as case, animacy, definiteness, and referential status in a corpus study. She finds effects for information structure (topic precedes comment), animacy (animate constituents precede inanimate ones), and case (accusative precedes dative). However, her method does not allow her to account for more than two influencing factors simultaneously, and the very important factor of syntactic complexity has not been considered at all. These are serious drawbacks, as it is hardly possible to model a complex phenomenon like the dative alternation without a multifactorial analysis. Thus, it is unclear whether the effects found by Røreng (Reference Røreng2011) hold when more factors are taken into account.
Animacy, however, has also been found to be influential in another type of word order variation in German (i.e., the order of subject and object; Bader & Häussler, Reference Bader and Häussler2010). In Bader and Häussler’s corpus-based study, a logistic regression analysis revealed that subject and object animacy, the length difference between subject and object, and subject definiteness alongside other linguistic factors influence the order of subject and object when both appear between finite and nonfinite verbs.
In an earlier study, Lenerz (Reference Lenerz1977) observed, among other things, that definite NPs precede indefinite ones and that short NPs precede long ones, as it is the case in the English dative alternation. Büring (Reference Büring, Féry and Sternefeld2001) also shows the effect of definiteness on the constituent ordering in German while controlling for other factors such as animacy and focus.
In sum, we have a situation in which there is no straightforward mapping of German structures onto English structures, with additional lexically determined possibilities and preferences in both languages. However, the studies by Røreng (Reference Røreng2011), Bader and Häussler (Reference Bader and Häussler2010), Büring (Reference Büring, Féry and Sternefeld2001), and Lenerz (Reference Lenerz1977) suggest that some of the factors that play a role in predicting the English dative alternation may also be influential factors in the German dative alternation.
Given the intricate picture of differences and similarities in the two languages, it seems problematic to come up with clear-cut predictions based on transfer. Given that the syntax of German employs both NP datives and PP datives, the categorical transfer approach would predict that both English constructions should be equally difficult to acquire. Under the assumption that frequency plays a role in the transfer of syntactic structures, double object constructions should have a privileged status in German-English interlanguage because NP datives are much more frequent in German.
Alternatively, we can consider the potential role in SLA of the general principles of alignment previously discussed. If they are general, language-independent principles of alignment (similar in status to what, in some approaches, is called Universal Grammar), they should be available to any language user, including L2 learners. Additionally, it has been argued that the general way in which the described factors influence the choice of syntactic variants is not specific to English but reflects crosslinguistic regularities (Aissen, Reference Aissen2003; Bresnan & Nikitina, Reference Bresnan, Nikitina, Uyechi and Wee2009; Bresnan et al., Reference Bresnan, Dingare, Manning, Butt and Holloway King2001; Wolk, Bresnan, Rosenach, & Szmrecsanyi, Reference Wolk, Bresnan, Rosenbach and Szmrecsanyi2013). This view is supported for dative constructions by the (admittedly scarce) evidence from German. However, it seems that different languages show different degrees of grammaticalizing such principles (e.g., J. A. Hawkins, Reference Hawkins1994), so that learners still have to find out the extent to which the grammar is actually determined by such principles. This would enable us to rephrase the question of transfer by asking how the process of fine-tuning the universal determinants of syntactic choices in a L2 is influenced by the L1.
One hypothesis would be that, at early stages, the choices are still very much influenced by the constellation of factors as found in the L1. Another conceivable hypothesis would be that, initially, the learners would disregard the factors in spite of their potential role in their L1, and the learners would only later and gradually acquire some sensitivity toward alignment factors.
What is clear is that simplistic categorical approaches to transfer along the lines of the full transfer/full access hypothesis seem to be impossible to apply to probabilistic grammatical phenomena such as the dative alternation.
The Dative Alternation in English as a L2
Research on the dative alternation in ESL is scarcer. Most studies focus on the acquisition of the verbal categories (i.e., the distinction between alternating and nonalternating verbs). Some studies, however, explore some of the other factors that are influential in the dative alternation in L1 English. In the majority of studies, grammatical judgment tasks were used, and the analyses were mostly monofactorial, even though some studies explored more than one variable. Many studies did not explicitly distinguish between themes and recipients but merely tested whether the predictor in question influences the speaker’s choice, irrespective of thematic roles.
One major question that arises from existing work is whether learners have a preference for the PP construction, either in usage or in terms of sequence of acquisition. The evidence for these preferences, however, is not uncontroversial.
Chang (Reference Chang2004), who investigated Chinese learners, observed that intermediate learners have a general preference for the PP dative. She argues that this is possibly a result of the order of acquisition of the dative constructions or that the PP dative is cognitively less complex and thus preferably used by learners. A forced-choice questionnaire study by Führer (Reference Führer2009), which was conducted to investigate the acquisition of the verb bias by advanced German learners, revealed a general preference for the PP dative in comparison to the L1 speaker control group as well.
With regard to the order of acquisition, it has been claimed many times that the PP dative is acquired before the NP dative (R. Hawkins, Reference Hawkins1987; Le Compagnon, Reference Le Compagnon1984; Mazurkewich, Reference Mazurkewich1981, Reference Mazurkewich1984, Reference Mazurkewich1985; Tanaka, Reference Tanaka1987). Mazurkewich (Reference Mazurkewich1984) used grammaticality judgment tasks to show that French and Inuit subjects acquired the PP dative before the NP dative. Le Compagnon (Reference Le Compagnon1984) observed the same sequence of acquisition in a case study and with grammatical judgment tasks with French subjects.
Tanaka (Reference Tanaka1987), who investigated Japanese subjects using translation and grammatical judgment tasks, observed that the NP and PP dative are used equally often with the verb give but that the PP dative is preferred in nonprototypical dative constructions, with the hypothesized prototype shown in (8).
-
(8) NPi [+source, +human], NPk [+theme, +alienable], NPj [+goal, +human].
Mary gives a ball to Tom.
The term alienable is used to refer to themes (e.g., a ball) that can change the possessor, whereas inalienable themes cannot change their possessor (e.g., heart attack). What is coded as alienability by Tanaka (Reference Tanaka1987) corresponds to different semantics of the verb give as put forward in Bresnan et al. (2007, p. 22). Give someone a heart attack is an abstract reading of the verb give, whereas give someone a ball denotes a transfer of possession. Tanaka also observed that the acceptance of the PP dative decreases with increasing proficiency.
Mazurkewich (Reference Mazurkewich1985) investigated learners’ acquisition of the dative alternation in questions and passives, and R. Hawkins (Reference Hawkins1987) investigated passives. These studies confirm the previously mentioned sequence of acquisition. However, the results of these studies can neither be straightforwardly generalized to clauses in the active voice nor be used to argue that the PP structure is acquired earlier than the NP structure. The reason is that the observed preference of PP datives in passives and questions can also be explained in terms of well-known effects of cognitive complexity. Rohdenburg’s (Reference Rohdenburg1996) complexity principle states that “…the more explicit [grammatical option(s)] will tend to be favored in cognitively more complex environments” (p. 151). Thus, the explicitly marked structure (i.e., the PP dative) is expected to occur in interrogatives and passives more often because these structures are more complex than affirmatives (Aarts, Reference Aarts2008).
Apart from the question of which structure is acquired first and preferably used by learners, studies have looked at the influence of the verb (Callies & Szczesniak, Reference Callies, Szczesniak, Walter and Grommes2008; Davies, Reference Davies1994; R. Hawkins, Reference Hawkins1987; Inagaki, Reference Inagaki1997; Mazurkewich, Reference Mazurkewich1981, Reference Mazurkewich1984, Reference Mazurkewich1985; Wolk, Wolfer, Baumann, Hemforth, & Konieczny, Reference Wolk, Wolfer, Baumann, Hemforth, Konieczny, Carlson, Hölscher and Shipley2011). Based on the assumption that there are alternating and nonalternating verbs, many studies investigated whether learners are aware of the fact that certain verbs only license one of the constituent orderings. Callies and Szczesniak (Reference Callies, Szczesniak, Walter and Grommes2008) conducted a corpus-based study and concluded that German and Polish learners acquire the difference between alternating and nonalternating verbs. Mazurkewich (Reference Mazurkewich1984) also claimed that learners acquire the verbal categories. Her study was, however, heavily criticized for methodological weaknesses, poor subject selection, and too small samples (see Kellerman, Reference Kellerman1985, for discussion).
A related issue was dealt with by Inagaki (Reference Inagaki1997) for Chinese and Japanese learners of English. He used verbs of four different classes: the whisper, tell, push, and throw classes. Throw verbs and tell verbs constitute alternating verb classes, whereas the other two are said to not alternate. Inagaki used some nonce verbs of each type to test which of Pinker’s (Reference Pinker and Bresnan1982) rules had been acquired by the learners and found that learners were able to distinguish the verb classes in the tell and whisper classes but not in the throw and push classes. His results must be seriously questioned, as the test items contained an introductory text passage that already contained the structures to be judged by the subjects. Thus, his results are most likely a result of syntactic priming (McDonough, Reference McDonough2006).
A more recent study by Wolk and colleagues (2011) tested whether French learners of English of different proficiency levels had acquired verb biases (what they call soft constraints). Wolk and colleagues (2011) showed, by means of eye-tracking experiments, that learners are sensitive to the verb bias in written and spoken language. Advanced learners are sensitive to verb biases in both directions, whereas intermediate learners are only sensitive to verbs with a bias toward the PP dative.
Definiteness and accessibility are also factors that have received attention in the SLA literature on the dative alternation. Obviously, both factors are intertwined, as accessible (i.e., discourse-given) factors are usually associated with definite NPs. Nevertheless, the present study distinguishes between those predictors. Definiteness refers to the status of the NP only, whereas accessibility taps into whether NPs have been mentioned in earlier discourse or not.
Chang (Reference Chang2004) and Callies and Szczesniak (Reference Callies, Szczesniak, Walter and Grommes2008) investigated the effect of discourse accessibility, as previously defined, but no effects were found. Marefat (Reference Marefat2004) tested the given-new distinction on Persian learners of English but instantiated this difference by means of definite and indefinite NPs so that the results are somewhat inconclusive with regard to the factor causing this the effect. There was no effect for intermediate learners, but advanced learners showed a nativelike preference to place definite constituents before indefinite ones. Tanaka (Reference Tanaka1987) also tested the effect of definiteness but did not find a major effect.
Finally, the effect of syntactic complexity was investigated by Tanaka (Reference Tanaka1987) and Callies and Szczesniak (Reference Callies, Szczesniak, Walter and Grommes2008). Both studies found that learners of English have a nativelike tendency to place short constituents before long ones.
To the best of our knowledge, the effects of pronominality have never been explicitly tested. However, Le Compagnon (Reference Le Compagnon1984) and R. Hawkins (Reference Hawkins1987) observed that the NP dative is used and accepted by French learners of different proficiency levels if the recipient is pronominal.
In conclusion, one can state that a variety of studies has tested different predictors on learners of different L1s and different proficiency levels. Even though some of the studies test more than one predictor, all analyses of the data were monofactorial (with the exception of Wolk et al., Reference Wolk, Wolfer, Baumann, Hemforth, Konieczny, Carlson, Hölscher and Shipley2011), which considerably weakens any conclusions based on these studies.
A number of questions have remained unanswered. First, it is unclear to what extent learners are sensitive to the different factors when all known factors are taken into account at the same time. Second, previous studies have found evidence for a general tendency of L2 learners to prefer the less marked PP dative. However, these studies did not properly control the simultaneous influence of the many factors in their samples. Thus, any conclusion based on such samples rest on shaky foundations. Furthermore, little is known about the individual variation between advanced speakers and their sensitivity toward the different factors.
The present study addresses these questions with the help of an experiment that was successfully implemented in the study of the dative alternation in two varieties of L1 English (Bresnan & Ford, Reference Bresnan and Ford2010). The present paper presents a replication of that experiment with L2 speakers as subjects. The speakers in Bresnan and Ford’s study can thus serve as our control group.
METHODOLOGY
The aim of the present study is to systematically test the predictors that are known to be influential of the dative alternation in English as a L1 on German learners of English. Bresnan and Ford (Reference Bresnan and Ford2010) used a sentence rating task in their study, and they kindly provided us with their experimental stimuli. The test items were specifically chosen to ensure that all relevant factors could be tested. The same sentence rating task was used in the present study. Footnote 2
Materials and Participants
The sentence rating task developed by Bresnan and Ford (Reference Bresnan and Ford2010) was presented to 24 advanced learners of English, all of them native speakers of German. All participants were university students of English who were between 20 and 25 years old. The participants’ proficiency was not tested, but as English is an obligatory subject in German school curricula, all participants had received a minimum of 8 years of formal instruction, and they could therefore be safely assumed to have successfully acquired both variants of the dative construction. Footnote 3 Eight participants had stayed in an English-speaking country for more than 3 months. None of the participants had ever taken a syntax course.
Participation was voluntary and subjects did not receive credits or payment for their participation. The questionnaire was completed, using paper and pencil, during a regular session of a morphology seminar. Completion of the questionnaire was not timed. The instructions were given in German. The participants were told that the researchers were interested in how people choose between two different ways of saying the same thing. Participants were asked to rate which of the alternatives sounded better (i.e., more natural) to them (see Appendix A for the full instructions).
The questionnaire consisted of 30 items, each of which contained a short text passage followed by two dative structures as possible continuations for the text passage, optionally followed by some context. The items were randomly sampled from the Switchboard Corpus (Godfrey, Holliman, & McDaniel, Reference Godfrey, Holliman and McDaniel1992). As Bresnan and Ford wanted items that cover the full range of PP probabilities, they selected items from their corpus study whose modeled probabilities covered the full range of log odds and formed a linear distribution (see Bresnan & Ford, Reference Bresnan and Ford2010, pp. 184–185, for a detailed description). The items were presented to the participants in pseudorandomized order, adjusted to avoid apparent patterns. Examples (9) through (11) show three items.
-
(9) Speaker:
About twenty-five, twenty-six years ago, my brother-in-law showed up in front of my yard pulling a trailer. And in this trailer he had a pony, which I didn’t know he was bringing. And so over the weekend I had to go out and find some wood and put up some kind of a structure to house that pony,
a. because he brought the pony to my children.
b. because he brought my children the pony.
-
(10) Speaker A:
I really use my computer a lot at home. I am an accountant but I work from home. So I use it for that quite often. We have, you know, used some of it for personal things. We keep track of personal budgets and things like that on it. Since it’s tax season, I’m doing a lot of taxes, so I do a lot of work on it as well.
-
Speaker B:
a. I was amazed when I took our taxes to our tax person
b. I was amazed when I took our tax person our taxes
and she works out of her home also. The software that does the taxes is just incredible.
-
(11) Speaker:
I’m in college, and I’m only twenty-one but I had a speech class last semester, and there was a girl in my class who did a speech on home care of the elderly. And I was so surprised to hear how many people, you know, the older people, are like, fastened to their beds so they can’t get out just because, you know, they wander the halls. And they get the wrong medicine, just because, you know,
a. the aides or whoever just give the wrong medicine to them.
b. the aides or whoever just give them the wrong medicine.
The participants were asked to rate which of the alternatives sounded better (i.e., more natural) to them. The participants were asked to distribute 100 points to express their ratings. If they thought continuation (9a) was perfectly fine, but continuation (9b) was not proper English, they could express this by giving 100 points to continuation (9a) and zero points to continuation (9b). If they thought that both continuations were equally fine, they could distribute 50 points to each continuation. Any other splits of points like 23–77 were also possible. The presentation of the items in this way has the advantage that one can be sure which structure the participants judge, as both continuations only differ in one feature. The gradient rating allows for fine-grained results as subjects can express not only the preference for one structure over the other but also the equal acceptance of both of them as well as any fine-grained difference between those three major options. Participants were told that there were no wrong answers and that they should express whichever variant sounded better to them.
Coding
The items were coded for several predictor variables that had been shown to influence the dative alternation in L1 English. The coding, which emulated that of Bresnan and Ford (Reference Bresnan and Ford2010), is briefly summarized in what follows. Footnote 4
-
• Verb: Nine different verb lexemes were used in the sentences to be judged. Each lexeme was treated as one factor level.
-
• Relative syntactic complexity of recipient and theme: The logarithmized theme length in words was subtracted from the logarithmized recipient length in words, which results in the relative length of recipient and theme. By means of logarithmizing, extreme values are compressed (see Bresnan & Ford, Reference Bresnan and Ford2010). The length of the recipient and theme was coded in terms of the number of orthographic words, as this measure has been shown to highly correlate with other measures of syntactic complexity, such as the number of syllables (Grafmiller & Shih, Reference Grafmiller and Shih2011).
-
• Pronominality of theme and recipient: Recipient and theme were coded for pronominality. Pronouns included personal, reflexive, and demonstrative pronouns. All other NPs were considered nonpronouns.
-
• Definiteness of theme and recipient: As described in Bresnan and Ford (Reference Bresnan and Ford2010), pronouns were coded as definite, as were NPs containing a definite article.
-
• Animacy of theme and recipient: As there were only two instances of themes or recipients that were animals, the data were coded for being either animate (including humans and animals) or inanimate (for all others).
-
• Accessibility of theme and recipient: A NP was considered as given if the NP or its referent was mentioned previously in the text passage. In all other instances the NP was considered as not given.
-
• Number and person of recipient and theme: Following Bresnan and Ford (Reference Bresnan and Ford2010), person was coded as local (first and second person) or nonlocal (third person). Number was coded as singular or plural.
-
• Concreteness of theme: Bresnan and Ford (Reference Bresnan and Ford2010) coded the theme for concreteness in their corpus study to make up for the simplified animacy variable. As recipients are mostly animate, Bresnan and Ford did not code the recipient for concreteness. Following Bresnan and Ford, we coded whether themes referred to a concrete object, which is defined as a noun that can be perceived with one of the five senses (Theijssen, van Halteren, Boves, & Oostdijk, Reference Theijssen, van Halteren, Boves and Oostdijk2012).
-
• Previous PP dative: This variable encoded whether a PP dative occurred in the context the subjects had to read.
Example (12), which is an item from the actual experiment, illustrates how the aforementioned predictors influence the choice of dative structure.
-
(12) Speaker:
The problem I have is, in the past at least, the Israelis were very strategically important to us. But I think that's diminished a lot lately too. Especially with the relationship we’ve started to develop with Saudi Arabia after the Gulf War and all. And I don’t know, maybe we could use that to our advantage.
a. At least if we are going to be giving [all this money] theme to [them] recipient,
b. At least if we are going to be giving [them] recipient [all this money] theme, then at least, you know, we should get some cooperation or whatever in return.
As the theme is longer than the recipient (three orthographic words compared to one orthographic word), the recipient should occur prior to the theme given that it is shorter (i.e., sentence [12b] should be preferred). Animate constituents should occur before inanimate ones, which is true in sentence (12b). We further expect definite constituents to precede indefinite ones, and pronouns to precede nonpronouns, which is also realized in sentence (12b). Finally, constituents that are discourse accessible are mentioned before constituents that have not been mentioned in previous discourse, which should also make (12b) preferable.
Even though the NP dative in this example seems the only possible choice, we should always keep two things in mind: first, that the verb also plays a major role in dative sentences and can work against the other factors and, second, that these are only statistical preferences and by no means categorical decisions. This is why sentence (12a) may also be accepted by some speakers.
In the following two sections, we provide answers to the two main research questions. The following section presents the analysis of the general preferences and the differences between individual speakers, as they emerge from the two experiments.
RESULTS
General Preference and Individual Variation
After removal of missing answers, our dataset comprised 719 observations that entered further analysis. The mean of the ratings was 53.02, with a standard deviation of 36.6. Given the complexity of the many influences at work, it is impossible and meaningless to compute any absolute measure of preference without taking the properties of the language sample into account. For example, a sample with a preponderance of pronominal themes will show a greater preference for the PP dative than a sample in which pronominal themes are rare (all other things being equal). As a consequence, if we want to say anything about potential preferences of L2 learners, we would have to take the same sample of pertinent sentences and then compare the preferences of L1 speakers versus that of L2 speakers. In our case, it would be ideal to compare for each item the rating of the native speakers from Bresnan and Ford’s study with that of the learners in our experiment. Unfortunately, this comparison is not possible as we were unable to obtain Bresnan and Ford’s original dataset.
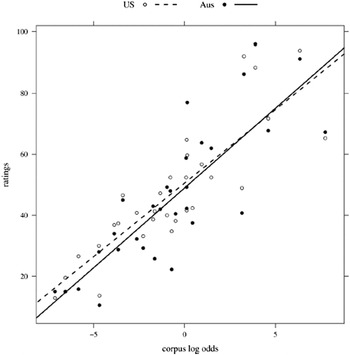
There is, however, an indirect way of comparing the natives’ choices with that of the nonnatives. Bresnan and Ford (Reference Bresnan and Ford2010) investigate the relationship between the experimental choices of their subjects and the choices as found in the Switchboard Corpus. To measure the sensitivity of the speakers to the various factors, Bresnan and Ford first devised a regression model that predicted the choice of the dative construction for the datives in the Switchboard Corpus. They then regressed the mean ratings of their subjects for each item on the predicted log odds of the corpus model (i.e., on the predicted tendency to choose a particular construction). The correlation between the corpus probabilities for a given experimental item and the observed experimental ratings by the experimental subjects is depicted in Figure 1, with the solid regression line representing the Australian speakers and the dotted line representing the U.S. speakers. One can see that there is a strong correlation between the two measures and that the regression line has an intercept of about 50 for both varieties. For the highest value of the corpus log odds ratio (about 7.4), the regression line shows an estimated rating of about 90.
Mean ratings of U.S. and Australian participants for each item by corpus log odds. Regression lines show ratings increasing with log odds for both groups. (Reproduced from Bresnan & Ford, Reference Bresnan and Ford2010, p. 186, with permission.)

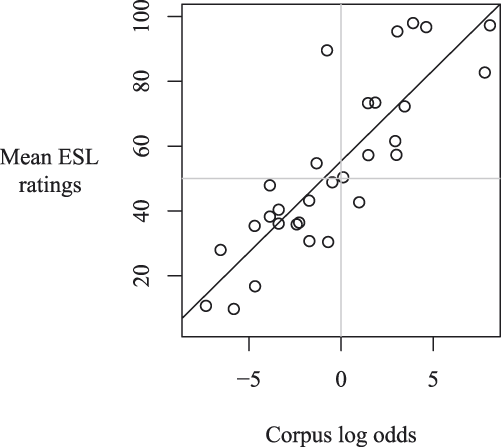
The corresponding graph for the L2 speakers looks very similar (see Figure 2). There is also a strong relationship between the corpus log odds and the ratings (adjusted R Footnote 2 =.697; Bresnan & Ford do not give the R 2 values of the regression models that underlie their regression lines). The regression line of the learners is, however, slightly higher than that of the native speakers (the learners’ intercept is 55.1) and seems to have a slightly steeper slope, as the highest corpus log odds corresponds to an observed mean estimate of 98.2. Both differences tell us that the ESL speakers tend a bit more toward the PP dative, but this tendency is very small.
Mean ratings of ESL participants for each item by corpus log odds. The regression line shows ratings increasing with log odds.
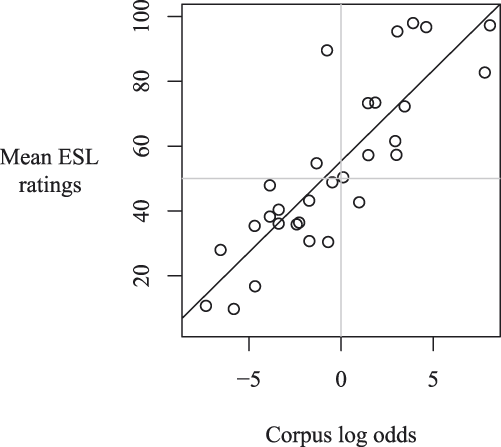
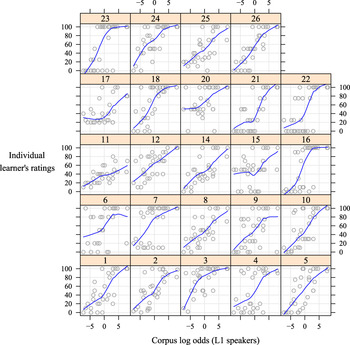
Figure 2 cannot tell us anything about the patterning of the data for individual learners. The relationship between the learners’ individual ratings and the corpus log odds is shown in Figure 3. Each scatterplot shows the individual ratings of each learner. The items’ corpus log odds are plotted on the x-axis and the PP ratings are plotted on the y-axis. A value of 100 on the y-axis corresponds to a categorical preference for a PP dative, and a value of zero corresponds to a categorical preference for a NP dative.
Individual ratings of individual ESL participants for each item by corpus log odds. The lines show a nonparametric scatterplot smoother fit through the data (Cleveland, Reference Cleveland1979).

The different shapes of the nonparametric regression lines allow us to classify the learners into different types.
There is a subset of learners who show a fairly linear relationship between the two variables (participants 5, 8, 9, 10, 11, 12, 14, and 20), similar to what Bresnan and Ford (2010, p. 187) show for their native speakers. Within this subset of ESL speakers, some participants show a stronger relationship between their rating and the corpus log odds (e.g., participants 5 and 14), whereas others do not show very clear preferences, even when the corpus log odds are extreme (e.g., participants 11 and 20). Participants of this subset also differ in their baselines (i.e., in their scores at the left margin of the plots). For example, participants 8 and 20 start out with higher ratings (i.e., have a greater tendency to select the PP dative) than participants 5 and 10.
For the other large subset of participants, the relationship between the corpus log odds and the ratings does not seem to be linear and, thus, qualitatively different from that of the L1 speakers. In this group, we find ceiling effects already in the middle of the log odds range. For example, participants 3, 7, 16, 18, 23, and 26 strongly prefer the PP dative for items for which the corpus log odds are still rather low. For some learners, this effect is at the NP dative end of the rating scale (e.g., participants 4, 15, and 17). Some participants even show a regression line that levels off at both ends, approximating an S curve (e.g., participants 4 and 22). The distributions in this subset of learners suggest that there are certain cutoffs at which the influence of the different factors is categorical and no longer probabilistic and gradient.
To summarize, we find that, overall, advanced learners are sensitive to the distributions of dative variants in native English, with meaningful individual variation concerning the general preferences and the question of gradient versus categorical choices. We now look in more detail at the determinants of these choices.
Determinants of the Dative Alternation in German-English Interlanguage
If learners are influenced by the same factors as native speakers, and if those factors work in the same direction, we should find that the harmonic alignment pattern will influence the learners’ choices. The influence of the harmonic alignment pattern will be tested with the following hypotheses:
-
1. Length
-
The PP dative is more likely the longer the recipient is, as compared to the theme.
-
2. Animacy
-
a. The PP dative is more likely if the recipient is inanimate.
-
b. The PP dative is more likely if the theme is animate.
-
3. Definiteness
-
a. The PP dative is more likely if the recipient is indefinite.
-
b. The PP dative is more likely if the theme is definite.
-
4. Pronominality
-
a. The PP dative is more likely if the recipient is not a pronoun.
-
b. The PP dative is more likely if the theme is a pronoun.
-
5. Givenness
-
a. The PP dative is more likely if the recipient is new.
-
b. The PP dative is more likely if the theme is given.
Statistical Analysis.
To test the simultaneous effects of the different predictors we used linear mixed-effect regression models. Footnote 5 Multiple regression models allow us to consider the influence of one variable while keeping the others constant (Baayen, Reference Baayen2008). Mixed-effects regression has the advantage that it brings the variation of random effects such as subject or item under statistical control and can deal with unbalanced datasets. The ability to deal with unbalanced datasets is especially welcome because not all combinations of all values of the different predictors are represented in the stimuli with equal frequency.
We used verb and subject as random effects. As subjects may have personal preferences for one or the other construction, it is advisable to keep their influence under control. The same holds true for the influence of the verb. We also tested a random contrast for verbs by subject, but log-likelihood tests showed that the inclusion of this random contrast was not justified. Prepositional object rating was used as the dependent variable. It consisted of the score each item received for the PP dative sentence (which is complementary to the rating of the NP dative). Positive coefficients in the models work in the direction of the PP dative, whereas negative ones work in the direction of the NP dative.
In the first step, linear mixed-effect models were fitted with only one predictor variable at a time as a fixed effect. These monofactorial models were devised for two reasons. First, the monofactorial models give us a first impression of the effect each predictor has in isolation and thus enable us to compare the effect to the findings of earlier studies that only investigated one predictor. The second reason is that all predictor variables are highly interrelated. This so-called collinearity is potentially harmful in regression analysis (e.g., Belsley, Kuh, & Welsch, Reference Belsley, Kuh and Welsch1980) because the coefficient estimates of individual predictors may change erratically in response to small changes in the model (e.g., after removal of a predictor). For example, highly interrelated predictors can lead to a coefficient estimate changing its algebraic sign and thus making false predictions (i.e., suppression; Friedman & Wall, Reference Friedman and Wall2005). By means of comparing the algebraic sign of each predictor in its monofactorial model to the predictor’s algebraic sign in the multifactorial model, suppression effects can be detected. Having modeled the predictors in isolation makes it possible to keep track of them in the full model, which contains all predictor variables as fixed effects in the multifactorial analysis.
The fixed effects in our analyses were relative syntactic complexity, animacy of theme, animacy of recipient, pronominality of theme and pronominality of recipient, accessibility of theme and accessibility of recipient, definiteness of theme and definiteness of recipient, concreteness of theme, number of theme and number of recipient, person of recipient, and previous PP structure. Person of theme had to be excluded as it turned out to have only one value—namely, not local.
For statistical modeling, the software R (R Core Team, 2011) was used. The package lme4 (Bates, Sarkar, Bates, & Matrix, Reference Bates, Sarkar, Bates and Matrix2007) was used for the linear mixed-effects models. The results are presented in the following section.
Monofactorial Analyses.
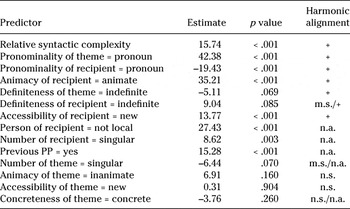
The monofactorial linear models showed effects for the majority of the predictors tested. Every single predictor was tested in an individual linear mixed regression model. The models are summarized in Table 1. A positive estimate is associated with a higher rating for the PP construction. The harmonic alignment column states whether the result is in line with the predictions made by the harmonic alignment pattern.
Results of the monofactorial analyses

Note. + = in accordance with the harmonic alignment pattern; m.s. = marginally significant; n.s. = not significant; n.a. = not applicable.
The models show that many, but not all, of the predictors that are relevant for predicting dative alternation for L1 speakers are also predictive for L2 speakers. Concreteness does not play a role for the ESL speakers. Whether the theme is accessible or animate also does not influence the choice for learners. The results of these models are comparable to those of previous studies in which monofactorial analyses were used (Callies & Szczesniak, Reference Callies, Szczesniak, Walter and Grommes2008; Chang, Reference Chang2004; R. Hawkins, Reference Hawkins1987; Le Compagnon, Reference Le Compagnon1984; Tanaka, Reference Tanaka1987). In the next section, it will be shown that not all of the significant predictors from the monofactorial analysis remain significant in a multifactorial model.
Multifactorial Analysis.
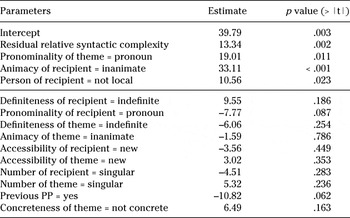
Initially, we fitted a model with all predictor variables as described in the Coding section. A suppression effect was detected for the predictor pronominality of recipient. This effect is due to the fact that this predictor is closely related to relative syntactic complexity. To alleviate this problem, we opted for residualization. In a separate regression model pronominality of recipient was used to predict relative syntactic complexity. The residuals of this model leave us with exactly that part of relative syntactic complexity that cannot be predicted by pronominality of recipient. We then used the residualized syntactic complexity variable in the mixed models and fitted the model again with all predictors. This full model is documented in Table 2. We can see that eight predictors have no significant effect: pronominality of recipient, definiteness, animacy, and concreteness of the theme, accessibility (of either theme or recipient), and number (of either theme or recipient). Compared with the results of the monofactorial models, we see that pronominality of recipient, definiteness of theme, accessibility of recipient, number of recipient, and previous PP were significant in the monofactorial models but not in the multifactorial analysis.
Fixed-effect coefficients in the initial mixed-effects model

Note. Nonsignificant predictors are placed in the bottom part of the table, separated from the significant predictors by a horizontal line.
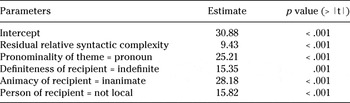
The initial model shows significant effects for the following predictors: relative syntactic complexity, pronominality of theme, definiteness of recipient, animacy of recipient, and person of recipient. These effects remain in the final model after the stepwise exclusion of nonsignificant predictors. The final model is documented in Table 3. All effects are in accordance with harmonic alignment.
Fixed-effect coefficients in the final mixed-effects model

The final model accounts for more than 50% of the variation observed (R Footnote 2 = .518), with the random effects explaining more than 30% of the variation (R Footnote 2 = .307; verb alone: R Footnote 2 = .260).
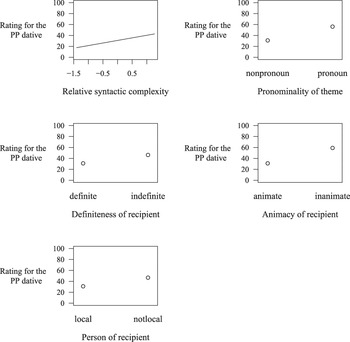
For a better understanding, the effects of the predictors are illustrated in Figure 4. In the upper left panel, we see the effect of relative length. The longer the recipient becomes compared to the theme, the higher the rating in favor of the PP dative. This result is perfectly in line with the predictions made by the end-weight principle.
Partial effects of the final model.

In the upper-right panel, we see the effect of pronominality of the theme. If the theme is represented by a pronoun, the chances of selecting the PP dative increase (Hypothesis 4b). Indefinite recipients increase the PP rating (Hypothesis 3a), too, as shown in the left panel of the second row of Figure 4. The effect for animacy of recipient can be seen in the right panel of the second row of Figure 4. The rating in favor of the PP dative increases if the recipient is inanimate (Hypothesis 2a). Finally, we get a higher PP rating if the recipient is not local. All effects are in the direction predicted by Hypotheses 1 through 5.
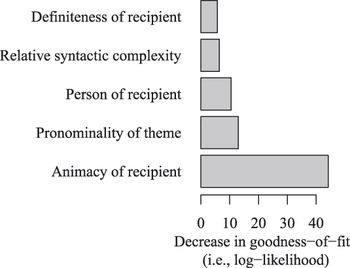
We also computed effect sizes with the help of log-likelihood tests. Figure 5 shows the effect sizes for the five predictors with the bars representing the decrease in log-likelihood when the pertinent predictor is removed from the model (all comparisons yielded very highly significant differences). We see that animacy of recipient has the strongest effect and definiteness of recipient the weakest.
Effect sizes of the final model.

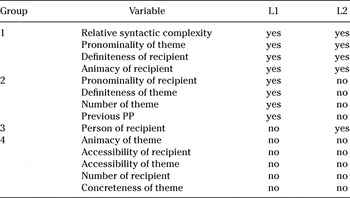
We now compare our results with the patterning of the native speaker data in the Bresnan and Ford (Reference Bresnan and Ford2010) experiment. Table 4 summarizes the effects across the two groups.
Comparison of significant effects across L1 and L2 speakers

We can see that the L1 speakers are influenced by more predictors than the L2 learners in our study. In the L1 model, previous PP, pronominality of recipient, definiteness of theme, and number of theme are significant, but these factors do not play a role for German learners of English. The reverse holds for person of recipient, which was significant in the learner data but not for the native speakers. Apart from person of recipient, all factors that are not influential for the L1 speakers are also not influential for the learners.
With regard to the effect sizes, learners and natives pattern differently. Whereas pronominality of recipient and theme are the most influential predictors for native speakers, learners are most influenced by the predictor animacy of recipient. It has, however, to be noted that we used a residualized length variable. Thus, the predictors are not straightforwardly comparable.
An interesting difference is evident in the overall sensitivity of the learners to the native language constraints. The degree to which the rating of a given speaker for a given item would approximate the corpus log odds can be taken as a proxy for this speaker’s overall sensitivity to the native language constraints (as manifested in the corpus log odds). These individual differences in sensitivity to the corpus log odds can be included in a mixed-effects regression model in the form of random slopes. In the modeling of the experimental data, Bresnan and Ford (Reference Bresnan and Ford2010) implemented the corpus log odds as a random slope by speaker, and this random effect improved their model significantly. We also included random slopes for corpus log odds by subject (in addition to random intercepts by subject), but the inclusion of these random slopes did not significantly improve the model (log-likelihood test, χ2[2] = 3.80, p = .150).
SUMMARY AND DISCUSSION
Summary of Results
The main aim of this paper was to investigate whether the different factors influencing the dative alternation in L1 English are also instrumental in determining the distribution of the two constructions (i.e., the PP and the NP dative) in German-English interlanguage.
It has often been claimed that learners prefer the PP dative over the NP dative. The present study lends only little support to this claim because the advanced learners in our study on average show only a slightly higher tendency toward the PP dative as compared to the L1 speakers. In fact, the median of all ratings is 50, and 11 of the 24 learners have a mean of less than 50 (i.e., indicating that they show an overall preference for the NP dative).
What is perhaps more interesting than the overall tendency is the variation between subjects. Some advanced learners are highly sensitive to the distributions of dative variants in native English and show a gradient distribution of preferences very similar to that of native speakers. Other learners show rather categorical preferences, which indicates that these learners are not much under the influence of probabilistic constraints.
With regard to the influence of different factors potentially determining the selection of variants, we have to distinguish between the univariate and the multivariate analyses. In the monofactorial analysis of these determinants, seven out of nine factors participating in the harmonic alignment hierarchy (and 10 out of all 14 factors under investigation) turned out to be significant. All of the former effects are fully in line with the harmonic alignment pattern and support the findings of earlier studies (e.g., that definite constituents occur before indefinite ones; Marefat, Reference Marefat2004; Tanaka, Reference Tanaka1987). The multifactorial analysis revealed, however, that many of the predictors that were significant in the monofactorial analysis were not significant in a multifactorial model. This shows that monofactorial analyses may lead to false conclusions as important covariates are not controlled.
As previously mentioned, most of the variables were strongly interrelated (i.e., pronouns were short, definite, and usually given; long NPs were usually new). This interrelatedness can lead to epiphenomenal findings in monofactorial analysis. For example, the effect of pronominality of recipient disappears in the multifactorial analysis. This can be interpreted in such a way that the pronominality effect found in the monofactorial analysis can be subsumed under the effect of definiteness. This finding once more illustrates the necessity of multifactorial analysis when addressing problems involving multiple influential factors.
The effects that remained significant in the multifactorial analysis are relative syntactic complexity, pronominality of theme, animacy of recipient, definiteness of recipient, and person of recipient. All of these effects go into the predicted direction (i.e., they follow the harmonic alignment pattern). This means that, in principle, the same kinds of influence hold for advanced German learners of English as for English native speakers. Furthermore, for both groups, we can predict the choices almost equally well on the basis of these predictors (compare the R 2 values of the two models: learner model R 2 = .518, Bresnan & Ford’s [Reference Bresnan and Ford2010] native speaker model R 2 = .529). There are some notable differences between the groups, however, the most important of which is that the ESL speakers are influenced by fewer variables. Only animacy of recipient, relative syntactic complexity, pronominality of theme, and definiteness of recipient are influences that are shared by the two groups, and this set of factors does not seem to be arbitrary. It includes all four parameters of harmonic alignment, as shown in (5).
Variables associated with context, such as previous PP structure and accessibility of recipient and theme, were not significant for our learners, and most of them were not even significant in the monofactorial analysis. One explanation for this may be the difficulty of the items, but, interestingly, our results are in line with earlier studies (Callies & Szczesniak, Reference Callies, Szczesniak, Walter and Grommes2008; Chang, Reference Chang2004) that found that context-related variables are not influential for learners.
Another interesting fact is that the recipient seems to be more influential than the theme in predicting learners’ choices. Is the recipient more important than the theme in learner language? Wolk and colleagues (2011) found that the recipients have longer fixation times in eye-tracking experiments than do themes. There are two possible explanations for the prominence of recipients. One is that the recipient is usually animate and, thus, more interesting. The other is that the recipient precedes the theme in the canonical German word order and is thus more important for German speakers. This leads us to the question of transfer and the theoretical implications of this study for theories of L2 acquisition.
Theoretical Implications
The study of L2 syntax has focused very much on the acquisition of syntactic patterns and constructions. The phenomenon of grammatical variation and its acquisition has received little attention. Thus, we find quite a few studies that have investigated the acquisition of the two variants of dative constructions but very few devoted to the acquisition of the determinants of the choice between the two variants.
The present study investigated what determines the dative choice of advanced German learners of English. At the theoretical level, the results of our investigation may shed some new light on the question of transfer and processing factors in L2 acquisition. We are now in a position to return to the hypotheses developed previously and evaluate them in the light of the evidence.
The traditional, categorical transfer approach does not make any predictions as to what may govern the choice of the two dative constructions once the two constructions are acquired. If frequency is allowed to play a role in transfer, the prediction is that German learners of English will prefer the NP object construction in English, as this is the preferred order of constituents in German. In our dataset, 11 of our advanced learners show some preference for the NP dative, whereas 13 show some preference for the PP dative. Previous studies have found a robust PP preference for early learners, which suggests that the learners in our study that prefer the PP dative may be the less advanced ones. Assuming that the PP dative is easier to process, a preference for the PP dative would be expected from a processing-based perspective.
If we consider the potential transfer of influential factors from the L1, different hypotheses can be entertained. According to the full transfer/full access hypothesis, the dative choices would be largely influenced by the constellation of pertinent factors as those being active in the L1. Unfortunately, the picture for German is not very clear. Alignment constraints do play a role in German syntax but their exact influence with regard to the dative alternation has not been properly investigated.
Another hypothesis could state that, initially, the learners would disregard the alignment factors in spite of their potential role in their L1, and the learners would only later and gradually acquire a sensitivity toward alignment factors. Our results seem to point in this direction. Given that earlier studies of nonadvanced speakers showed a preference for the PP dative, our results can be interpreted in such a way that an earlier PP bias gives way to the more complex influence of alignment factors that was seen with many of the advanced learners in this study. Some additional support for such an interpretation comes from the inspection of the behavior of individual subjects. A number of subjects (i.e., the less advanced ones) provided ratings whose distribution could be interpreted in such a way that their interlanguage combines elements of categorical choices and of probabilistic choices under the influence of the different determinants of the dative alternation.
To further test the validity of this assumption, additional studies are needed. The present study was limited to advanced learners, and longitudinal or cross-sectional studies are certainly called for that look more closely at the development of probabilistic constraints in interlanguage. The question of whether principles of alignment can be transferred needs to be addressed by comparing learners with a L1 that features probabilistic constraints on flexible word orders to L2 learners that do not have a flexible word order in their L1. Japanese would be such a language. Tanaka (Reference Tanaka1987) observed that Japanese learners of English also follow the end-weight principle, which could be an indication that the constraints are not transferred.
APPENDIX A
INSTRUCTIONS
Anleitung VP:
Wir sind daran interessiert, wie sich Lerner des Englischen in informellen Konversationen spontan zwischen verschiedenen Möglichkeiten, den gleichen Sachverhalt auszudrücken, entscheiden.
In den folgenden Textabschnitten sprechen ein oder zwei Personen über verschiedene Themen. In jedem dieser Textabschnitte gibt es die Möglichkeit zwischen zwei Alternativen auszuwählen, wie der Textabschnitt fortgesetzt werden könnte. Diese Alternativen sind mit (1) und (2) nummeriert.
Ihre Aufgabe ist es, die Textabschnitte zu lesen und zu entscheiden, wie natürlich Ihnen die zur Wahl gestellten Alternativen vorkommen.
Sie haben 100 Punkte, die Sie zwischen den beiden Alternativen aufteilen können. Die Summe der Punkte, die Sie pro Textabschnitt verteilen, muss immer 100 Punkte ergeben.
Wenn Sie z.B. denken, dass beide Alternativen (1) und (2) in dem gegebenen Kontext gleich natürlich klingen, verteilen Sie jeweils 50 Punkte. Wenn eine der Alternativen völlig unnatürlich klingt, bewerten Sie diese mit 0 Punkten und die andere mit 100 Punkten. Natürlich können die Punkte auch in anderen Verhältnissen, z.B. 40 Punkte und 60 Punkte oder 25 Punkte und 75 Punkte verteilt werden, wenn eine Alternative nur etwas besser erscheint als eine andere.
Bitte lesen Sie die Abschnitte sorgfältig und verteilen die Punkte nach Ihrem Sprachgefühl. Es gibt keine “richtigen” oder “falschen” Antworten. Wir sind daran interessiert herauszufinden, was Sie in ungezwungenen englischen Konversationen als natürlich empfinden.
Bevor Sie anfangen, beantworten Sie bitte folgende Fragen:
1. Ist Deutsch Ihre Muttersprache?
⌷ Ja ⌷ Nein (weitere) Muttersprache:
2. Haben Sie längere Zeit im englischsprachigen Ausland verbracht (ab 3 Monaten)?
⌷ Ja ⌷ Nein Dauer: Land:
3. Haben Sie schon ein Seminar zum Thema Syntax besucht?
⌷ Ja ⌷ Nein
VIELEN DANK FÜR IHRE TEILNAHME AN DIESER FRAGEBOGENSTUDIE!
INSTRUCTIONS TRANSLATION
Instructions ID:
We want to find out how learners of English spontaneously decide between two options for expressing the same event in informal conversations.
In the following text passages one or two people talk about different topics. In each text passage you can choose between two alternative ways of how the passage should be continued. The alternatives are labeled (1) and (2).
Your task is to read the text passages and decide how natural you find the two alternatives which are presented.
You are supposed to distribute 100 points between the two alternatives. The sum of the distributed points must be 100 per text passage.
If you, for instance, consider both alternatives, (1) and (2), in a given context equally acceptable, you can allocate 50 points to each alternative. If one option sounds totally unnatural to you, assign 0 points to this alternative and 100 points to the other one. You can, of course, also split the points in other ways, i.e., 40 points and 60 points or 25 points and 75 points if one alternative only seems to be slightly better than the other one.
Please read the text passages carefully and distribute the points in accordance to your intuitions. There are no “right” or “wrong” answers. We are interested in finding out what you consider natural in a casual English conversation.
Please answer the following questions before you begin:
1. Is German your native language?
⌷ Yes ⌷ No (additional) native language:
2. Have you lived in an English-speaking country for a longer period of time (for more than 3 months)?
⌷ Yes ⌷ No Duration: Country:
3. Have you ever participated in a seminar with the topic “syntax”?
⌷ Yes ⌷ No
THANK YOU VERY MUCH FOR YOUR PARTICIPATION IN THIS QUESTIONNAIRE STUDY!
APPENDIX B
DISTRIBUTION OF EXPERIMENTAL ITEMS
Distribution of verb lexemes and previous PP datives in the questionnaire

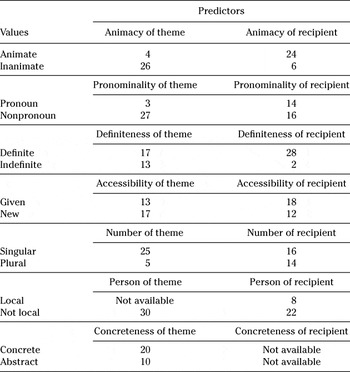
Distribution of all binary predictors (theme and recipient) in the questionnaire

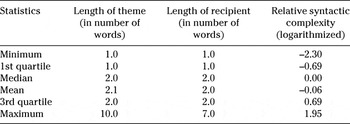
Distribution of all numeric predictors in the questionnaire