


Indices of lexical diversity (and in particular indices of lexical variety) are often used as measures of lexical proficiency and/or lexical development in studies of second language acquisition (SLA; Bulté & Roothooft, Reference Bulté and Roothooft2020; Lambelet, Reference Lambelet2021; Tracy-Ventura et al., Reference Tracy-Ventura, Huensch, Mitchell, Le Bruyn and Paquot2021; Vidal & Jarvis, Reference Vidal and Jarvis2020). As language learners develop (and become more proficient language users), we expect that the size of their productive vocabulary will grow. Accordingly, given a particular language production task, we would expect that more proficient language users would use a wider variety of lexical items to complete the task. We also presume that more proficient language users would produce longer texts than less proficient users (Carlson et al., Reference Carlson, Bridgeman, Camp and Waanders1985; Iwashita et al., Reference Iwashita, Brown, McNamara and O’Hagan2008; Jarvis et al., Reference Jarvis, Grant, Bikowski and Ferris2003). A well-known, but often ignored, issue with indices of lexical variety is that many have been shown to be strongly (and intrinsically) related to text length (Hess et al., Reference Hess, Sefton and Landry1986; McCarthy & Jarvis, Reference McCarthy and Jarvis2010; Zenker & Kyle, Reference Zenker and Kyle2021). Some indices, such as the type-token ratio (TTR), are intrinsically negatively correlated with text length. This is problematic because TTR scores decrease as texts become longer—in other words, more fluent speakers and writers earn lower lexical diversity scores. Other well-known indices, such as Root TTR (Guiraud’s index), are intrinsically positively correlated with text length. As text lengths increase, Root TTR also increases. This is undesirable because it means that Root TTR conflates text length and lexical diversity: when a positive relationship between proficiency or development and Root TTR is found, it is unclear whether the observed relationship is due to increases in lexical diversity or productivity (e.g., the total number of words produced; Norris & Ortega, Reference Norris and Ortega2009).
In acknowledgement of the intrinsic relationship between TTR and text length, many studies have attempted to develop text-length independent measures of lexical diversity. Although many early attempts have been shown to be problematic (Chotlos, Reference Chotlos1944; Guiraud, Reference Guiraud1960; Maas, Reference Maas1971; Malvern & Richards, Reference Malvern, Richards, Ryan and Wray1997), more recent proposals have shown promise (Covington & McFall, Reference Covington and McFall2010; McCarthy & Jarvis, Reference McCarthy and Jarvis2010). For SLA researchers, one potential issue with extant studies is that they have tended to focus on longer L1 texts (McCarthy & Jarvis, Reference McCarthy and Jarvis2007, Reference McCarthy and Jarvis2010). A few studies have used shorter written L2 texts (Vidal & Jarvis, Reference Vidal and Jarvis2020; Zenker & Kyle, Reference Zenker and Kyle2021), but in the realm of L2 speech only small-scale studies have been conducted (Koizumi & In’nami, Reference Koizumi and In’nami2012). In this study, we extend previous L2 studies by examining the degree to which indices of lexical variety are stable across varying text lengths and across task types in a large corpus of L2 oral proficiency interviews.
Lexical diversity indices and text-length stability
As with any other construct we want to measure, an index of lexical diversity should be both demonstrably reliable and arguably valid. Because learners may create productions of different lengths, even when timed tasks are used, indices of lexical diversity need to be reliable (i.e., consistent) across texts of different lengths. Accordingly, there has been a particular focus on text-length stability in the literature (Guiraud, Reference Guiraud1960; Hess et al., Reference Hess, Sefton and Landry1986; Jarvis, Reference Jarvis2002; Koizumi & In’nami, Reference Koizumi and In’nami2012; McCarthy & Jarvis, Reference McCarthy and Jarvis2010; Tweedie & Baayen, Reference Tweedie and Baayen1998; Vidal & Jarvis, Reference Vidal and Jarvis2020; Zenker & Kyle, Reference Zenker and Kyle2021).
It should be noted that it is not necessarily problematic for indices of lexical diversity to be correlated with text length in a particular corpus. We expect a positive correlation between proficiency (broadly construed) and both lexical diversity and fluency (i.e., temporal aspects of speech; Lennon, Reference Lennon and Riggenbach2000) as well as productivity (the total amount of production; Norris & Ortega, Reference Norris and Ortega2009), and therefore correlations between lexical diversity and these constructs are expected. It is, however, problematic when lexical diversity indices intrinsically vary due to text length. One common method of determining the degree to which indices vary intrinsically due to text length is the parallel sampling method (Hess et al., Reference Hess, Sefton and Landry1986), which involves dividing a text into sections of a particular length and then averaging index scores across the sections. When the parallel sampling method is repeated with sections of several different lengths, correlations can be calculated between section length and lexical diversity scores. Zenker and Kyle (Reference Zenker and Kyle2021), for example, analyzed the relationship between text length and lexical diversity indices in a large corpus (n = 4,542) of L2 argumentative essays (i.e., the ICNALE corpus; Ishikawa, Reference Ishikawa, Weir, Ishikawa and Poonpon2011). They divided each text into subsections from 50 to 200 words in length in five-word increments (50 words, 55 words, 60 words, etc.). Among the nine indices of lexical diversity examined, moving average TTR (MATTR) was the most reliable across different text lengths while TTR, Root TTR, and Log TTR were the least reliable (and were strongly related to text length). Similar, relatively large-scale analyses have been conducted in other L2 writing contexts (Vidal & Jarvis, Reference Vidal and Jarvis2020) and using L1 corpora consisting of longer spoken and written texts (McCarthy & Jarvis, Reference McCarthy and Jarvis2007, Reference McCarthy and Jarvis2010). To our knowledge, only small-scale studies have investigated text-length reliability in the types of spoken L2 contexts that are common in SLA research. Koizumi and In’nami (Reference Koizumi and In’nami2012), for example, analyzed monologic speaking task responses from 38 participants. Using the parallel sampling method on text samples of 50–200 words in length, they found that none of the lexical diversity indices examined (including Root TTR and D) were completely independent of text length, though MTLD stabilized at 100 words. Although their results are helpful, more robust analyses are needed to make strong claims related to the reliability of measures.
Of the indices of lexical diversity that have been proposed, at least five merit some discussion due to their conceptual influence on the field of SLA (TTR), their continued use by SLA researchers (Root TTR), and/or their potential promise (D, MATTR, MTLD). Perhaps the most well-known index of lexical diversity is the type-token ratio (TTR), which is calculated by dividing the number of unique words in a text (i.e., the number of types) by the number of total running words in a text (i.e., the number of tokens). Although this index is conceptually straightforward, it has a well-known and critical weakness—namely, that it varies intrinsically due to text length (Guiraud, Reference Guiraud1960; McCarthy & Jarvis, Reference McCarthy and Jarvis2010; Tweedie & Baayen, Reference Tweedie and Baayen1998; Zenker & Kyle, Reference Zenker and Kyle2021). As texts get longer, both function words and content words tend to be repeated until a topic shift occurs, at which point new content words might be introduced (though function words still tend to be repeated). Consequently, when TTR is used as an index of lexical diversity, it tends to overestimate the diversity of shorter texts (typically by less proficient users) and underestimate the diversity of longer texts (typically by more proficient users). An early attempt to mitigate this relationship was to transform the TTR value by using the square root of the number of tokens in the denominator (Guiraud, Reference Guiraud1960). Although this index, commonly referred to as Root TTR or Guiraud’s index, gained a reputation as an appropriate substitute for TTR and is still used fairly widely (Bulté & Housen, Reference Bulté and Housen2019; Lambelet, Reference Lambelet2021), studies have repeatedly shown that it strongly overcorrects TTR’s negative relationship with text length (e.g., Koizumi & In’nami, Reference Koizumi and In’nami2012; McCarthy & Jarvis, Reference McCarthy and Jarvis2010; Zenker & Kyle, Reference Zenker and Kyle2021). One possible reason for the durability of Root TTR in the field is that it tends to demonstrate a relatively strong relationship with proficiency, and it is certainly an improvement over TTR because it is positively correlated with text length and therefore does not penalize longer essays (see Bulté & Roothooft, Reference Bulté and Roothooft2020; Treffers-Daller et al., Reference Treffers-Daller, Parslow and Williams2018). However, because the index is intrinsically positively correlated with text length, it is unclear to what degree increases in Root TTR scores can be attributed to increases in lexical diversity, fluency, productivity, and/or topic development, among other potential causes for increases in text length.
Although previous research has clearly demonstrated that TTR and Root TTR are intrinsically related to text length, at least three other indices of lexical diversity have been proposed in recent decades that show more promise regarding text-length independence. The first is the index D, which is most commonly operationalized as vocd-D (Malvern et al., Reference Malvern, Richards, Chipere and Durán2004; Malvern & Richards, Reference Malvern, Richards, Ryan and Wray1997) using software such as CLAN (MacWhinney, Reference MacWhinney2000). The index vocd-D attempts to measure lexical diversity while mitigating text-length effects using a bootstrapped approach that repeatedly fits the rate of decline in TTR values within texts (i.e., the TTR curve) in random samples of varying lengths from a text. McCarthy and Jarvis (Reference McCarthy and Jarvis2007) demonstrated that D can be calculated in a more precise and straightforward manner by simply calculating the probability that each word type in a text would occur in a random sample from the text (using a hypergeometric distribution). McCarthy and Jarvis (Reference McCarthy and Jarvis2010) and subsequent studies have referred to this index as HD-D. Results with respect to text-length stability for D have been mixed, though most studies have found at least a small relationship between D and text length (Malvern & Richards, Reference Malvern, Richards, Ryan and Wray1997; McCarthy & Jarvis, Reference McCarthy and Jarvis2007; Zenker & Kyle, Reference Zenker and Kyle2021). There is evidence, however, that D may be more sensitive to text length in spoken texts (McCarthy & Jarvis, Reference McCarthy and Jarvis2007) and that these effects may be large (Koizumi & In’nami, Reference Koizumi and In’nami2012).
The second index that has shown promise is the Measure of Textual Lexical Diversity (MTLD; McCarthy & Jarvis, Reference McCarthy and Jarvis2010). The MTLD leverages the relationship between TTR values and text length by calculating how quickly TTR values stabilize. MTLD scores represent the average number of words it takes for TTR values to fall to the point of stabilization in a text (usually operationalized as TTR = .720). Texts with larger MTLD values are considered more diverse because it takes longer before enough word repetition occurs for TTR values to drop to the stabilization point. Research with L1 spoken and written registers (McCarthy & Jarvis, Reference McCarthy and Jarvis2010) and L2 argumentative essays (Vidal & Jarvis, Reference Vidal and Jarvis2020; Zenker & Kyle, Reference Zenker and Kyle2021) has suggested that MTLD values tend to be resistant to text length effects (but see Treffers-Daller, Reference Treffers-Daller, Jarvis and Daller2013). There is also preliminary evidence that MLTD is reasonably stable across some L2 spoken registers (Koizumi & In’nami, Reference Koizumi and In’nami2012), though more robust sample sizes are needed to confirm this. One well-documented weakness of MTLD is the estimation of partial factors (text segments at the end of a production that are longer than 10 words but have not yet reached the cut-off TTR value). The default solution has been to average scores (including partial factors) for MTLD calculated forward and backward through the text, though windowed approaches have also been used (see Vidal & Jarvis, Reference Vidal and Jarvis2020; Zenker & Kyle, Reference Zenker and Kyle2021). Use of MTLD is increasingly common in SLA studies (e.g., Bulté & Roothooft, Reference Bulté and Roothooft2020; Pfenniger, Reference Pfenniger2020; Vidal & Jarvis, Reference Vidal and Jarvis2020).
The third index of promise is moving-average TTR (MATTR; Covington & McFall, Reference Covington and McFall2010). MATTR mitigates the relationship between TTR and length by averaging TTR values measured across a text in a moving-window fashion (typically with a window size of 50 words). Unlike related indices such as mean segmental TTR (MSTTR), in which the final segment of the text is ignored if it is shorter than the predetermined window size, MATTR uses all words in a text to calculate the final lexical diversity score. Only a few studies have investigated the relationship between MATTR and text length, likely because it was not available in easy-to-use text analysis tools until recently. However, a recent study (Zenker & Kyle, Reference Zenker and Kyle2021) found that MATTR was particularly stable across L2 argumentative texts ranging from 50 to 200 words. In the realm of spoken tasks, Fergadiotis et al. (Reference Fergadiotis, Wright and Green2015) found that text length did not affect MATTR scores when applied to L1 adult responses to four oral tasks. To our knowledge, however, MATTR has not been formally evaluated with L2 responses to spoken tasks. Although MATTR has been used in a few SLA studies (e.g., Hwang, Reference Hwang2020; Tracy-Ventura et al., Reference Tracy-Ventura, Huensch, Mitchell, Le Bruyn and Paquot2021), it has not yet been widely adopted.
Validity of lexical diversity indices
In addition to demonstrating that a measurement tool is highly reliable, it is equally important to have clear evidence to support an argument for the validity of that tool (Chapelle et al., Reference Chapelle, Enright and Jamieson2008; Kane, Reference Kane2013). Studies have taken two major approaches in providing validity evidence for lexical diversity indices. In the first (and most common) approach, relationships between lexical diversity scores and proficiency scores (broadly construed) are used (Bulté & Roothooft, Reference Bulté and Roothooft2020; Engber, Reference Engber1995; Jarvis, Reference Jarvis2002; Koizumi et al., Reference Koizumi, In’nami, Jeon, Jeon and In’nami2022; Treffers-Daller et al., Reference Treffers-Daller, Parslow and Williams2018; Zenker & Kyle, Reference Zenker and Kyle2021). For example, Engber (Reference Engber1995) investigated the relationship between lexical variety index scores (both including and excluding lexical errors) and holistic judgments of essay quality (n = 66). She found moderate correlations between holistic scores and lexical variety index scores both when all words were included (r = .450) and when lexical errors were excluded (r = .570). More recently, Treffers-Daller et al. (Reference Treffers-Daller, Parslow and Williams2018) investigated the relationship between lexical diversity index scores for L2 essays (n = 179), overall Common European Framework of Reference (CEFR) proficiency levels, vocabulary scores, and writing scores. Indices that have been shown to be intrinsically related to text length (number of types, TTR, Root TTR) demonstrated significant differences between B1 and B2 levels (but not other adjacent proficiency levels) and significant moderate correlations (ranging from r = .424 to .472) were found between these indices and writing and vocabulary scores. Although indices that have been shown to be resistant to text-length effects (HD-D, vocd-D, and MTLD) did not show significant differences across adjacent CEFR levels, significant small to moderate correlations (ranging from r = .276 to .344) were found between these indices and both vocabulary scores and writing scores. In the realm of L2 spoken tasks, Bulté & Roothooft (Reference Bulté and Roothooft2020) investigated the relationship between speaking proficiency scores based on an IELTS exam and various text complexity measures (including lexical diversity). The strongest correlation found was between an index that has been shown to be intrinsically related to text length (Root TTR) and speaking proficiency scores (r = .701). Moderate to strong correlations were found between speaking proficiency scores and two indices that have been shown to be resistant to text-length effects (HD-D, r = 0.615; MTLD, r = .535). Taken together, these results suggest that text-length stable indices of lexical diversity are indeed related to proficiency (though the effects are often moderate), providing some evidence for their validity in both written and spoken contexts. Unsurprisingly, indices affected by text length tend to be more strongly related to proficiency scores that those that effectively control for text length effects because they conflate the constructs of text length and lexical diversity.
In the second (and less common) approach, relationships between lexical diversity index scores and human judgments of lexical diversity are investigated. For example, Jarvis (Reference Jarvis2017) examined the relationship between various indices of lexical diversity and human ratings of lexical diversity in responses to a written narrative retelling task (n = 60). Correlations with human scores ranged from moderate to large, with the strongest ones being for MATTR (r = .577) and HD-D (r = .669). More recently, Kyle et al. (Reference Kyle, Crossley and Jarvis2021) conducted a similar study using L1 (n = 315) and L2 (n = 300) argumentative essays. They found moderate to strong correlations between human scores and HD-D (r = .602), MATTR (r = .492), and MTLD (r = .505). Taken together, these results provide some validity evidence for lexical diversity indices that have been shown to be at least reasonably resistant to text-length effects, though it seems clear that the psycholinguistic construct of lexical diversity consists of more than just lexical variety (see Jarvis, Reference Jarvis2013).
Lexical diversity indices and stability across tasks
If lexical diversity scores are compared across different task prompts (or task types), as may be the case in longitudinal studies (Tracy-Ventura et al., Reference Tracy-Ventura, Mitchell, McManus and Alonso-Ramos2016) and in some cross-sectional studies (Lu, Reference Lu2012; Verspoor et al., Reference Verspoor, Schmid and Xu2012), it is also important to establish that lexical diversity indices are consistent from one prompt to another. Relatively few studies have systematically investigated the stability of lexical diversity indices across written task prompts or types (Alexopoulou et al., Reference Alexopoulou, Michel, Murakami and Meurers2017; Yoon, Reference Yoon2017; Zenker & Kyle, Reference Zenker and Kyle2021), and none that we are aware of have done so with spoken tasks. The results of extant studies have indicated that lexical diversity scores may not be consistent across tasks. For example, Alexopoulou et al. (Reference Alexopoulou, Michel, Murakami and Meurers2017) found meaningful differences in MTLD scores across both task types (narrative, descriptive, professional) and prompts within each task type using the EFCAMDAT corpus (Geertzen et al., Reference Geertzen, Alexopoulou, Korhonen, Millar, Martin, Eddington, Henery and Tseng2014). Similarly, Zenker and Kyle (Reference Zenker and Kyle2021) found small but meaningful differences across two argumentative writing prompts in the ICNALE corpus (Ishikawa, Reference Ishikawa, Weir, Ishikawa and Poonpon2011) for the nine indices of lexical diversity investigated. In contrast, Yoon (Reference Yoon2017), who also used the ICNALE corpus, found negligible differences in D values across the two prompts, controlling for L1. These results preliminarily suggest that task type and task prompt may contribute to variation in lexical diversity scores (at least with respect to written tasks). It should be pointed out that there are many cases in which we might expect to see variation in lexical diversity scores across tasks as an indicator that different tasks elicit different linguistic features (Cumming et al., Reference Cumming, Kantor, Baba, Erdosy, Eouanzoui and James2005; Kyle et al., Reference Kyle, Crossley and McNamara2016). Therefore, the observation of differences in lexical diversity scores across tasks does not necessarily reflect negatively on the reliability of an index and may in fact provide validity evidence for the inclusion of multiple production tasks in a language assessment tool. However, it is important for the degree to which task characteristics affect indices of language production such as lexical diversity to inform the design of studies of language development and/or the design of assessment tools. Therefore, further investigation is needed to determine the degree to which task type and prompt affect lexical diversity scores in spoken tasks.
Current study
The current study addresses three issues related to the stability and validity of lexical diversity indices in spoken tasks commonly used in studies of SLA by analyzing a large corpus of oral proficiency interview data. The study is guided by the following research questions:
-
1. What is the relationship between lexical diversity indices and text length in oral proficiency interviews?
-
2. To what degree are text-length stable indices of lexical diversity predictive of oral proficiency interview scores?
-
3. To what degree are text-length stable indices of lexical diversity stable across oral proficiency interview subtasks?
Method
Learner corpus
In this study, we used the National Institute of Information and Communications Technology Japanese Learner English (NICT JLE) corpus, which includes 1,281 transcribed oral proficiency interviews (OPIs) by Japanese learners of L2 English (Izumi et al., Reference Izumi, Uchimoto and Isahara2004). The version of the OPI used in corpus collection, the Standard Speaking Test (ACTFL-ALC-SST, henceforth SST), is a modified version of the American Council on the Teaching of Foreign Language (ACTFL) OPI, adjusted for the target population through the inclusion of more structured intermediate-level tasks (ACTFL-ALC Press, 1996; ALC Press, 2010; Koizumi & Hirai, Reference Koizumi and Hirai2012). The 10-to-15-minute interview consists of five stages: (1) warm-up introductions, (2) a single-picture description task, (3) a role play task, (4) a sequential picture storytelling task, and (5) wind-down questions. During the interview, the examiner “informally evaluates the test-taker’s level based on his/her responses and selects tasks appropriate to the level” (Koizumi & Hirai, Reference Koizumi and Hirai2012, p. 42). Interviews were subsequently scored by two qualified raters according to a holistic rubric (see Appendix A) that ranged from 1 to 9 points. In cases of disagreement between the two raters, a third and final rating was provided by a “master” rater (Kobayashi & Abe, Reference Kobayashi and Abe2016). The transcripts and final SST scores are publicly accessible as a part of the NICT JLE Corpus (https://alaginrc.nict.go.jp/nict_jle/index_E.html).
A Python script was used to automatically remove pauses, disfluencies (i.e., fillers, repetitions, false starts, repair), and other discourse features (e.g., Japanese words/utterances, paralinguistic cues) from the corpus using XML tags provided in the NICT JLE files. First, the interview transcripts and metadata about the interviewees and specific task types were retrieved separately from the raw corpus file. From the transcript, only the interviewees’ utterances were extracted. We then deleted disfluency features from the interviewees’ transcripts. We also deleted any utterances that were completely in Japanese (e.g., fillers, overt lexical searches). To do so, we created a list of Japanese utterances in the corpus, and a member of the research team whose L1 is Japanese determined whether each instance was an independent Japanese utterance or a Japanese phrase inserted into an English construction. Finally, we extracted the cleaned version of the text and classified it by task type (Stage 2 = single-picture description task; Stage 3 = role play task; Stage 4 = sequential picture storytelling task). Stage 1 (warm-up) and Stage 5 (wind-down) were excluded from all analyses. The Python code for this procedure can be found in the online supplementary material (https://osf.io/ya8se).
Table 1 shows the distributions of learners and tokens across the various proficiency levels in the corpus (including only data from Stages 2-4).
Learner and token counts by proficiency level in the corpus data for Stages 2–4

Lexical diversity indices
Lexical diversity indices were calculated with the Python version of TAALED (Kyle et al., Reference Kyle, Crossley and Jarvis2021; version .32). Texts were preprocessed using spaCy (Explosion AI, 2018) through the pylats package (Kyle, Reference Kyle2022; version .37), which was also used for postprocessing. Texts were lemmatized prior to the calculation of lexical diversity scores. Any misspelled words (due to transcription errors) that did not result in the creation of an English word were ignored. An overview of each of the indices examined in this study is provided below.
Number of types
The number of types is simply a count of the number of unique lemmas in a text. Although number of types is strongly related to direct human judgements of lexical diversity (see Kyle et al., Reference Kyle, Crossley and Jarvis2021) and CEFR proficiency levels (Treffers-Daller et al., Reference Treffers-Daller, Parslow and Williams2018), it is also strongly related to text length and is not generally advisable to use as an index of diversity. It is included in this study as a baseline index.
Type-token ratio (TTR)
The simple type-token ratio (TTR; Johnson, Reference Johnson1944) is calculated as the number of unique words in the text (types) divided by the number of running words (tokens):
 $ TTR= nTypes/ nTokens $
.
Root TTR
Root TTR (also known as Guiraud’s index; Guiraud, Reference Guiraud1960) is calculated as the number of types divided by the square root of the number of tokens:
 $ Root\; TTR= nTypes/\sqrt{nTokens} $
.
Maas
Maas’s index (Maas, Reference Maas1971) is a transformation of TTR that fits the type and token measures to a logarithmic curve:
 $ Maas=\log (ntokens)-\log (ntypes)/\log {(ntokens)}^2 $
.
MATTR
Moving-average TTR (MATTR; Covington & McFall, Reference Covington and McFall2010) is calculated by taking the moving average of TTR measurements for all segments of a given length. For MATTR with a window length of 50 tokens (MATTR 50), TTR is calculated on tokens 1–50, 2–51, 3–52, etc., and the resulting TTR values are averaged to produce the final MATTR value. Although 50-word windows are commonly used in studies on writing proficiency and development, other window lengths can be used as well (Fergadiotis et al., Reference Fergadiotis, Wright and Green2015; Tracy-Ventura et al., Reference Tracy-Ventura, Huensch, Mitchell, Le Bruyn and Paquot2021; Treffers-Daller et al., Reference Treffers-Daller, Mukhopadhyay, Balasubramanian, Tamboli and Tsimpli2022). In order to preliminarily determine an optimal window size for this study, we examined the relationship between MATTR and SST score with window sizes ranging from 1 to 100 tokens. The results of this analysis (see Figure 1) indicated that MATTR calculated with an 11-word window size resulted in the highest correlation (r = .504) with SST score. We therefore considered both MATTR 50 (which has been commonly used in L2 studies) and MATTR 11 (which demonstrates the strongest relationship with SST score in this study) in our analyses.
Optimizing MATTR window size.

HD-D
The hypergeometric distribution diversity index (HD-D; McCarthy & Jarvis, Reference McCarthy and Jarvis2007) is a revised version of vocd-D that uses a hypergeometric distribution to calculate the probability of encountering a given word type in a random 42-token sample. The probabilities for each word type in the text are then added together to produce the final HD-D value. Although vocd-D and HD-D are strongly correlated (Koizumi & In’nami, Reference Koizumi and In’nami2012; McCarthy & Jarvis, Reference McCarthy and Jarvis2007), McCarthy and Jarvis assert that HD-D is the value that vocd-D is attempting to approximate and that it is therefore the more appropriate choice.
MTLD
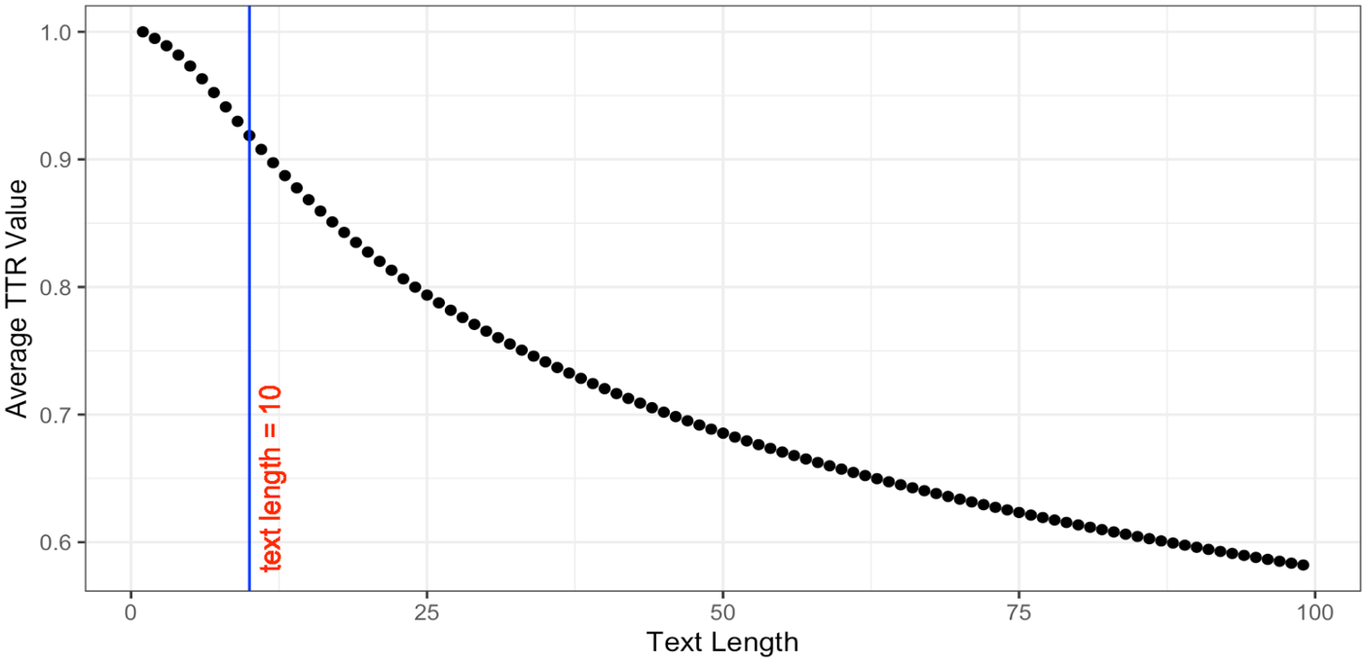
The measure of textual lexical diversity (MTLD; McCarthy, Reference McCarthy2005; McCarthy & Jarvis, Reference McCarthy and Jarvis2010) represents the average number of tokens, with a 10-token minimum, that it takes to reach a predetermined TTR cutoff value (defined as TTR = .72 in McCarthy & Jarvis, Reference McCarthy and Jarvis2010) in a text. The resulting token lengths, which are calculated sequentially from one end of the text to the other, are referred to as factors. Partial factors occur where there are not enough remaining tokens to reach the specified TTR value. In the most commonly-used versions of MTLD, the procedure is performed both forwards and backwards on the text as a means of dealing with partial factors. Finally, the lengths of all complete factors are averaged to produce the MTLD value. In order to preliminarily determine an optimal TTR cutoff value for this study, we examined the relationship between MTLD and SST score with TTR cutoff values ranging from TTR = .60 to TTR = .92. The upper bound of the TTR cutoff values (TTR=.92) was set by determining the average TTR value in 10-token text segments (the default minimum MTLD factor size), as visualized in Figure 2. The results of this analysis (see Figure 3) indicated that MTLD calculated with a cutoff of TTR = .92 resulted in the highest correlation (r = .430) with SST score. We therefore considered both MTLD .72 (which has been commonly used in L2 studies) and MTLD .92 (which demonstrates the strongest relationship with SST score in this study) in our analyses.
Relationship between average TTR value and text segment length.
Optimizing TTR cut-off values for MTLD.

Analyses
To address RQ1, which is concerned with the intrinsic relationship between lexical diversity values and text length, an analysis was conducted using the parallel sampling method (Hess et al., Reference Hess, Sefton and Landry1986). Text lengths from 50 to 400 tokens were examined in increments of 5 tokens. In order to standardize the parallel sampling analysis, any texts shorter than 400 words in length were excluded. In texts longer than 400 words, only the first 400 words were used in the analysis. See Table 2 for the number of responses that met the length requirements (organized by SST score).
Number of responses per SST score level included in the parallel sampling analysis

The results were analyzed using data visualizations and with respect to correlations over the entire range (i.e., text segments of 50 to 400 words). Because previous research (Zenker & Kyle, Reference Zenker and Kyle2021) has indicated that some indices stabilize at longer text lengths, visualizations and correlations across five equally sized text-length bins (Bin 1 = 50–115 tokens, Bin 2 = 120–185 tokens, etc.) were also examined.
To address RQ2, which is concerned with the validity of text-length stable indices of lexical diversity, correlations were conducted between the text-length stable indices and the overall proficiency scores. For this analysis, all texts were used regardless of length (see Table 1 for reference).
To address RQ3, which is concerned with the stability of lexical diversity indices across different tasks, a linear mixed-effects model was conducted for each text-length stable index. All texts were used in this analysis. In each model, the lexical diversity index was the outcome variable, Task (a three-level category) was entered as a fixed-effect, and by-participant intercepts were added as the random effect. The linear mixed-effects models were fit using the lme4 package (Bates et al., Reference Bates, Mächler, Bolker and Walker2015). Two effect-size metrics were used to interpret the magnitude of the task effects: (a) marginal R 2 (which indicates the variance explained by the fixed effects) and conditional R 2 (which indicates the variance explained by the fixed effects + the random effects), computed through MuMIn package (Bartoń, Reference Bartoń2019) and (b) Cohen’s d metrics for the pairwise comparisons computed using the eff_size() function of the emmeans package (Lenth et al., Reference Lenth, Singmann, Love, Buerkner and Herve2019). For the interpretation of the effect size, we used Cohen’s (Reference Cohen1988) benchmark (d > .2 as small effects). All data and R code can be found in the online supplemental material.
Results
RQ1
To address the first research question, which was concerned with the relationship between lexical diversity values and text length, we conducted a parallel sampling analysis and a series of follow-up correlation analyses.
We present two approaches to the analysis of the results. In the first approach, the relationship between sample size and lexical diversity scores is calculated for the entire range of text lengths examined (i.e., 50–400 words). Visualizations of the relationship between lexical diversity indices and text length are provided in Figure 4. Note that z scores are used in the visualizations to put all the lexical diversity measurements on a common scale (thus facilitating comparisons across indices). A summary of these results is also provided in Table 3. The results indicate that five of the indices are stable across the text lengths investigated, including the two versions of MTLD, the two versions of MATTR, and Maas’s index. Number of types, TTR, and Root TTR all demonstrated large correlations with text length (with absolute values above r = .800). Finally, the lexical diversity index D, which in this study was operationalized as HD-D, demonstrated a moderate (r = .505) correlation with text length.
Relationship between lexical diversity scores and text length. Solid gray line represents the line of best fit over the entire data set. The black dashed line represents the moving line of best fit (Loess line).

Correlations between lexical diversity indices and text length across bins
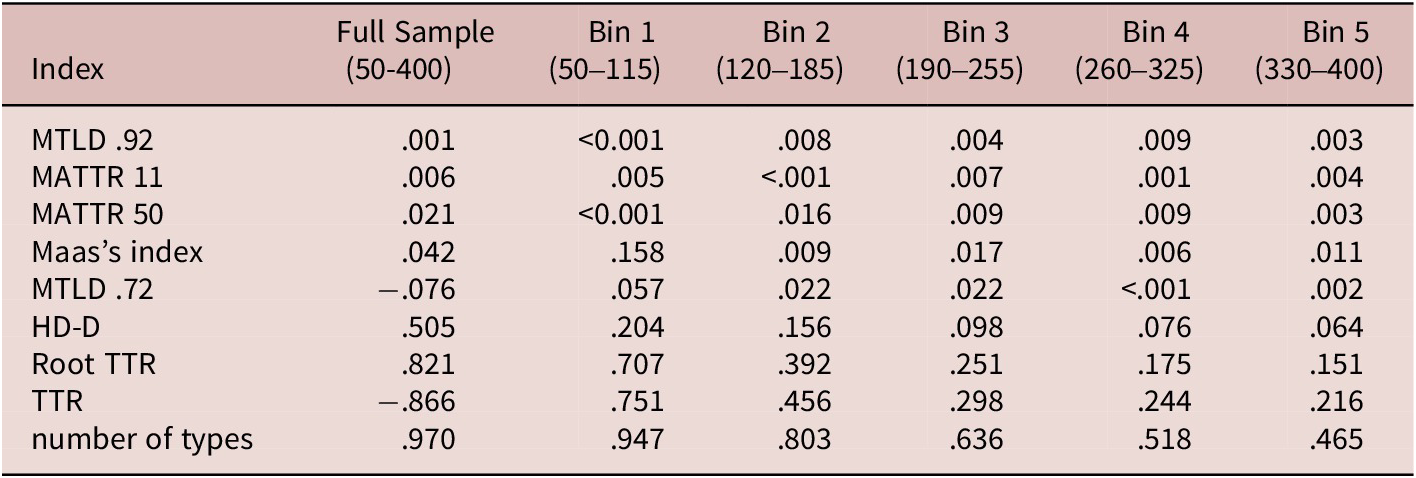
Note. Indices are arranged in ascending order according to their correlation with segment length in the full sample (50–400 tokens).
In the second approach, we analyze the relationship between sample size and lexical diversity scores within five text-length bins (50–115; 120–185; 190–255; 260–325; 330–400) to determine whether the observed relationships change with increasing text lengths. The results of this analysis are summarized in Figure 5. The solid gray line indicates the correlation between lexical diversity score and text length over the entire sample. The closer this line is to zero, the more stable the lexical diversity index is across the entire dataset. The plotted points indicate the correlation between lexical diversity score and text length in a particular bin. Again, the closer these points are to zero, the more stable the index is across text lengths in that bin. The dashed line indicates the lower threshold for a “small” correlation (r = .100) according to Cohen (Reference Cohen1988). A summary of these results is also provided in Table 3. The results show that the two versions of MTLD and the two versions of MATTR remain below a correlation of r = .100 across all bin lengths, indicating that they are particularly reliable with respect to text-length effects. Maas’s index is reliable for each bin starting at Bin 2 (120–185 words), suggesting that Maas’s index scores are likely to be comparable for texts that are at least 120 words long and do not differ by more than 65 words in length. The lexical diversity index D, which is operationalized as HD-D, is reliable within bins starting at Bin 3 (190–255 words). Although TTR and Root TTR become more stable as text length increases, they do not achieve full stability for any of the bins in this study.
Relationship between lexical diversity score and text length across bins. The solid gray line represents the correlation between lexical diversity index scores and text length for texts ranging from 50 to 400 words. The dashed gray line represents the lower threshold for a “small” correlation (r = .100). The dots indicate the correlation between lexical diversity scores and text length within each text-length bin. Bin 1 = 50–115 words, Bin 2 = 120–185 words, Bin 3 = 190–255 words, Bin 4 = 260–325 words, and Bin 5 = 330–400 words.

RQ1 interim discussion
The results indicate that five of the indices examined in this study (MATTR 50, MATTR 11, MTLD .72, MTLD .92, and Maas’s index) demonstrate negligible correlations with segment length. Of these five, all indices but one (Maas’s index) are stable across the entire range of text lengths examined. In contrast to recent, large scale analyses of L2 written texts (Zenker & Kyle, Reference Zenker and Kyle2021), the index D (operationalized as HD-D) demonstrated a moderate correlation with text length (r = .505) suggesting that it should not be used to measure lexical diversity in oral proficiency interview settings.
RQ2
To address the second research question, which was concerned with the validity of text-length stable indices of lexical diversity, a correlational analysis was conducted between five indices of lexical diversity and holistic oral proficiency interview score. For comparison, correlations between the holistic scores and both (a) number of tokens and (b) number of types are also included. Descriptive statistics are reported in Table 4, and the results of the correlation analysis are reported in Table 5.Footnote 1
Descriptive statistics for SST and lexical diversity scores calculated across all texts in the corpus (n = 1,281)

Correlations between text-length stable indices and SST score

RQ2 interim discussion
The results show that of the text-length stable indices, MATTR 11 demonstrates the largest correlation with SST score (r = .504), followed by MTLD .92 (r = .430). Given that these two indices provided reliable values across different text-length segments, they preliminarily represent excellent options for measuring lexical diversity in oral proficiency interview settings.
Meaningful but small correlations were also observed between SST score and Maas’s index, MATTR 50, and MTLD .72, respectively. These results suggest that although Maas’s index controls for the variability introduced by different token counts, it also appears to suppress the variability in lexical diversity scores that can be attributed to differences in proficiency (r = .146). To a lesser degree, a similar pattern is found with MATTR 50 and MTLD .72, though these indices capture more of the variability across proficiency levels.
RQ3
To address the third research question, which was concerned with the stability of lexical diversity indices across tasks within the SST, a series of linear mixed-effects models were conducted. The descriptive statistics are reported in Table 6 and the results from our analysis of differences across stages are summarized in Table 7. A full account of the model outputs is available in the online supplementary material (https://osf.io/ya8se).
Descriptive statistics for lexical diversity scores across tasks

Summary of differences across stages

RQ3 interim discussion
The results of the linear mixed-effects models—in particular the low R 2Marginal values—indicated that the variance in lexical diversity scores explained by task (oral proficiency interview stage) was negligible. Furthermore, the difference between the R 2Conditional values and the R 2Marginal values shows that more variance in lexical diversity scores was explained by differences across participants than by differences across tasks. A follow-up pairwise analysis using the estimated marginal means produced by the mixed-effects models supported this finding, with two minor exceptions: small differences were found between Stages 2 and 3 for Maas’s index (d = -.255) and between Stages 2 and 4 for MATTR 50 (d = .230). No meaningful differences were found across tasks for MATTR 11, MTLD .72, or MTLD .92, suggesting that these indices can be used to compare lexical diversity across single-picture description, role play, and sequential picture storytelling tasks.
Discussion
In this large-scale study, we investigated aspects of the reliability and validity of indices of lexical diversity in an oral proficiency interview context. We first examined the degree to which indices of lexical diversity produced scores that were reliable (i.e., consistent) across texts of different lengths. Following previous L2 writing studies and small-scale L2 spoken studies, we found that number of types, TTR, and Root TTR are strongly and intrinsically related to text length in oral proficiency interview settings. Although these results are not surprising given previous research, it bears repeating that Root TTR conflates lexical diversity and text length given the fact that it continues to be used as an index of lexical diversity in SLA research (Bulté & Housen, Reference Bulté and Housen2019; Lambelet, Reference Lambelet2021). This study also found that D is moderately and intrinsically related to text length (r = .505) in oral proficiency contexts. This finding contrasts with some previous studies that have focused on L1 and L2 written contexts (McCarthy & Jarvis, Reference McCarthy and Jarvis2007; Zenker & Kyle, Reference Zenker and Kyle2021) but supports previous small-scale studies that focused on oral task responses (Koizumi & In’nami, Reference Koizumi and In’nami2012). Although D (operationalized as either HD-D or vocd-D) has been used widely in SLA studies (Polat & Kim, Reference Polat and Kim2014; Révész et al., Reference Révész, Ekiert and Torgersen2016; Vercellotti, Reference Vercellotti2017) based on previous research that supported its use in written contexts, the findings of this study suggest that D also conflates text length and lexical diversity in oral proficiency interview settings and should not be used in these settings as a measure of lexical diversity. Following previous L1 and L2 writing studies, this study found that MTLD (both in its classic and optimized forms) was stable across oral texts ranging in length from 50 to 400 words. Similarly, MATTR (both in its classic and optimized forms) was stable across oral texts ranging in length from 50 to 400 words. Previous research in L1 and L2 contexts has shown that Maas’s index is reasonably stable across text lengths (cf., Koizumi & In’nami, Reference Koizumi and In’nami2012), though usually not quite as stable as other options such as MTLD and MATTR. The findings of this study were similar—Maas’s index was reasonably resistant to text-length effects in an oral proficiency interview setting, but it was less stable than MTLD and MATTR.
After determining that Maas’s index, MATTR, and MTLD produced highly reliable scores across texts of different lengths, we proceeded to investigate the degree to which these indices were valid indicators of L2 spoken proficiency. The results indicated that although Maas’s index was reasonably stable across different text lengths, it was only weakly related to oral proficiency scores, which calls into question its validity as a measure of L2 spoken lexical diversity. The classic versions of MATTR (MATTR 50) and MTLD (MTLD .72) demonstrated small correlations with oral proficiency scores, and the optimized versions of these indices (MATTR 11 and MTLD .92) demonstrated moderate correlations with oral proficiency scores, with MATTR 11 demonstrating the strongest relationship (r = .504). These results generally support previous studies that have found moderate correlations between MATTR and MTLD on the one hand and writing or speaking proficiency scores on the other (Bulté & Roothooft, Reference Bulté and Roothooft2020; Kyle et al., Reference Kyle, Crossley and Jarvis2021; Treffers-Daller et al., Reference Treffers-Daller, Parslow and Williams2018). These results suggest that MATTR and MTLD are appropriate choices for the measurement of lexical diversity in oral-proficiency interview settings and that index values obtained by averaging across shorter segments (as furnished via 11-word windows in the case of MATTR or a target TTR of .92 in the case of MTLD) are more closely related to oral proficiency ratings than those obtained by averaging across longer segments.
As a final step, we investigated the relationship between lexical diversity index scores and oral task types. To do so, we conducted linear mixed-effects models with post hoc comparisons to determine the degree to which lexical diversity scores differed across a picture description task, a role play task, and a sequential picture storytelling task. Overall, the results indicated that differences in Maas’s index, MATTR, and MTLD were particularly small across these tasks. In post hoc pairwise analyses, only two meaningful (but small) differences were found: Maas’s index demonstrated a small (d = -.255) difference between the single-picture description task and the role play task, whereas MATTR 50 demonstrated a small (d = .230) difference between the single-picture description task and the sequential picture storytelling task. These results diverge from those of previous L2 writing studies (Alexopoulou et al., Reference Alexopoulou, Michel, Murakami and Meurers2017; Yoon, Reference Yoon2017; Zenker & Kyle, Reference Zenker and Kyle2021) that found systematic differences across written task types and task prompts. It is possible that less variation was found across spoken task responses than in written ones because spoken texts tend to have a higher proportion of (repeated) function words, whereas written texts tend to have a higher density of content words (e.g., Biber et al., Reference Biber, Conrad, Reppen, Byrd, Helt, Clark, Cortes, Csomay and Urzua2004; Kyle et al., Reference Kyle, Eguchi, Choe and LaFlair2022; Read, Reference Read2000). Function word repetition may smooth out differences in content word use across tasks. Another potential explanation for these results is that prompt differences within each task may have muted across-task differences. In the SST, much like in an ACTFL OPI, the interviewer chooses prompts based on how an interview unfolds, leading to a substantial heterogeneity in the combination of prompts that are represented in the corpus. As some previous studies (Zenker & Kyle, Reference Zenker and Kyle2021) have found within-task (across prompt) differences in lexical diversity scores across tasks, this heterogeneity may have contributed to the observed (and substantial) random effects. More research is needed across a wider range of oral tasks to determine the degree to which lexical diversity scores are indeed stable across oral tasks.
Taken together, the results suggest that MATTR and MTLD are highly reliable and reasonably valid measures of lexical diversity in L2 oral proficiency interview settings but TTR, Root TTR, and D are not. Furthermore, the results of this study indicate that MATTR 11 is a particularly appropriate measure of lexical diversity in oral proficiency interview settings because it is stable across text lengths, demonstrates the strongest relationship with oral proficiency interview scores, and is stable across the oral tasks investigated. In contrast, Root TTR was found to be strongly related to text length in oral proficiency interview settings, which suggests that it should not be used as an index of lexical diversity. Although some researchers (Bulté & Roothooft, Reference Bulté and Roothooft2020) have argued that Root TTR’s relationship with text length is not necessarily a bad thing (e.g., because it means that a single index can be used to measure productivity and diversity simultaneously), we argue that it is important and advantageous to measure constructs in as precise a manner as is possible. For example, if researchers decide that they wish to measure proficiency using text length (e.g., as a measure of fluency or productivity) and lexical diversity, we argue that it is preferable to include them as distinct indices so that the relative contribution of each can be accounted for. In reference to the data in this study, if we use Root TTR to predict SST scores in a linear regression,Footnote 2 we explain more variance (R 2 = .383) than if we use the strongest text-length stable index (MATTR11; R 2 = .254), but we cannot be sure how much of the former variance is attributable to text length and how much is attributable to lexical diversity. If we include both text length and these indices in a regression, Root TTR + text length explains approximately the same amount of variance (R 2adj. = .692) as MATTR11 + text length (R2adj. = .707). However, in the latter model, we can estimate that 25.4% of the variance explained by the model is attributable to lexical diversity (MATTR11) and 45.3% of the variance is attributable to text length. Such an estimation is not conceptually possible with Root TTR because it because it conflates lexical diversity and text length. Using indices that measure a distinct construct or subconstruct helps us understand longitudinal development and/or differences across proficiency levels more deeply and in a more fine-grained manner. Doing so also allows researchers to create composite measures that are transparent. For related arguments in support of fine-grained and precise measures of linguistic complexity, see Biber et al. (Reference Biber, Gray and Poonpon2011), Jarvis (Reference Jarvis2013), Kyle and Crossley (Reference Kyle and Crossley2018), and Norris & Ortega (Reference Norris and Ortega2009), inter alia. Furthermore, the results indicated that D is also moderately related to text length (r = .505) and therefore should not be used as a measure of lexical diversity in oral proficiency interview settings. It should be noted that although this finding goes against conventional wisdom in SLA, both large-scale studies that have used oral L1 texts (McCarthy & Jarvis, Reference McCarthy and Jarvis2007) and small-scale studies that have used oral L2 texts (Koizumi & In’nami, Reference Koizumi and In’nami2012) have found a relationship between D and text length.
Limitations and future directions
This study has some limitations that should be addressed in future studies. First, although our sample was large, it was also homogenous with respect to L1 (Japanese). Future research should investigate other L1 groups. Second, although the oral tasks used (single-picture description, role play, and sequential picture storytelling) are common in SLA research and L2 assessment, they do not comprehensively represent the types of oral tasks used in related studies. Future research should therefore also examine the validity and reliability of lexical diversity indices with other oral tasks (argumentative monologues, personal experience monologues, etc.). Third, we investigated the validity of text-length stable lexical diversity indices using only holistic speaking proficiency scores. Although this approach to validating lexical diversity indices is common in the field, it would also be helpful to investigate the relationship between automated lexical diversity indices and direct human judgments of the lexical diversity in oral texts following recent research in the realm of L2 writing (Jarvis, Reference Jarvis2017; Kyle et al., Reference Kyle, Crossley and Jarvis2021). Fourth, in this study, we investigated the effects of text length and task on indices of lexical diversity, but did not investigate other potential construct-irrelevant confounds. Finally, although we investigated the stability of lexical diversity indices across the three task types used in this study, previous L2 writing research (Alexopoulou et al., Reference Alexopoulou, Michel, Murakami and Meurers2017) has suggested that both task and prompt may affect lexical diversity scores. Therefore, in addition to examining the stability of lexical diversity scores across a wider range of tasks, future research should also probe the reliability of lexical diversity indices across different types of prompts, which was not investigated in this study.
Conclusion
Lexical diversity is and has been an important construct in the measurement of written and oral proficiency in studies of L2 development and assessment for some time. However, many indices that have been used to measure lexical diversity lack sufficient reliability and/or validity. In this study, we evaluated lexical diversity indices with respect to two aspects of reliability and one aspect of validity. The results showed that TTR, Root TTR (Guiraud’s index), and D (operationalized as HD-D) demonstrated low reliability across oral task responses ranging from 50–400 words. Of the indices of lexical diversity that were highly reliable across different text lengths, MATTR and MTLD (and in particular an optimized version of MATTR) demonstrated moderate correlations with holistic oral proficiency scores, providing some validity evidence. Furthermore, the optimized versions of MATTR and MTLD were highly reliable across the three oral task types investigated. In line with previous research (primarily in written contexts), the present results suggest that SLA researchers should not use Root TTR to index lexical diversity because it conflates diversity and text length. Furthermore, the results suggest that SLA research should not use D as a measure of lexical diversity with spoken L2 production data because it also conflates diversity and text length. Instead, researchers should use MATTR or possibly MTLD to measure lexical diversity in L2 oral task responses given the empirical evidence that supports arguments for their reliability and validity.
Data availability statement
The experiment in this article earned Open Data and Open Materials badges for transparent practices. The materials and data are available at https://osf.io/ya8se.
Appendix A

Note. The original rubric was accessed at http://tsst.alc.co.jp/sst/e/index.html on January 22, 2020. The rubric (with exemplars from each level) can now be found at https://tsst.alc.co.jp/biz/en/level/.



