





The large-scale introduction of English in primary schools is one of the most influential educational policy developments (Johnstone, Reference Johnstone, Enever, Moon and Raman2009). This shift toward early English instruction has created a high demand for age-appropriate proficiency assessments to meet the needs of stakeholders, including schools and parents (Huang, Bailey, Sass, & Shawn Chang, Reference Huang, Bailey, Sass and Shawn Chang2021). The global increase in English language education and assessment for young learners has fueled growing research interest in these topics over the past 25 years (see, e.g., Cho & Blood, Reference Cho and Blood2020; De Wilde, Brysbaert, & Eyckmans, Reference De Wilde, Brysbaert and Eyckmans2021; Lázaro-Ibarrola, Reference Lázaro-Ibarrola2024, Reference Lázaro-Ibarrola2025; Lázaro-Ibarrola & Roothooft, Reference Lázaro-Ibarrola and Roothooft2025).
Despite the surge in interest in teaching and assessing young learners, previous research has predominantly investigated young learners’ overall proficiency gains over time across various language skills (e.g., Lázaro-Ibarrola, Reference Lázaro-Ibarrola2025; Lázaro-Ibarrola & Roothooft, Reference Lázaro-Ibarrola and Roothooft2025). While findings on overall proficiency gains provide evidence of learners’ general improvement, they offer limited, if any, insights into the nature of that development. In fact, gains in overall proficiency entail improvement in specific linguistic features, which, in turn, exerts a positive influence on overall proficiency (see Saito & Plonsky, Reference Saito and Plonsky2019). Fine-grained analyses of linguistic features of speaking reveal the underlying mechanisms of language growth (Norris & Ortega, Reference Norris and Ortega2009), especially for young learners whose linguistic development exhibits uneven progress across different dimensions of language (Muñoz, Reference Muñoz2014). However, despite the importance of examining such fine-grained features, research on the developmental trajectories of young foreign language (FL) learners’ linguistic features of speaking and their relationships with learner background characteristics from a longitudinal perspective is scarce. These features have been shown to differentiate young learners across different proficiency levels (Gu & Hsieh, Reference Gu and Hsieh2019; Hsieh & Wang, Reference Hsieh and Wang2019) and are amenable to the influence of individual differences (Muñoz, Reference Muñoz2014). Yet, no research has systematically examined how growth in linguistic features of young learners’ speaking unfolds in relation to background variables. Furthermore, the role of educational context in shaping young learners’ development of spoken language features remains largely unexplored.
To address the existing gaps, the current investigation adopts a longitudinal approach to exploring the relationships between young FL learners’ (aged 10 to 12 years) background and contextual factors and their progression in linguistic features of speaking over a semester in Mexico, an English as a Foreign Language (EFL) context that has received less attention in the literature compared with other South American countries (Ruiz de Zarobe & Banegas, Reference Ruiz de Zarobe and Banegas2024).
Literature review
Linguistic features as correlates of oral proficiency
The construct of second language (L2) oral proficiency is multi-componential, composed of a set of principal dimensions, including fluency, vocabulary, grammar, and pronunciation (De Jong et al., Reference De Jong, Steinel, Florijn, Schoonen and Hulstijn2013). These dimensions distinguish learners across proficiency levels, including young learners who are the focus of the current study (Gu & Hsieh, Reference Gu and Hsieh2019). This section reviews the literature on the contribution of linguistic features to L2 learners’ oral proficiency, focusing primarily on 10–12-year-old learners.
Fluency
Oral fluency is both a predictor and a product of L2 proficiency (Suzuki & Kormos, Reference Suzuki and Kormos2025; Tavakoli, Nakatsuhara, & Hunter, Reference Tavakoli, Nakatsuhara and Hunter2020). In L2 fluency research, the temporal characteristics of speech are referred to as utterance fluency (Segalowitz, Reference Segalowitz2010), which encompasses several measurable aspects, including breakdown fluency, speed fluency, and repair fluency (Tavakoli & Skehan, Reference Tavakoli, Skehan and Ellis2005). Breakdown fluency refers to pausing behavior and can be measured by counting the number and length of filled and silent pauses. Speed fluency is concerned with the speed with which speech is delivered and can be measured by calculating measures of speech rate, including syllables per second, articulation rate, and mean length of run. Repair fluency is a speaker’s false starts, corrections, and repetitions during oral communication (De Jong et al., Reference De Jong, Steinel, Florijn, Schoonen and Hulstijn2013; Suzuki, Kormos, & Uchihara, Reference Suzuki, Kormos and Uchihara2021). Empirical research on young learners’ fluency development over time is relatively rare. Djigunović (Reference Djigunović and Nikolov2016) investigated the oral proficiency development of young Croatian learners (aged 11 at the start and 14 at the end of the study) over 4 years and found that fluency manifested a consistent growth over time and that the young learners’ fluency ratings did not vary across different speaking tasks. Hsieh and Wang (Reference Hsieh and Wang2019) found that high-proficiency TOEFL Junior test takers (mean age 13.6) spoke significantly faster than their lower proficiency peers, and their speech featured shorter pause duration, relatively fewer filled and unfilled pauses, and longer stretches of chunks. These findings were further confirmed by Gu and Hsieh (Reference Gu and Hsieh2019), who reported that higher proficiency young learners aged 9–12 produced fewer pauses and longer stretches of speech than their lower proficiency peers.
Vocabulary
Vocabulary knowledge, including lexical range (the ratio of word types to word tokens) and lexical richness (the proportion of high- and low-frequency vocabulary), is associated with L2 oral proficiency (e.g., Brown, Iwashita, & McNamara, Reference Brown, Iwashita and McNamara2005; Iwashita, Brown, McNamara, & O’Hagan, Reference Iwashita, Brown, McNamara and O’Hagan2008). Investigating young learners’ TOEFL Junior spoken responses across four proficiency levels, Hsieh and Wang (Reference Hsieh and Wang2019) found that more proficient learners produced a wider range of words as well as words that were less familiar, more abstract, and harder to associate with an image. Comparable findings were echoed in Gu and Hsieh (Reference Gu and Hsieh2019), who found that more proficient young learners tended to use a wider range of words in their speech compared with their less proficient peers. Orosz (Reference Orosz and Nikolov2009) examined young learners’ (aged 9–12) vocabulary size in the first 4 years of English study at a Hungarian primary school. The results revealed that during the first 3 years of English learning, young learners’ vocabulary size grew consistently every year, but the progress started to diminish in the fourth year. The findings also showed that the acquisition of more frequent words preceded the acquisition of less frequent vocabulary. This pattern was further supported by Roessingh and Elgie (Reference Roessingh and Elgie2009), in which K-2 English language learners acquired high-frequency English words very quickly and developed basic literacy skills. However, their speech lacked low-frequency words usually used by native speakers. In fact, young learners relied heavily on the first 250 high-frequency words to communicate their meaning. Overall, the empirical findings support that high-proficiency young learners know more words and that high-frequency words are acquired earlier than less frequent vocabulary.
Grammar
The grammar measures of syntactic accuracy and complexity are key components of oral proficiency (Norris & Ortega, Reference Norris and Ortega2009). Syntactic accuracy is assessed at two levels: global, in which all errors are identified, and specific, in which only a particular set of errors is considered, such as prepositions, article use, and plural markers (Iwashita et al., Reference Iwashita, Brown, McNamara and O’Hagan2008). Syntactic complexity is conceptualized as the characteristics of an utterance at the clausal level, such as the number of clauses per T-unit, the ratio of dependent clauses, and the verb phrase ratio (Iwashita et al., Reference Iwashita, Brown, McNamara and O’Hagan2008). Hsieh and Wang (Reference Hsieh and Wang2019) and Gu and Hsieh (Reference Gu and Hsieh2019) found that the spoken responses of high-proficiency TOEFL Junior test takers featured fewer grammatical errors and more clauses per speech unit than the spoken responses of lower proficiency test takers. Investigating the global accuracy of young EFL learners’ speech over 4 years, Djigunović (Reference Djigunović and Nikolov2016) observed a curvilinear pattern in which young learners progressed consistently in grades 5 and 6. The progress dipped in grade 7 and then picked up again in grade 8.
Pronunciation
Among various pronunciation features, lexical stress (i.e., stressing the appropriate syllable in a given word) has been identified as the most robust predictor of non-native speakers’ oral proficiency rating, surpassing other features such as fluency, segmentals, and tone choice (Kang, Reference Kang, Levis and LeVelle2012). Lexical stress errors are also strongly associated with the intelligibility of accented L2 speech (Kang et al., Reference Kang, Thomson and Moran2020). Despite its importance in L2 speech, to the best of our knowledge, no studies have systematically examined lexical stress development using speech data from young EFL learners, and research on adult learners has yielded mixed results. For example, while Kang, Ahn, Yaw, and Chung (Reference Kang, Ahn, Yaw and Chung2021) found that the lexical stress accuracy of EFL learners did not improve significantly after participating in a 3-month IELTS preparation course, Kang and Kermad (Reference Kang and Kermad2020) reported that adult learners significantly reduced their lexical stress errors after 3 months of immersion in an English as a Second Language (ESL) context. In this regard, the findings of the current study add to the limited existing body of research on lexical stress acquisition among young FL learners.
Content
Few empirical attempts have examined the content aspect of speech. In the domain of young language test takers, Hsieh and Wang (Reference Hsieh and Wang2019) examined the content quantity (i.e., the number of speech units and the number of clauses) and quality (i.e., the number of key points) of TOEFL Junior test takers and reported that both measures of content were influenced by proficiency level, in that more proficient test takers produced significantly more numbers of key points in the form of speech units and clauses compared to the less proficient ones. The current study extends the limited research base on the development of content quantity production among young FL learners.
Learner background variables and language proficiency development
Language proficiency development is shaped by various learner-related factors. Out-of-school exposure through frequent interactions with native speakers (e.g., Du, Reference Du2013), playing video games (e.g., Sylvén & Sundqvist, Reference Sylvén and Sundqvist2012), reading different texts (e.g., Montag & MacDonald, Reference Montag and MacDonald2015), or exposure to various media (e.g., Peters, Reference Peters2018) enhances the acquisition of different aspects of L2 proficiency, including fluency, vocabulary, and syntactic complexity and accuracy (Muñoz, Reference Muñoz2014). Additionally, the length of instruction, measured as the number of years of education inside and outside of school, has been shown to predict L2 learners’ gains in vocabulary (e.g., Peters, Reference Peters2018; Unsworth, Persson, Prins, & De Bot, Reference Unsworth, Persson, Prins and De Bot2014), syntactic complexity (e.g., Muñoz, Reference Muñoz2014), lexical stress accuracy (e.g., Saito & Hanzawa, Reference Saito and Hanzawa2016), and fluency (e.g., French, Gagné, & Collins, Reference French, Gagné and Collins2020). L2 learning experience and assessment practices have also been shown to impact the quality and quantity of L2 learning as well as assessment outcomes. Positive L2 learning experience is associated with increased motivation, greater metacognitive awareness, and a broader range of learning strategies among young learners, all of which contribute to academic achievement (Kim & García, Reference Kim and García2014; Wolf, Reference Wolf and Antony2024). Classroom assessment practices, including frequency, mode, and task type used by language teachers to evaluate students’ progress, play a critical role in shaping instruction, influencing learner behavior, and ultimately affecting L2 learning outcomes (Latif & Wasim, Reference Latif and Wasim2024; Yu & Xu, Reference Yu and Xu2021). In fact, frequent and multimodal assessment practices yield ample opportunities for L2 production and targeted feedback (see, e.g., Gass et al., Reference Gass, Behney and Plonsky2020). Given the established link between assessment practices and opportunities to learn, incorporating a measure of students’ assessment experiences will deepen our knowledge about how variations in L2 learning outcomes can be attributed to assessment-related practices. Prior L2 knowledge is likewise reported to influence language proficiency growth. De Wilde et al. (Reference De Wilde, Brysbaert and Eyckmans2021) found that the initial level of proficiency was a robust predictor of young learners’ (aged 10–12) receptive vocabulary and speaking proficiency gains, explaining 58% and 72% of the variance. Unsworth et al. (Reference Unsworth, Persson, Prins and De Bot2014) reported that prior knowledge was the best predictor of young EFL learners’ (mean age 10.37) receptive vocabulary and grammar proficiency growth. Jackel, Schurig, Florian, and Ritter (Reference Jackel, Schurig, Florian and Ritter2017) also indicated that proficiency accounted for 35% of the variance in young FL learners’ scores in receptive skills.
Educational context and language proficiency development
L2 learners’ proficiency gains are likely to vary as a function of the educational context in which they study (Lázaro-Ibarrola, Reference Lázaro-Ibarrola2024, Reference Lázaro-Ibarrola2025; Lázaro-Ibarrola & Roothooft, Reference Lázaro-Ibarrola and Roothooft2025; Lorenzo, Granados, & Rico, Reference Lorenzo, Granados and Rico2021). Such contexts can be broadly categorized into English as a Medium of Instruction (EMI), where English serves primarily as the language to teach academic content; Content Language Integrated Learning (CLIL), which places equal emphasis on language and academic content; and English as a Foreign Language (EFL), in which language is the main subject of instruction. In a recent meta-analysis, Lee, Lee, and Lo (Reference Lee, Lee and Lo2023) found a moderate overall advantage of EMI-CLIL programs over mainstream education settings. Their findings further revealed that EMI-CLIL instruction was more effective in improving receptive skills than productive skills. Complementing this evidence, numerous primary studies have shown that EMI-CLIL is associated with improvements in overall speaking (e.g., Lázaro-Ibarrola, Reference Lázaro-Ibarrola2012, Reference Lázaro-Ibarrola2025; Merino & Lasagabaster, Reference Merino and Lasagabaster2018) and reading proficiency (Lázaro-Ibarrola & Roothooft, Reference Lázaro-Ibarrola and Roothooft2025) as well as in specific linguistic features of speaking, including vocabulary (e.g., Azpilicueta-Martínez, Reference Azpilicueta-Martínez2025), grammar complexity, and subordination/dependent clauses (e.g., Azpilicueta-Martínez, Reference Azpilicueta-Martínez2024), and fluency (e.g., Pérez Cañado & Lancaster, Reference Pérez Cañado and Lancaster2017). In contrast, pronunciation has emerged as a feature that appears less sensitive to instructional settings (see, e.g., Pérez Cañado & Lancaster, Reference Pérez Cañado and Lancaster2017; Rallo Fabra & Jacob, Reference Rallo Fabra, Jacob, Juan-Garau and Noguera2015). These findings, however, should be interpreted with caution, as EMI-CLIL is typically characterized by a higher level of exposure to the FL, making it difficult to discern whether improvements can be ascribed to the EMI-CLIL factor or just to the additional exposure. Against this backdrop, the present study explored variations in gains in linguistic features of speaking among Mexican young learners across three educational contexts—Bilingual, Private, and Public schools—where the first two represent the EMI-CLIL models and the latter follows an EFL model.
The current study
The current study is part of a larger project examining the relationship between young FL learners’ background variables, educational context, and proficiency gains on the TOEFL Primary test over time. Our previous findings showed that speaking was the only skill that improved significantly over 6 months, reflecting a CEFR transition from A1 at T1 to A2 at T2. These gains in speaking proficiency were influenced by learners’ educational context and initial proficiency, which further indicated that progress was not uniform across all learners. Building on that, the present study specifically explores the development of linguistic features of speaking, including fluency, grammar, vocabulary, pronunciation, and content, and their relationship with learner background (i.e., hours of study, target language use, English learning experience, assessment practices, and initial proficiency) and contextual factors.
Research on young learners’ (aged 10–12) development of spoken linguistic features remains scarce, particularly from a longitudinal perspective. This age range is theoretically significant because previous research (e.g., Hartshorne, Tenenbaum, & Pinker, Reference Hartshorne, Tenenbaum and Pinker2018) suggests that L2 learning ability begins to decline after age 12, making this age range theoretically informative. Moreover, young learners at this age may possess more cognitive advantages, such as superior working memory compared to much younger learners, which can facilitate L2 learning/acquisition (see Swanson, Reference Swanson2015). Finally, the 6-month timeframe adopted in this study aligns with prior recommendations suggesting that a 6-month interval between test administrations is appropriate for young learners to demonstrate gains in their scores (Educational Testing Service [ETS], 2023; see also Cho & Blood, Reference Cho and Blood2020; Gu, Lockwood, & Powers, Reference Gu, Lockwood and Powers2015).
In the current study, participating schools assessed young learners’ English proficiency using school-designed proficiency tests. Although those in-house assessments share some similarities with the TOEFL Primary test, none of the students had prior exposure to the TOEFL Primary. We selected the TOEFL Primary test because it is a standardized instrument specifically developed for young learners (as young as 8 years old) whose proficiency ranges from A1 to B2 (ETS, 2023), making it appropriate for capturing developmental trajectories in our sample. Analyses focus on speaking tasks 5 and 6 of the TOEFL Primary test, picture description and narration, which elicit comparably longer, more detailed responses, providing a richer sample for examining linguistic development. The selection of linguistic features is informed by prior research demonstrating that they distinguish young learners across proficiency levels (Gu & Hsieh, Reference Gu and Hsieh2019; Hsieh & Wang, Reference Hsieh and Wang2019), as well as by the authors’ pilot studies, which showed their potential to capture developmental change. Background variables were chosen based on previous research with young learners in FL contexts (e.g., De Wilde et al., Reference De Wilde, Brysbaert and Eyckmans2020, Reference De Wilde, Brysbaert and Eyckmans2021; Muñoz, Reference Muñoz2014).
The current study was conducted at three primary schools in Sonora, Mexico: (a) a Public school (low-exposure EFL), (b) a Private school (EMI/low-CLIL), and (c) a Bilingual school (immersion/high-CLIL). The English instruction program in the Public school consists of 2.5 hr per week, spread across three 50-min sessions, with the curriculum relying primarily on state-funded textbooks. The Public school does not charge tuition and generally serves students from lower socioeconomic status families. The Private school offers 7.5 hr of English instruction per week, divided into five sessions of English, where the language is taught for communicative purposes, and 12 sessions of Science class in English (content-based instruction). The Private school typically serves students from middle to high socioeconomic status families. In the Bilingual/bicultural school, English immersion serves as the learning context for students. Core content classes are taught in English for a total of 30 hr of exposure to English every week. Due to high tuition and enrollment fees, this school mainly serves students from higher socioeconomic status families.
Although teaching oral skills is often neglected in Public schools in Mexico, Private and Bilingual schools prioritize oral skills through a variety of strategies designed to provide students with practice and build their confidence in using English. Common classroom activities include role-playing, singing, drilling (e.g., repeating after the teacher or a model, modifying words in a sentence), describing and predicting, interviewing and reporting, telling or retelling stories and anecdotes, and rephrasing ideas using different vocabulary, among others. Teachers view it as important to provide constructive feedback while supporting students and offering them encouragement and praise, with the goal of boosting their self-confidence. Additionally, the use of the internet, videos, or other online tools is becoming an integral part of instruction. Overall, students are motivated to use and practice English actively during class time (School coordinators, personal communication, July 9, 2025).
Research questions
The present study addresses the following research questions:
-
1. How do young FL learners’ linguistic changes in the picture description and narration tasks of the TOEFL Primary speaking test differ across educational contexts (i.e., Bilingual [immersion/high-CLIL], Private [EMI/low-CLIL], and Public school [low-exposure EFL])?
-
2. To what extent do learner background variables (e.g., hours of study, target language use, English learning experience, assessment practice, initial proficiency) predict young FL learners’ linguistic changes in speaking in the picture description and narration tasks of the TOEFL Primary speaking test across educational contexts (i.e., Bilingual [immersion/high-CLIL], Private [EMI/low-CLIL], and Public school [low-exposure EFL]) and why?
Hypotheses
H1: Based on previous research on CLIL-oriented instruction, Bilingual and Private school learners are expected to exhibit comparatively greater gains across several linguistic dimensions of speaking than Public school learners.
H2: Drawing on previous literature, it is expected that learner background variables significantly predict young learners’ development in linguistic features of speaking over time.
Method
The study adopted a longitudinal research design, with data collection occurring at three stages: at the onset (T1), at midpoint, and at the end (T2) of the study. At T1, after completing informed consent, participants responded to a set of online background questionnaires that collected information about (a) participants’ demographics, (b) the number of hours they spent studying English, (c) the amount of target language use they had, and (d) participants’ perceptions of their English learning experience. After completing the online background questionnaires, participants took the official computer-based TOEFL Primary speaking test provided by ETS. At midpoint (3 months after T1), the participants completed the online hours of study and target language use questionnaires for a second time. At T2 (6 months after T1), participants completed another set of online background questionnaires that included (a) hours of study, (b) target language use, and (c) assessment practices at school. After completing the online questionnaires, the participants took the same computer-based TOEFL Primary speaking test for a second time. Two rounds of oral interviews were also conducted with learners and teachers at the end of the study, and the recorded interviews were transcribed for further analysis. Figure 1 provides a summary of the study design.
Overall design of the study.

Participants
The study included two groups of participants: learners and teachers. The learner participants were 110 young FL learners from nine sixth-grade classes in Sonora, Mexico. The learners were 55 females and 55 males, ranging in age from 10 to 12 years, with an average age of 10.98 (SD = 0.40). Due to incomplete speaking test data at either T1 or T2 from eight learners (7.3%), the final dataset comprised 102 learners. The learners were particularly recruited from three pedagogically distinct elementary schools: 36 were from three classes at a Bilingual school, 33 were from four classes at a Private school, and the remaining 33 were from two classes at a Public school. All learners were native speakers of Spanish, and 72.73% self-reported speaking only Spanish at home, while 22.72% reported speaking a combination of Spanish and English. The learners’ English speaking proficiency fell within pre-A1 to B2 as indicated by their performance on the speaking section of the TOEFL Primary test (see Table 1 for a breakdown of the learners’ demographics across the three learning contexts). Six teachers were also recruited from the respective schools (Bilingual school, n = 3; Private school, n = 2; Public school, n = 1) to participate in oral interviews at the end of the study. The teachers were five females and one male, ranging in age from 28 to 45 years, with an average age of 37 years (SD = 6.75). The teachers were all Spanish L1 speakers and self-reported an average of 14.83 years of teaching experience (SD = 6.08).
Learners’ demographic characteristics across the three learning contexts

Table 1. Long description
The table consists of four columns: Educational context, N (sample size), Hours of English instruction per week, and Speaking proficiency.
* The first row describes the Bilingual context with an N of 36, 30 hours of English instruction per week, and a speaking proficiency of B 1 to B 2.
* The second row describes the Private context with an N of 33, 7.5 hours of English instruction per week, and a speaking proficiency of A 2 to B 1.
* The third row describes the Public context with an N of 33, 2.5 hours of English instruction per week, and a speaking proficiency of Below A 1 to A 1.
Variables and instruments
The study variables included (1) young learners’ scores on a range of linguistic features extracted from responses to the TOEFL Primary picture description and narration tasks: (a) fluency (speech rate, silent pauses), (b) pronunciation (lexical stress), (c) vocabulary (lexical resource), and (d) grammar (syntactic complexity, accuracy, and dependent clause ratio); (2) learning context (Bilingual, Private, or Public schools); and (3) background variables, including (a) initial proficiency (T1 scores on the linguistic features), (b) hours of English study, (c) target language use, (d) perceptions of English learning, and (e) assessment practices.
The TOEFL Primary speaking test
The same official computer-based TOEFL Primary speaking test was administered twice, at the beginning (T1) and at the end of the 6 months (T2), to assess young learners’ improvement in the linguistic features of speaking. The speaking section of the test included eight questions and took approximately 20 min to complete. The questions assessed young learners’ ability to perform a variety of tasks, ranging from seeing and describing parts of a picture to telling a story based on watching an animation. The speaking score range was 0–27, which corresponds to A1–B2 levels (ETS, 2023). For this study, learners’ responses to questions 5 and 6 were selected for speech analysis, as these prompts elicited comparatively longer utterances. Question 5 was a picture description task in which the learners saw a picture, and then a character asked them to speak for 20 s, describing parts of the picture. Question 6 was a narration task in which learners watched a short animation and then were asked to speak for 30 s, telling a story based on what they had seen.
Background questionnaires
Online background questionnaires were administered to all learners at T1, midpoint, and T2 via Qualtrics (see Supplementary Appendix A). The questionnaires solicited information about a range of background variables that could potentially predict young learners’ score gains in the linguistic features of speaking. These variables included young learners’ demographics, overall hours of English study, amount of target language use, perceptions of English learning experience, and assessment-related practices. To ensure that young learners could comprehend the survey questions, the questions were presented in English and Spanish.
Hours of study. Hours of study was measured through nine items, which were administered to the learners at T1, midpoint, and T2. The items were adapted from Kang et al. (Reference Kang, Ahn, Yaw and Chung2021) and asked about the total number of hours young learners spent studying in class and outside of class last week. The items targeted attending English class; doing homework; going to language school; studying alone and with others outside of class; and practicing language skills, including reading, listening, speaking, and writing. For each item, participants had 10 answer options to choose from, ranging from 0 hr to more than 16 hr. Composite scores from these nine items across T1, mid-point, and T2 were used for analysis.
Target language use. The amount of target language use was measured through 11 items in which young learners reported on the hours of weekly English contact and exposure they had outside of the study context. The items were adapted from Freed, Dewey, Segalowitz, and Halter (Reference Freed, Dewey, Segalowitz and Halter2004) and have been used by Kang et al. (Reference Kang, Ahn, Yaw and Chung2021). These items focused specifically on using English when communicating with native speakers (NSs), non-native speakers (NNSs), family members, and when playing online games. They also measured exposure to English through watching TV, movies, and YouTube videos, as well as listening to music, using social media, and reading for pleasure. The items included 10 answer options that ranged from 0 hr to more than 16 hr and were administered to the learners at the T1, midpoint, and T2 phases of the study. Composite scores from the 11 items across T1, midpoint, and T2 were used for analysis.
Learners’ perceptions of English learning experience. Learners’ perceptions were measured through five items adapted from Kim and García (Reference Kim and García2014) and Hunt (Reference Hunt2011). On a Likert scale ranging from 1 (not true at all) to 10 (very true), the items asked about the extent to which young learners enjoyed their English classes as well as the activities and homework they completed in their English classes, the extent to which they had clear English learning objectives, and to what extent they were satisfied with their improvements in their English classes. The measure was administered only at T1, and composite scores from these five items were used for analysis.
Assessment practices. Assessment practices were measured through four items adapted from Gu and So (Reference Gu, So, Wolf and Butler2017). The items asked learners about the frequency, type, and mode of English tests (individual vs. group projects) they completed in class and at school throughout the semester. The measure was administered only at T2, and composite scores from these four items were used for analysis.
Oral interviews
To gain additional insights into learners’ progress over the 6-month study period and to complement the quantitative findings, two sets of semi-structured oral interviews (see Supplementary Appendix B) were conducted at the end of the study with six teachers (Bilingual school, n = 3; Private school, n = 2; and Public school, n = 1) and 15 learners (Bilingual school, n = 6; Private school, n = 5; and Public school, n = 4). The interview participants were selected randomly from each school type to ensure representation of the target population. Informed consent was obtained from all interview participants and the young learners’ guardians where applicable. Each interview session lasted for approximately 30 min. The learner interview questions explored factors that could have influenced the language development during the study period, whereas the teachers’ interview questions solicited information about classroom practices and contextual factors that could help explain variation in the learner outcomes. Questions were presented in English; however, the participants had the option of responding in English or Spanish. Responses to the oral interview questions were transcribed by the third author, whose L1 is Spanish.
Data analysis
Data analysis involved transcribing the speech files and coding them for a range of linguistic features through manual coding and automatic feature extraction. The data were then submitted to a set of bivariate and multivariate statistical analyses to answer the research questions.
Linguistic analysis
Learners’ responses to the picture description and narration tasks were transcribed orthographically using a consistent transcription convention (Biber, Conrad, & Cortes, Reference Biber, Conrad and Cortes2004), with all repetitions, false starts, and disfluency features such as “um” and “uh” removed to ensure clarity and consistency in the linguistic analysis. At T1, responses ranged from 5 to 20 s (M = 11.74, SD = 4.08) for the picture description task and from 5 to 30 s (M = 17.40, SD = 6.31) for the narration task; at T2, they ranged from 3 to 20 s (M = 12.45, SD = 7.74) for picture description and from 5 to 30 s (M = 17.74, SD = 6.68) for narration. Responses from speaking tasks 5 and 6 were combined for all subsequent analyses. To establish intercoder reliability for transcriptions, the second author retranscribed 10% of the total data. Intercoder reliability between the first and second authors’ transcriptions of the same 10% subset of the data was assessed using a two-way consistency, average-measures intraclass correlation coefficient (ICC), which indicated excellent reliability (ICC = .99). Upon completing transcriptions, the speech files were analyzed for the following linguistic features: (a) fluency, (b) pronunciation, (c) vocabulary, (d) grammar, and (e) content quantity.
Fluency measures included (a) speech rate, (b) number of silent pauses, and (c) mean length of silent pauses. Speech rate was calculated as the total number of syllables divided by the total speech length, including pauses (Kang et al., Reference Kang, Ahn, Yaw and Chung2021). Number of silent pauses was computed as the total number of silent pauses longer than 0.30 s, and the mean length of silent pauses was computed as the total length of silent pauses divided by the total number of silent pauses. The fluency features were extracted automatically using a Praat script by de Jong and Wempe (Reference De Jong and Wempe2009).
For pause-related measures, learners who attended the speaking test but produced no analyzable speech were assigned a value of zero. This coding decision was made to distinguish cases of non-production attributable to limited speaking ability from missing data resulting from absence from the speaking test. Accordingly, zero values were treated as valid observations reflecting an inability to produce speech rather than missing responses. Learners who were absent from the assessment were treated as missing data and were not assigned pause values.
Lexical stress errors were identified as the total number of deviations divided by the total number of polysyllabic words and were coded manually and instrumentally using Praat (Boersma & Weenink, Reference Boersma and Weenink2016). Lexical stress deviations were coded by the first author, and to establish the reliability of data coding, 10% of the data was coded by the second author. The intercoder reliability was acceptable, ICC = .87.
The vocabulary measure—lexical resource—was a composite of a set of individual features, including (a) the proportion of K1 words (first 1,000 most frequent word families), (b) the proportion of K2 words (second 1,000 most frequent word families), (c) tokens (the total number of words produced in the speech sample), (d) types (the range of unique words produced in the speech sample), and (e) type-token ratio (the total number of word types divided by the total number of word tokens). Features of the lexical resource were generated using the Vocabprofile function in Lextutor (Cobb, Reference Cobb2024), based on written transcripts (see also Brown et al., Reference Brown, Iwashita and McNamara2005; Gu & Hsieh, Reference Gu and Hsieh2019). The feature of Coxhead’s academic word list (AWL) was excluded, as the speaking tasks did not prompt learners to use academic words.
Grammar measures encompassed (a) syntactic complexity, (b) syntactic accuracy, and (c) dependent clause ratio. To analyze the speech samples for grammar measures, the transcriptions were first coded for (a) the number of C-units (an independent clause with its modifiers), (b) the number of clauses (a statement containing both a subject and a predicate), and (c) the number of verb phrases. Syntactic complexity was measured as a composite of (a) C-unit complexity (the number of C-units divided by the number of clauses) and (b) verb phrase ratio (the number of C-units divided by the number of verb phrases) (Gu & Hsieh, Reference Gu and Hsieh2019; Kang et al., Reference Kang, Ahn, Yaw and Chung2021). Syntactic accuracy was measured globally as the number of error-free C-units divided by the total number of C-units (Gu & Hsieh, Reference Gu and Hsieh2019). The dependent clause ratio was measured as the number of dependent clauses divided by the total number of clauses. Grammar measures were coded manually by the first author, and to establish the reliability of data coding, 10% of the data was coded by the second author. Intercoder reliability was acceptable for syntactic complexity, ICC = .88, and syntactic accuracy, ICC = .86, and excellent for dependent clause ratio, ICC = .96.
To measure content quantity, in line with previous research (Brown et al., Reference Brown, Iwashita and McNamara2005), the number of C-units in the speech samples was used instead of the number of words, as the number and variety of words would not reliably represent the number of ideas presented.
Statistical analysis
All quantitative data were analyzed in R 4.5.0. Variables for which lower scores indicated higher performance, such as lexical stress, number of pauses, mean length of pauses, C-unit complexity, and verb phrase ratio, were directionally transformed so that higher values consistently represented better performance.Footnote 1 Pearson correlations were then computed based on raw scores to assess collinearity among linguistic variables and group highly correlated, conceptually related features into composite speech constructs. Variables intended to represent the same construct showed very strong intercorrelations (vocabulary measures r > .75–.96; syntactic complexity measures r > .80–.99). Composite variables were created by first standardizing the component variables as z-scores and then averaging the standardized values within each domain construct. The formulae used to derive the composite scores are as follows:
-
• Lexical resource = (types [z] + tokens [z] + type/token ratio [z] + K1 proportion [z] + K2 proportion [z]) / 5.
-
• Syntactic complexity = (reverse-coded C-unit complexity [z] + reverse-coded verb phrase ratio [z]) / 2.
Given that grammar accuracy and dependent clause ratio were weakly related to other grammar measures (r < .35, r < .20, respectively), they both served as separate dependent variables. Thus, the final analysis included nine dependent variables grouped into five categories: fluency (speech rate, number of pauses, mean length of pauses), pronunciation (lexical stress), vocabulary (lexical resource), grammar (syntactic complexity, syntactic accuracy, and dependent clause ratio), and content quantity.
The first research question investigated whether young learners’ linguistic changes in speaking differed as a function of learning contexts. Given that the three groups were not equal at T1, a set of nine ANCOVA tests was used, with T1 scores treated as covariates, learning context as an independent variable, and T2 scores on each one of the linguistic features as the dependent variable. Before conducting each ANCOVA, the homogeneity of regression slopes was checked to ensure that the relationship between the dependent variables and the covariate was the same in each category of the independent variable. The Tukey HSD test was used for post hoc analyses for each statistically significant model. To interpret the effect sizes (Cohen’s d values) for post hoc comparisons, we followed Plonsky and Oswald’s (Reference Plonsky and Oswald2014) guidelines with lower thresholds of d = .40 as a small effect, d = .70 as a medium effect, and d = 1.00 as a large effect. Descriptive statistics were reported for all linguistic variables at both T1 and T2, including both individual and composite variables. To answer the second research question regarding the effects of learner backgrounds on linguistic changes in speaking, four sets of standard multiple linear regressions were computed. Descriptive statistics included means and standard deviations for background variables. Regression assumptions were checked following the recommendations by Field, Miles, and Field (Reference Field, Miles and Field2012), and none of the assumptions were violated.
To analyze the interview data, a reflexive thematic coding scheme was developed inductively following Braun and Clarke’s (Reference Braun and Clarke2006) six-phase framework. The process involved (a) familiarizing oneself with interview data through repeated readings, (b) creating initial codes systematically across the dataset, and (c) organizing the codes into broader categories to form preliminary themes. The themes were then reviewed for coherence and alignment with the data, refined and named to capture their distinctiveness, and finally illustrated with representative quotes. Given that the interview questions were straightforward and the answers they elicited lent themselves to suitable categorization, no interrater reliability check was conducted.
Results
This section is divided into two subsections. The first subsection presents quantitative findings for each research question, followed by the second subsection, which reports the qualitative findings organized by research questions.
Quantitative findings
RQ1: How do young FL learners’ linguistic changes in the picture description and narration tasks of the TOEFL Primary speaking test differ across educational contexts (i.e., Bilingual [immersion/high-CLIL], Private [EMI/low-CLIL], and Public school [low-exposure EFL])?
Tables 2 and 3 summarize the unadjusted descriptive statistics for the linguistic features of speaking across the three learning contexts at T1 and T2. Overall, Bilingual and Private school learners scored higher at T1 across most linguistic features, while Public school learners generally exhibited lower initial mean scores and greater variability. Changes in raw mean scores from T1 to T2 varied across learning contexts and linguistic features and did not consistently align with the ANCOVA results reported below, in which T2 scores were adjusted after partialling out differences in T1 performance. Figure 2 illustrates adjusted T2 scores for all linguistic features across the three learning contexts.
Unadjusted descriptive statistics for individual linguistic features of speaking across the three learning contexts

Table 2. Long description
The table displays Mean (M) and Standard Deviation (S D) for five categories of linguistic variables.
* Fluency: Speech rate is highest in the Bilingual group (T 1 M=2.83, T 2 M=2.69) compared to Private (T 1 M=2.24, T 2 M=2.20) and Public (T 1 M=.11, T 2 M=.25). Pauses and Mean length of pauses follow, with Bilingual showing the most negative values (Pauses T 1 M=-10.48).
* Pronunciation: Lexical stress values are near zero across all groups, with the Bilingual group at T 1 M=-.04.
* Vocabulary: Includes K 1 words, K 2 words, Types, Tokens, and Type/token ratio. Bilingual learners produced the highest number of Types (T 1 M =36.86) and Tokens (T 1 M =69.72) compared to Private (Types T1 M =22.37) and Public (Types T1 M =.86).
* Grammar: C-unit complexity and Verb phrase ratio are consistent across groups (around -.90 to -.92). Global accuracy is highest in Bilingual (T 2 M =.75) and lowest in Public (T 1 M =.02). Dependent clause ratio is also highest in Bilingual (T 1 M =.10).
* Content: Content quantity is highest in the Bilingual group (T 1 M =10.69), followed by Private (T 1 M =7.54) and Public (T 1 M =.19).
Unadjusted descriptive statistics for selected composite variables across the three learning contexts

Table 3. Long description
The table is organized into three main columns representing learning contexts: Bilingual, Private, and Public. Each context is subdivided into two time points, T 1 and T 2, with Mean (M) and Standard Deviation (S D) reported for each.
Row 1: Syntactic complexity.
- Bilingual: T 1 (M = -0.64, SD = 0.21), T 2 (M = -0.67, SD = 0.23).
- Private: T 1 (M = -0.65, SD = 0.54), T 2 (M = -0.61, SD = 0.53).
- Public: T 1 (M = 1.24, SD = 0.51), T 2 (M = 1.20, SD = 0.58).
Row 2: Lexical resource.
- Bilingual: T 1 (M = 0.75, SD = 0.20), T 2 (M = 0.71, SD = 0.22).
- Private: T 1 (M = 0.42, SD = 0.48), T 2 (M = 0.42, SD = 0.48).
- Public: T 1 (M = -1.14, SD = 0.36), T 2 (M = -1.05, SD = 0.54).
Summary of results for the linguistic features score changes before and after 6 months across the three educational contexts.

The results of ANCOVA showed that, for speech rate, T1 scores were significantly related to the learners’ T2 scores, F(1, 98) = 4.18, p = .04, and after partialling out the effect of T1 scores, a significant difference was observed in learners’ T2 speech rate performance across the learning contexts, F(2, 98) = 17.71, p < .0001, R2 = .71. Post hoc analyses revealed significant differences with medium-to-large effect sizes between Bilingual and Private (p = .01, d = .68), Bilingual and Public (p < .0001, d = 2.76), and Private and Public school learners (p < .0001, d = 2.08). These findings indicate that, after controlling for T1 performance, Bilingual and Private school learners produced faster speech at T2 than Public school learners, and that Bilingual school learners also outperformed Private school learners.
For number of silent pauses, T1 scores were significantly related to learners’ T2 performance, F(1, 98) = 6.55, p = .01. A significant effect of learning context on learners’ adjusted T2 scores was also observed, F(2, 98) = 23.58, p < .0001, R2 = .60. Post hoc analyses revealed significant differences with large effect sizes between Bilingual and Public (p < .0001, d = 1.82) as well as Private and Public school learners (p < .0001, d = 2.19), whereas no significant difference was observed between Bilingual and Private school learners (p = .29, d = .36). A comparable pattern was observed for mean length of pauses. After controlling for T1 scores, a significant effect of learning context on learners’ adjusted T2 scores was observed, F(2, 98) = 112.55, p < .0001, R2 = .69. Post hoc comparisons revealed significant differences with large effect sizes between Bilingual and Public (p < .0001, d = 3.01) as well as Private and Public school learners (p < .0001, d = 3.40), whereas no significant difference was observed between Bilingual and Private school learners (p = .25, d = .39). These results indicate that, after controlling for T1 scores, the Public school learners obtained lower pause frequency and pause duration scores at T2 than the Bilingual and Private school learners. However, this finding should be interpreted with caution. For pause-related measures, learners who attended the speaking assessment but produced no analyzable speech were assigned pause values of zero. As a result, the lower pause scores observed for the Public school group may partly reflect limited or absent speech production rather than greater fluency. Consequently, lower pause frequencies and shorter pause durations should not be interpreted as evidence of superior fluency, but rather as an outcome that may be influenced by restricted speech production among some learners in this group.
For lexical stress, T1 scores were not associated with learners’ scores at T2, F(1, 98) = .06, p = .79, and no significant effect of context was observed in the learners’ T2 scores after partialling out the effect of T1, F(2, 98) = .73, p = .48, R2 = .01.
For lexical resource, T1 scores significantly predicted learners’ adjusted T2 scores, F(1, 98) = 9.34, p = .002. After controlling for T1 performance, a significant effect of learning context on the learners’ T2 lexical resource scores was observed, F(2, 98) = 11.03, p < .0001, R2 = .79. Post hoc analyses revealed significant differences with large effect sizes between Bilingual and Public (p < .0001, d = 2.64) and Private and Public school learners (p < .0001, d = 2.23), whereas no significant difference was observed between Bilingual and Private school learners (p = .25, d = .41). These results suggest that after adjusting for T1 scores, Bilingual and Private school learners produced a wider range of lexical items at T2 than Public school learners.
For syntactic complexity, T1 scores were not significantly related to T2 performance, F(1, 98) = 1.40, p = .24. A significant effect of learning context on adjusted T2 scores was observed, F(2, 98) = 24.38, p < .0001, R2 = .76. Post hoc analyses revealed significant differences with large effects between Bilingual and Public school (p < .0001, d = -3.33) and Private and Public school (p < .0001, d = -3.21), whereas no significant difference was observed between Bilingual and Private school learners (p = .88, d = -.11). These results suggest that Public school learners exhibited higher syntactic complexity at T2 than both Bilingual and Private school learners. However, these findings should be interpreted with caution since this pattern may reflect shorter utterances yielding higher ratio-based complexity scores rather than qualitatively more advanced syntactic production.
For syntactic accuracy, T1 scores were significant predictors of learners’ adjusted T2 performance, F(1, 98) = 19.37, p < .0001. After partialling out differences at T1, a significant effect of learning context on learners’ syntactic accuracy scores at T2 was observed, F(2, 98) = 13.92, p < .0001, R2 = .65. Post hoc analyses indicated significant differences with medium-to-large effect sizes between Bilingual and Private (p = .02, d = .73), Bilingual and Public (p < .0001, d = 1.92), and Private and Public school learners (p < .0001, d = 1.19). These findings show that after controlling for T1 performance, Bilingual school learners produced more accurate speech at T2 than both Private and Public school learners.
Regarding dependent clause ratio, T1 scores were not significantly related to learners’ adjusted T2 scores, F(1, 98) = 2.39, p = .12. However, a significant main effect of learning context on learners’ T2 performance was observed after controlling for T1 scores, F(2, 98) = 10.01, p < .0001, R2 = .14. Post hoc analysis indicated significant differences with medium-to-large effect sizes between Bilingual and Private (p = .024, d = .63) and Bilingual and Public (p < .0001, d = 1.16), whereas the difference between Private and Public school learners did not reach statistical significance (p = .08, d = .52). These findings suggest that after adjustment, Bilingual school learners produced a higher proportion of dependent clauses at T2 than both Private and Public school learners.
For content quantity, T1 scores were significant predictors of learners’ adjusted T2 performance, F(1, 98) = 49.93, p < .0001. After controlling for T1 scores, a significant effect of learning context on learners’ T2 content quantity was observed, F(2, 98) = 4.97, p = .009, R2 = .79. Post hoc analyses revealed significant differences with large effect sizes between Bilingual and Public school (p = .01, d = 1.38) and Private and Public school learners (p = .006, d = 1.18), whereas no significant difference was observed between Bilingual and Private school learners (p = .75, d = .20). These findings indicate that, after adjustment, both Bilingual and Private school learners produced more content, operationalized as the number of C-units, at T2 than Public school learners.
RQ2: To what extent do learner background variables predict young FL learners’ linguistic changes in speaking in the picture description and narration tasks of the TOEFL Primary speaking test across educational contexts? and why?
Overall, learners reported spending an average of 1–2 hr studying English (M = 2.38/10; SD = 1.11) and 4–6 hr (M = 2.86/10; SD = 1.44) using English each week. The mean of young learners’ self-reported perceptions of English learning experience was 7.57/10 (SD = 1.89), which shows that, overall, the learners had a favorable and engaging educational experience. Finally, the learners reported having completed a mean of 4.48 (SD = 2.90) individual and group assignments per month during the semester. Descriptive statistics for young learners’ self-reported background variables are summarized in Table 4.
Summary of the self-reported background variables across the three learning contexts

Table 4. Long description
The table contains 13 columns and 5 rows. The header row identifies three learning contexts: Bilingual school, Private school, and Public school. Each context is subdivided into four statistical measures: M (Mean), SD (Standard Deviation), Min (Minimum), and Max (Maximum).
* Hours of study: Bilingual school (M = 3.11, SD = 1.15, Min = 1.67, Max = 6.07); Private school (M = 2.10, SD = .60, Min = 1.26, Max = 3.85); Public school (M = 1.98, SD = 1.08, Min = 1.04, Max = 6.74).
* Target language use: Bilingual school (M = 3.68, SD = 1.71, Min = 1.52, Max = 8.67); Private school (M = 2.65, SD = 1.07, Min = 1.21, Max = 5.88); Public school (M = 2.32, SD = 1.12, Min = 1.11, Max = 5.79).
* English learning experience: Bilingual school (M = 7.34, SD = 1.74, Min = 2.00, Max = 10.00); Private school (M = 8.36, SD = 1.72, Min = 2.00, Max = 10.00); Public school (M = 7.13, SD = 2.00, Min = 1.60, Max = 9.60).
* Assessment practices: Bilingual school (M = 5.97, SD = 2.51, Min = 1.00, Max = 12.00); Private school (M = 2.42, SD = 1.33, Min = 1.00, Max = 6.25); Public school (M = 4.88, SD = 3.25, Min = 1.00, Max = 13.00).
Note: Hours of study is a composite of nine items, each rated from 1 (0–1 hr) to 10 (more than 16 hr). Target language use is a composite of 11 items rated on the same scale. English learning experience is a composite of five items rated from 1 (not true at all) to 10 (very true). Assessment practices is a composite of four items in which students reported the number of assignments, quizzes, individual projects, and group projects they completed during the 6 months.
The regression results are all summarized in Table 5. Turning first to fluency features, three multiple regression models were fit to learners’ score gains on speech rate, number of pauses, and mean length of pauses. For speech rate, the model explained 36% of the variance in score gains for the Bilingual school (F(5, 30) = 5.02, p = .002), 25% for the Private school (F(5, 27) = 3.14, p = .02), and 19% for the Public school (F(5, 23) = 2.34, p = .07). For number of pauses, the model accounted for 31% of the variation in score gains for the Bilingual school (F(5, 30) = 4.24, p = .005), 41% for the Private school (F(5, 27) = 5.40, p = .001), and 83% for the Public school (F(5, 23) = 29.00, p < .001). For mean length of pauses, the model explained 99% of the variance in score gains for the Bilingual school (F(5, 30) = 6506.30, p < .001), 99% for the Private school (F(5, 27) = 2347.49, p < .001), and 57% for the Public school (F(5, 23) = 8.54, p < .001). Across all three learning contexts, initial proficiency (performance at T1) emerged as a negative significant predictor of gains in speech rate, number of pauses, and mean length of pauses, indicating that learners with lower initial proficiency exhibited greater improvement over time (delivered faster speech with fewer and shorter pauses) over 6 months. Assessment practices were positively and negatively associated with gains in mean length of pauses of Bilingual and Private school learners, respectively, although this association was only marginally significant for the Bilingual school.
Summary of multiple linear regression results

Table 5. Long description
A table presenting regression results for eight dependent variables: Speech rate, Number of pauses, Mean length of pauses, Syntactic complexity, Dependent clause ratio, Syntactic accuracy, Lexical resource, and Lexical stress.
For each variable, the table lists five predictors: Hours of study, Target language use, English learning perception, Assessment practices, and Proficiency.
Key data points include:
* Speech rate: Proficiency is a significant predictor across all groups (p < .001 for Bilingual and Private, p = .005 for Public). R super 2 values are .36 (Bilingual), .25 (Private), and .19 (Public).
* Number of pauses: Proficiency is highly significant (p < .001) for all groups. R super 2 values are .31 (Bilingual), .41 (Private), and .83 (Public).
* Mean length of pauses: Proficiency shows a beta of -1.00 (p < .001) for Bilingual and Private groups. R super 2 is .99 for both.
* Syntactic complexity: Proficiency is significant across all groups (p < .001 or .001). R super 2 values range from .24 to .53.
* Dependent clause ratio: Proficiency is significant for Bilingual (beta = -.84) and Private (beta = -.78) groups. Data for the Public group is unavailable due to insufficient variability.
* Syntactic accuracy: Proficiency is significant for all groups (p < .001 to .002). Assessment practices are also significant for the Private group (p = .04).
* Lexical resource: Proficiency is significant for all groups (p = .04 to .001).
* Lexical stress: Only the Bilingual group was estimated, with Proficiency being the sole significant predictor (p = .000, R super 2 = .99).
* Content quantity: Target language use (p = .04) and Assessment practices (p = .03) are significant for the Bilingual group. English learning perception (p = .04) and Proficiency (p = .03) are significant for the Private group.
Note: Regression models were not estimated for lexical stress gain in the Private school group (SD = .02), or for lexical stress (SD = .000) and dependent clause ratio gains (SD = .02) in the Public school group, due to insufficient outcome variability for regression analysis. R2 values represent adjusted R2.
In the second set of analyses, three regression models were fit to the learners’ score gains on grammar measures, including syntactic complexity, accuracy, and dependent clause ratio. For syntactic complexity, the background variables accounted for 53% of the variance among Bilingual school learners (F(5, 30) = 8.79, p < .001), 24% among Private school learners (F(5, 27) = 3.02, p = .03), and 47% among Public school learners (F(5, 23) = 4.54, p = .005). For syntactic accuracy, the model explained 54% of the variance for Bilingual (F(5, 30) = 9.34, p < .001), 36% for Private (F(5, 27) = 4.59, p = .004), and 25% for Public school learners (F(5, 23) = 2.84, p = .04). For dependent clause ratio, the model explained 78% of the variance in score gains for Bilingual school learners (F(5, 30) = 26.02, p < .001) and 51% for Private school learners (F(5, 27) = 7.82, p < .001). Across all grammar measures and learning contexts, initial proficiency emerged as a consistent negative predictor of gains, indicating that learners with lower initial proficiency could achieve greater improvement over time. Additionally, assessment practices were positively related to gains in syntactic accuracy among Private school learners.
The next set of analyses examined the impacts of background variables on the vocabulary measure of lexical resource. The background variables explained 7% of the variance in gains for Bilingual school learners (F(5, 30) = 1.58, p = .20), 22% for Private school learners (F(5, 27) = 2.77, p = .04), and 27% for Public school learners (F(5, 24) = 3.20, p = .02). Proficiency was the only significant predictor across all three learning contexts, with negative coefficients suggesting that learners with lower initial proficiency demonstrated greater gains in lexical resource, reflected in the use of a wider range of lexical items.
In the last set of analyses, two regression models were fit to the learners’ gains in lexical stress and content quantity. For lexical stress, the model accounted for 99% of the variance in gains among Bilingual school learners (F(5, 30) = 685.72, p < .001), with initial proficiency emerging as the sole significant negative predictor. For content quantity, the background variables explained 29% of the variation in gains for Bilingual school learners (F(5, 30) = 3.89, p = .008), 20% for Private school learners (F(5, 27) = 2.65, p = .04), and 12% for Public school learners (F(5, 23) = 1.74, p = .16). Assessment practices and target language use were positively associated with gains in content quantity among Bilingual school learners. For Private school learners, gains were negatively associated with initial proficiency and positively associated with perceptions of English learning. In the Public school context, initial proficiency was the only significant predictor, suggesting that lower proficiency learners achieved greater gains.
Qualitative findings
The interview data partially support the quantitative findings by confirming that the three learning contexts offered varying degrees of English exposure, instructional support, and opportunities for meaningful language use. Across teacher and student interviews, Bilingual and Private school participants described more extensive and ongoing contact with English both inside and outside the classroom, while Public school participants generally focused on classroom learning, limited resources, motivation, and teacher-created activities/materials. These contextual differences help explain the ANCOVA results that indicated stronger performance for Bilingual and Private school learners across several linguistic domains, especially lexical resource, syntactic accuracy, speech rate, and content quantity.
In the Bilingual school, teachers consistently reported incorporating English throughout the curriculum and using it regularly during the school day. One teacher postulated that “Everything has to be in English. So I think it has to be getting better,” suggesting ongoing exposure to the target language. Another teacher stated that students had improved because “the materials help them a lot to learn a lot of new words, vocabulary mostly,” while “the immediate correction of some grammar structure has helped them internalize” language forms. One more teacher emphasized reading comprehension, explaining, “I like the reading comprehension… to make them comprehend what they’re reading,” and noted that students had improved in fluency and confidence when reading aloud. Students’ responses complemented this pattern of extensive English use beyond school. One Bilingual school learner mentioned, “I talk English in my house and with my parents… I read in English, I write in English, and I watch movies in English. Everything’s English.” Another student similarly reported, “I mostly do English. I mostly talk in English. I mostly read in English.” One learner described reading for pleasure and vocabulary development: “I read books in English… many words that I don’t understand, I look them in the dictionary and… I learn many new words.” Others linked their progress to speaking practice, with one student noting, “Talking makes me feel comfortable… I feel that I am succeeding each time more.” Another said that listening helped because “just hearing people talk and listening to new words helps me understand.”
In the Private school context, teachers highlighted explicit instruction in pronunciation, grammar, vocabulary, and speaking. One teacher explained, “I usually emphasize more on pronunciation, vocabulary, grammar… because what we want is for them to produce the language, to speak.” Another teacher stated that she aimed to develop “the whole skills… reading, grammar, listening” so that students could improve overall comprehension. At the same time, Private school teachers acknowledged limitations in instructional time. One teacher hinted, “They have an hour a day or one hour and a half and sometimes that’s not enough. Maybe if they had more hours a day they would be able to practice more.” Students in the Private school context frequently described self-directed English learning through media, technology, and extracurricular activities. One student reported that she had learned “mostly by looking on the internet,” while another stated that she surrounds herself with English through “watching movies in English, listening to music in English… socials… I make sure it’s always English.” She also added, “The more you’re around English… the more you learn.” Another learner reported attending additional English classes outside school: “I go in the afternoon classes… four days a week.” Some students also described reading and writing in English at home, with one learner stating, “I like to write… which also helps a lot.”
In the Public school setting, interviews portrayed a learning environment highly dependent on classroom instruction and teacher initiatives. One student explicitly linked school access to opportunity, explaining, “Since I don’t have so many resources… it’s very good that they teach us English for free.” This comment suggests that access to English learning opportunities outside school may have been more limited for some learners. The Public school teacher repeatedly underscored motivation as integral to success, explaining that “motivation… is very crucial or important” because some students face challenges before arriving at school. She also described the importance of documenting progress, stating that “their notebook is their portfolio of evidence… the evidence of what you have learned during day by day the whole year.” In addition, she noted adapting materials to learners’ needs: “I don’t really like the books… most of the times I just make changes because I think they are very difficult for them.” She also highlighted technology use, explaining, “We have used a lot of technology here in our classroom so we have improved a lot.” Taken as a whole, these comments help explain why Public school learners generally scored lower on speech rate, lexical resource, syntactic accuracy, and content quantity. More limited access to English beyond school and heavier reliance on classroom instruction may have reduced opportunities for vocabulary growth and extended oral production.
The interview data also help interpret the regression findings, in which proficiency emerged as the most consistent predictor across contexts and outcomes. Both teachers and students repeatedly linked progress to frequent use, accumulated exposure, and confidence. Learners who reported speaking English at home, exposure to English media, reading independently, or attending extra classes often described stronger progress. By contrast, estimates of “hours of study” were highly variable (e.g., “one hour,” “all day,” “two hours,” or counting screen time), suggesting that quantity of study alone may be less informative than the quality and regularity of English engagement.
Overall, the qualitative findings converge with the ANCOVA and regression results, demonstrating that learning context influenced learners’ opportunities to use English, the types of instruction they received, and their access to complementary educational resources. Bilingual school learners benefited from immersion-like exposure across subjects and home use. Private school learners benefited from explicit instruction combined with extracurricular English contact. Public school learners, on the other hand, benefited from committed teachers and classroom motivation efforts but appeared to face more limited external resources and fewer opportunities for sustained English use. These contextual differences are consistent with the quantitative findings in which Bilingual and Private school learners generally outperformed Public school learners on multiple linguistic domains.
Discussion
This longitudinal study explored young FL learners’ progression in various linguistic features of speaking (i.e., fluency, pronunciation, vocabulary, grammar, and content quantity) and how their progress was related to the learners’ educational context and background variables. The following discussion summarizes and interprets the results.
To address the first research question, a series of ANCOVA models was computed, with educational context treated as an independent variable, adjusted T2 scores on the linguistic features as a dependent variable, and scores at T1 as a covariate. The findings indicated that, for most linguistic features, including speech rate, lexical resource, dependent clause ratio, syntactic accuracy, and content quantity, Bilingual and Private school learners outperformed Public school learners. Bilingual school learners also surpassed Private school learners in speech rate and content quantity at T2. These findings coincide with those of previous research (e.g., Azpilicueta-Martínez, Reference Azpilicueta-Martínez2024, Reference Azpilicueta-Martínez2025; Lee et al., Reference Lee, Lee and Lo2023; Pérez Cañado & Lancaster, Reference Pérez Cañado and Lancaster2017) demonstrating the advantage of EMI-CLIL programs, which typically involve greater instructional intensity and increased exposure to the target language, for the development of linguistic features of speaking in young learners. These findings also provide validity evidence for the TOEFL Primary speaking test, which is built on the assumption that speaking test performance varies according to learners’ language learning experience and exposure (see, e.g., Hsieh, Reference Hsieh2024). In a similar vein, Hsieh and Wang (Reference Hsieh and Wang2019) and Gu and Hsieh (Reference Gu and Hsieh2019) demonstrated that proficiency level significantly differentiated young learners’ performance across multiple linguistic features of speaking, including fluency, lexical resource, grammatical complexity, and grammatical accuracy. Likewise, findings of the current investigation suggest that educational contexts associated with greater English exposure and opportunities for meaningful language use are likely to contribute to differences across the spoken linguistic dimensions. In the context of this study, Bilingual school learners received 30 hr of in-class exposure to English per week, which was 22.5 hr more than Private school learners and 27.5 hr more than Public school learners. In addition, Bilingual school learners were engaged in various school-organized extracurricular activities, such as programs to experiment with creating projects in the makerspace, yoga, and other extracurricular activities. On the other hand, Public school learners generally focused on classroom learning and had limited access to English-mediated resources and opportunities for interaction. Supporting these quantitative findings, one Bilingual school teacher noted during the interview session that “Everything has to be in English.” Similarly, a Bilingual school student mentioned that “I talk English in my house and with my parents… I read in English, I write in English, and I watch movies in English. Everything’s English.” Private school students also reported frequent engagement with English outside of school through digital media and online resources. For example, one student indicated that they had learned “mostly by looking on the internet,” whereas another explained that they surrounded themselves with English through “watching movies in English, listening to music in English… socials…” and emphasized that “the more you’re around English… the more you learn.” Consistent with the interview findings, the analysis of the self-reported target language use questionnaire further revealed that the Bilingual school learners had significantly more out-of-school exposure than the Private (p = .005, d = .77) and Public school learners (p < .01, d = .98).
As for the pronunciation feature of lexical stress, the findings revealed no significant difference in learners’ adjusted T2 scores across the three learning contexts. This finding may be explained by the fact that young learners acquire lexical stress patterns through repeated exposure to familiar lexical items rather than through internalizing abstract phonological rules (e.g., Redford & Oh, Reference Redford and Oh2016). As a result, stress patterns in familiar words become consolidated in long-term memory, resulting in relatively stable performance across different contexts. Given the high frequency and familiarity of the words featured in the assessment tasks, performance on this prosodic feature was expected to remain relatively stable over time, with minimal variation across the three learning contexts. This finding also partially aligns with those of Pérez Cañado and Lancaster (Reference Pérez Cañado and Lancaster2017) and Rallo Fabra and Jacob (Reference Rallo Fabra, Jacob, Juan-Garau and Noguera2015), which indicated that pronunciation tends to be less sensitive to instructional context differences (CLIL vs. non-CLIL). However, it should be noted that these studies did not specifically investigate lexical stress. Thus, the present finding remains largely exploratory and should be explored in future research. Finally, contrary to our expectations and previous research findings (Azpilicueta-Martínez, Reference Azpilicueta-Martínez2024; Pérez Cañado & Lancaster, Reference Pérez Cañado and Lancaster2017), the Public school learners outperformed the Bilingual and Private school learners on pause-related and syntactic complexity measures. These findings, however, should be interpreted with caution, as only a small number of Public school learners produced analyzable speech at T2, and their comparatively shorter utterances may have potentially inflated ratio-based complexity indices and affected pause-related estimates. Therefore, these findings are likely to reflect statistical properties associated with shorter production rather than qualitatively more advanced performance. Future research with larger and more balanced samples is needed to determine if these findings are replicable.
The results of multiple regression analyses revealed that initial proficiency, operationalized as young learners’ scores at T1, consistently and significantly predicted growth across all linguistic features and learning contexts over time. This finding implies that young learners’ initial proficiency level at the beginning of the course is likely to influence the extent to which they progress over 6 months. This finding comports with previous research by De Wilde et al. (Reference De Wilde, Brysbaert and Eyckmans2021), Jackel et al. (Reference Jackel, Schurig, Florian and Ritter2017), and Unsworth et al. (Reference Unsworth, Persson, Prins and De Bot2014), who reported proficiency as one of the most potent predictors of L2 learners’ gains in different linguistic features of speaking. Since score gains are more likely to occur at lower proficiency levels, it may be pedagogically important to assess young learners’ proficiency at the beginning of the semester so that each learner can be guided and informed about their progress throughout the semester. Furthermore, low-proficiency learners should be encouraged to benefit from contextualized learning, especially in a context where English is readily available and young learners are motivated to learn the language (De Wilde et al., Reference De Wilde, Brysbaert and Eyckmans2021).
In addition to initial proficiency, assessment practices and target language use emerged as positive significant predictors of young learners’ improvement over time. Specifically, assessment practices were associated with improvement in mean length of pauses and syntactic accuracy among Private school learners, as well as content quantity production among Bilingual school learners. Target language use was also positively related to Bilingual school learners’ content quantity production. As for assessment practices, the findings underscore the significance of frequency, mode, and types of assessment practices employed by language teachers in shaping learners’ L2 development (Latif & Wasim, Reference Latif and Wasim2024; Yu & Xu, Reference Yu and Xu2021), particularly among young L2 learners aged 10–12. However, given that previous research has rarely investigated the effects of assessment practices on the development of young learners’ linguistic dimensions of speaking, the findings of this study should be interpreted as exploratory and warrant further exploration.
Likewise, the positive relationship between target language use and Bilingual school learners’ content quantity production is unsurprising, given that the Bilingual school represented a high-CLIL/immersion context that involved ample opportunities for target language use and meaningful interaction using the L2. Frequent exposure to and active use of the L2 over time may have reinforced young learners’ ability to retrieve linguistic resources more efficiently to elaborate their ideas and produce longer spoken responses. That the remaining variables did not emerge as significant was somewhat unexpected and warrants further research. One potential reason would be that this study collected background information through young learners’ self-reports, which, while appropriate for this context, may have reflected young learners’ subjective interpretation rather than objective measures. This is an avenue for future research to adopt more objective measures for assessing young learners’ backgrounds.
Conclusion and implications
This longitudinal study investigated the extent to which young learners’ linguistic features of speaking improved over 6 months and how the learners’ progress was related to their educational context and background factors. Several limitations should be acknowledged. First, the study narrowed the study population to young learners aged 10–12 in one EFL context, which may limit the generalizability of the findings. Second, it collected learners’ background information solely through self-report questionnaires and may therefore be subject to reporting bias. Third, it investigated score gains within a rather short timeframe. Fourth, it used only two time points and relatively small samples within each school context. Fifth, it combined the linguistic features across the picture description and narration tasks that may have masked potential task-specific effects on learners’ spoken responses. Sixth, the study did not explore other factors such as motivation, aptitude, and learning style that may potentially influence score gains over time. Seventh, the same TOEFL Primary speaking test was administered at T1 and T2. Thus, score gains might have been partly influenced by test familiarity or practice effects. Finally, school context was associated not only with different instructional models and the amount of exposure to the English language they provided, but also with the socioeconomic level of students they served. Although information on the socioeconomic profile of schools suggests that, generally, students from the Private and Bilingual schools came from advantaged backgrounds, information on individual students’ socioeconomic backgrounds was not available. Therefore, it is hard to disentangle how much of the observed differences could be attributed to instructional factors, students’ socioeconomic background, school resources, or an interaction of all. Thus, the findings should be interpreted with caution. Despite existing limitations, there are important implications that can be drawn from the study findings. First, the findings revealed that young learners may benefit from educational contexts that provide ample opportunities for communication and meaningful language use. Thus, educational programs are recommended to provide opportunities for young learners to immerse themselves in the L2 through increased exposure, sustained meaningful interaction, and engagement in English-mediated activities, even in lower exposure EFL settings. Second, given that assessment practices were related to young learners’ development in different linguistic dimensions of speaking, language teachers may consider incorporating frequent and varied assessment opportunities that promote spoken language use and ongoing feedback (see Gass et al., Reference Gass, Behney and Plonsky2020). Third, given the variation in the development of the linguistic features of speaking across the three learning contexts, language teachers and curriculum designers may consider adopting a multidimensional approach to speaking instruction and assessment that acknowledges that linguistic features of speaking may not develop uniformly across various instructional settings. Fourth, since young learners’ proficiency predicts their developmental patterns in various linguistic features of speaking, language programs and institutions are recommended to administer placement/diagnostic tests to evaluate learners’ proficiency levels and then offer level-specific objectives and learning outcomes. In fact, given that lower proficiency learners may demonstrate different developmental trajectories over time, language teachers are encouraged to provide different learning opportunities for this cohort to help them grow motivation and positive attitudes toward L2 study in general. Overall, the study findings add to the existing body of literature on young learners’ L2 speaking development by adopting a longitudinal and multidimensional approach across three different learning contexts. This study also provides validity evidence for the TOEFL Primary speaking test by indicating that assessment is sensitive to and is likely to be influenced by learners’ instructional experiences and exposure to English.
Supplementary material
The supplementary material for this article can be found at http://doi.org/10.1017/S0272263126102046.
Funding statement
This study was sponsored by Educational Service’s Young Student Series Program.
Competing interests
There are no competing interests.
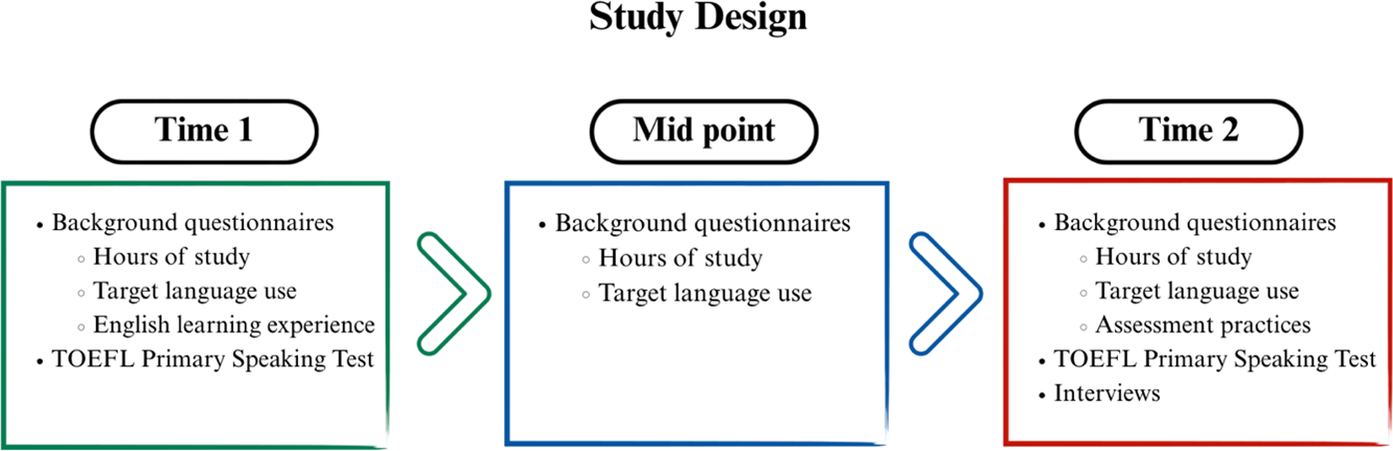

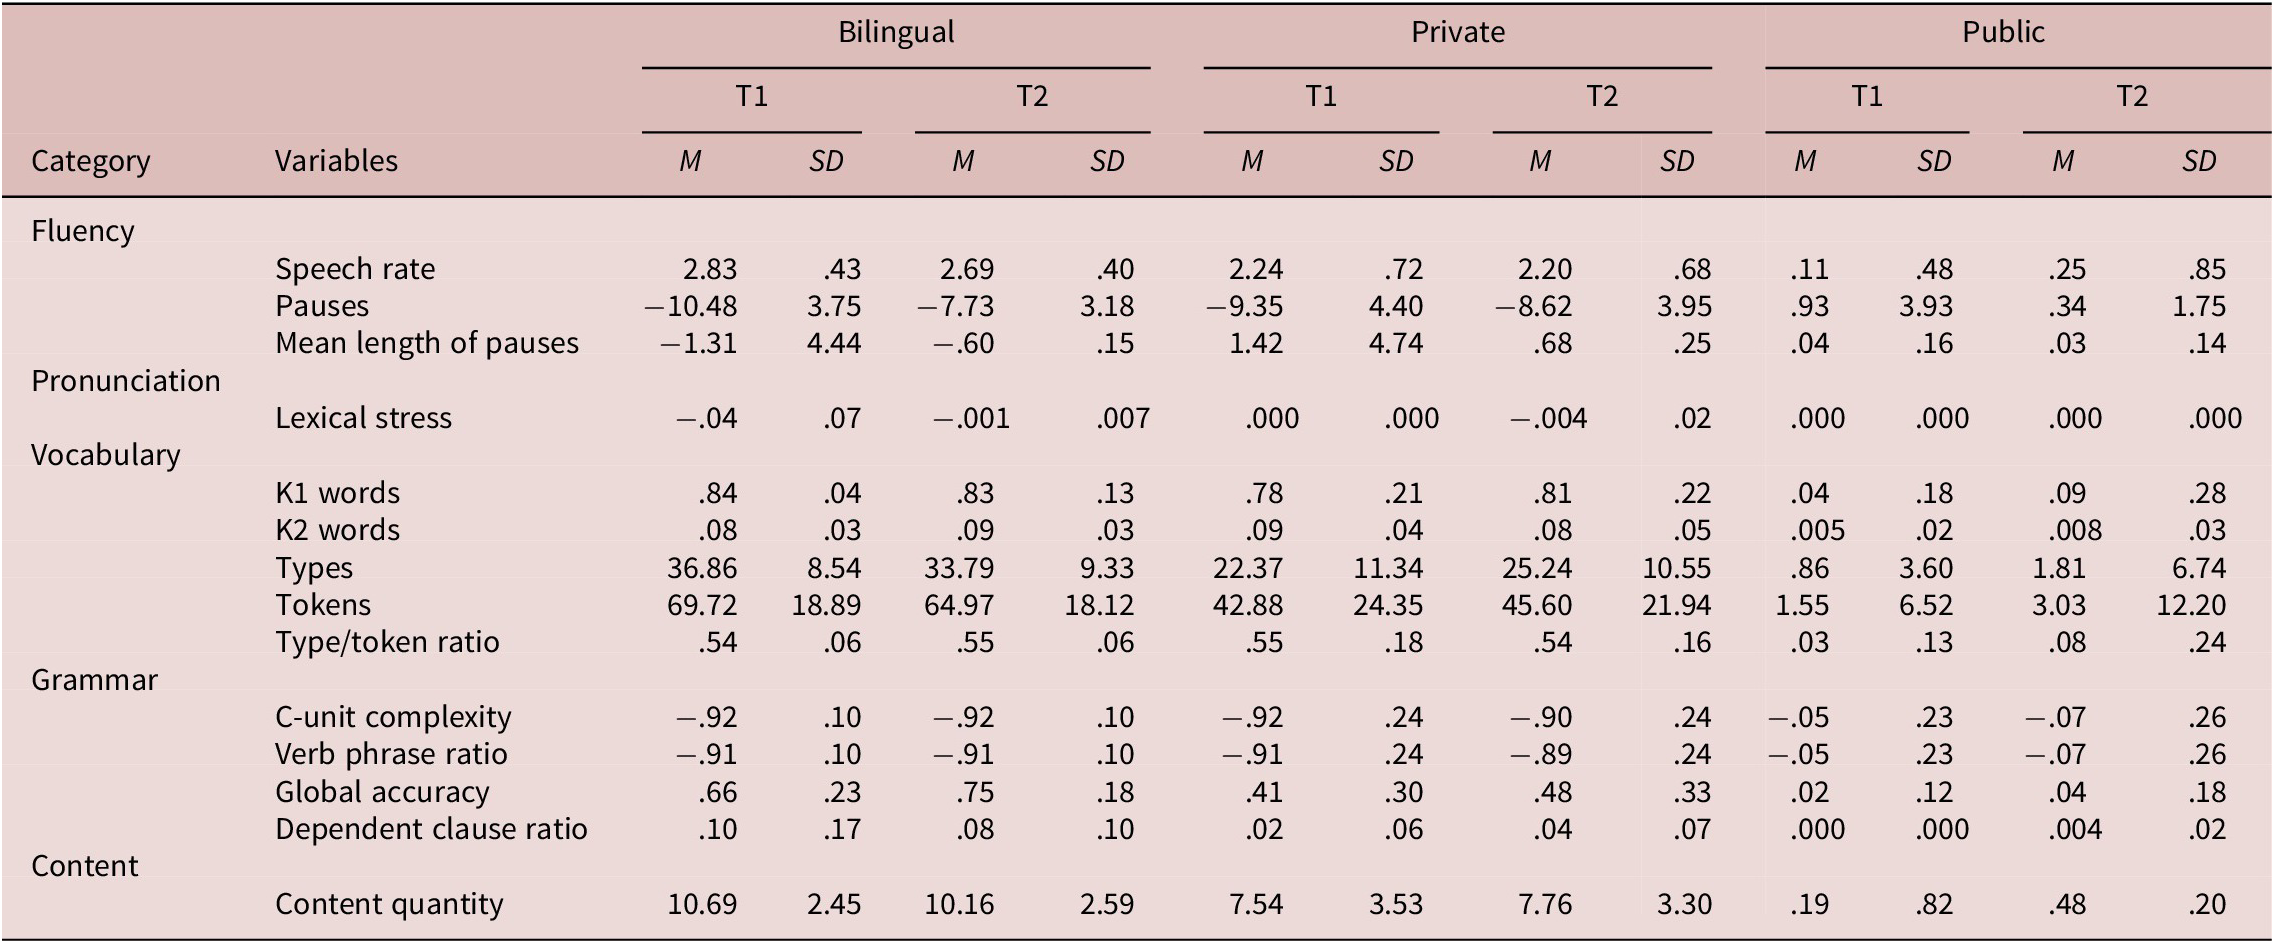
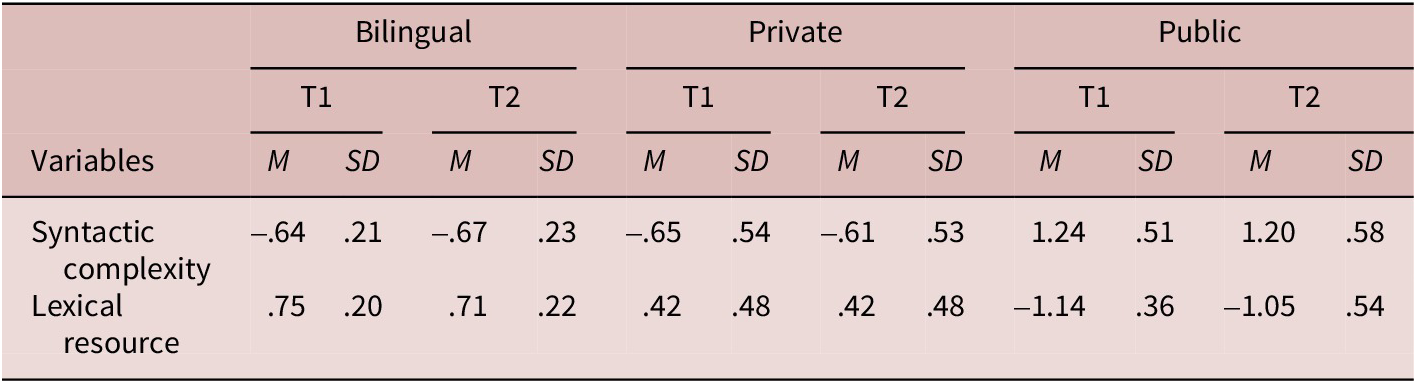
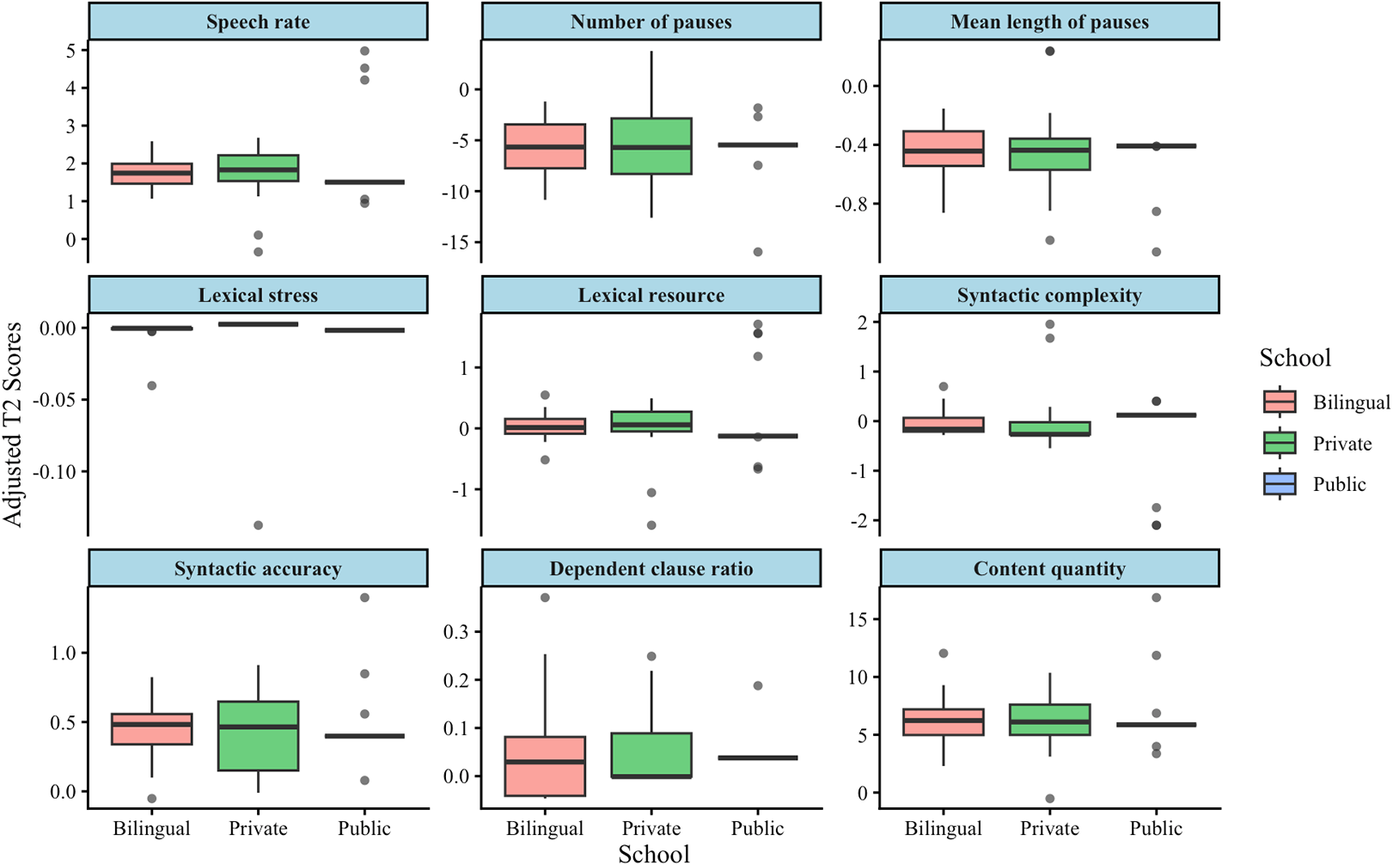
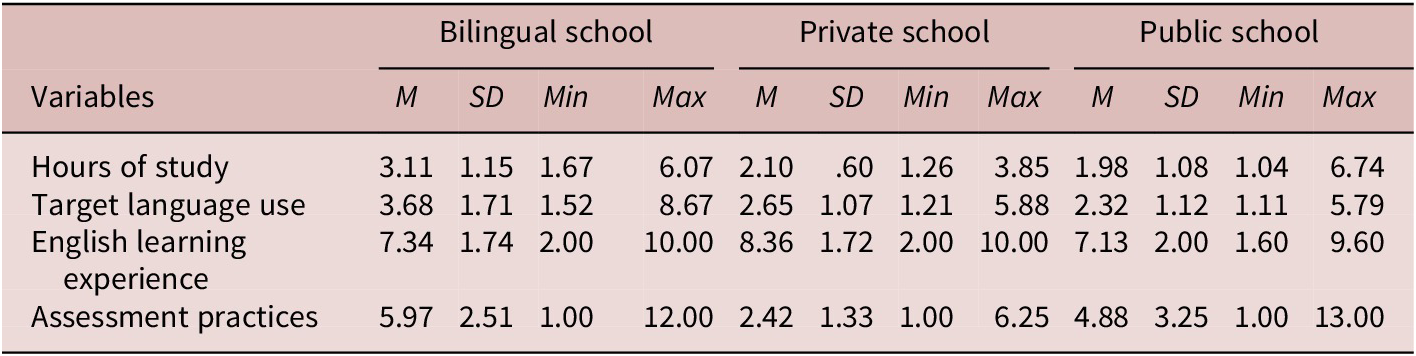
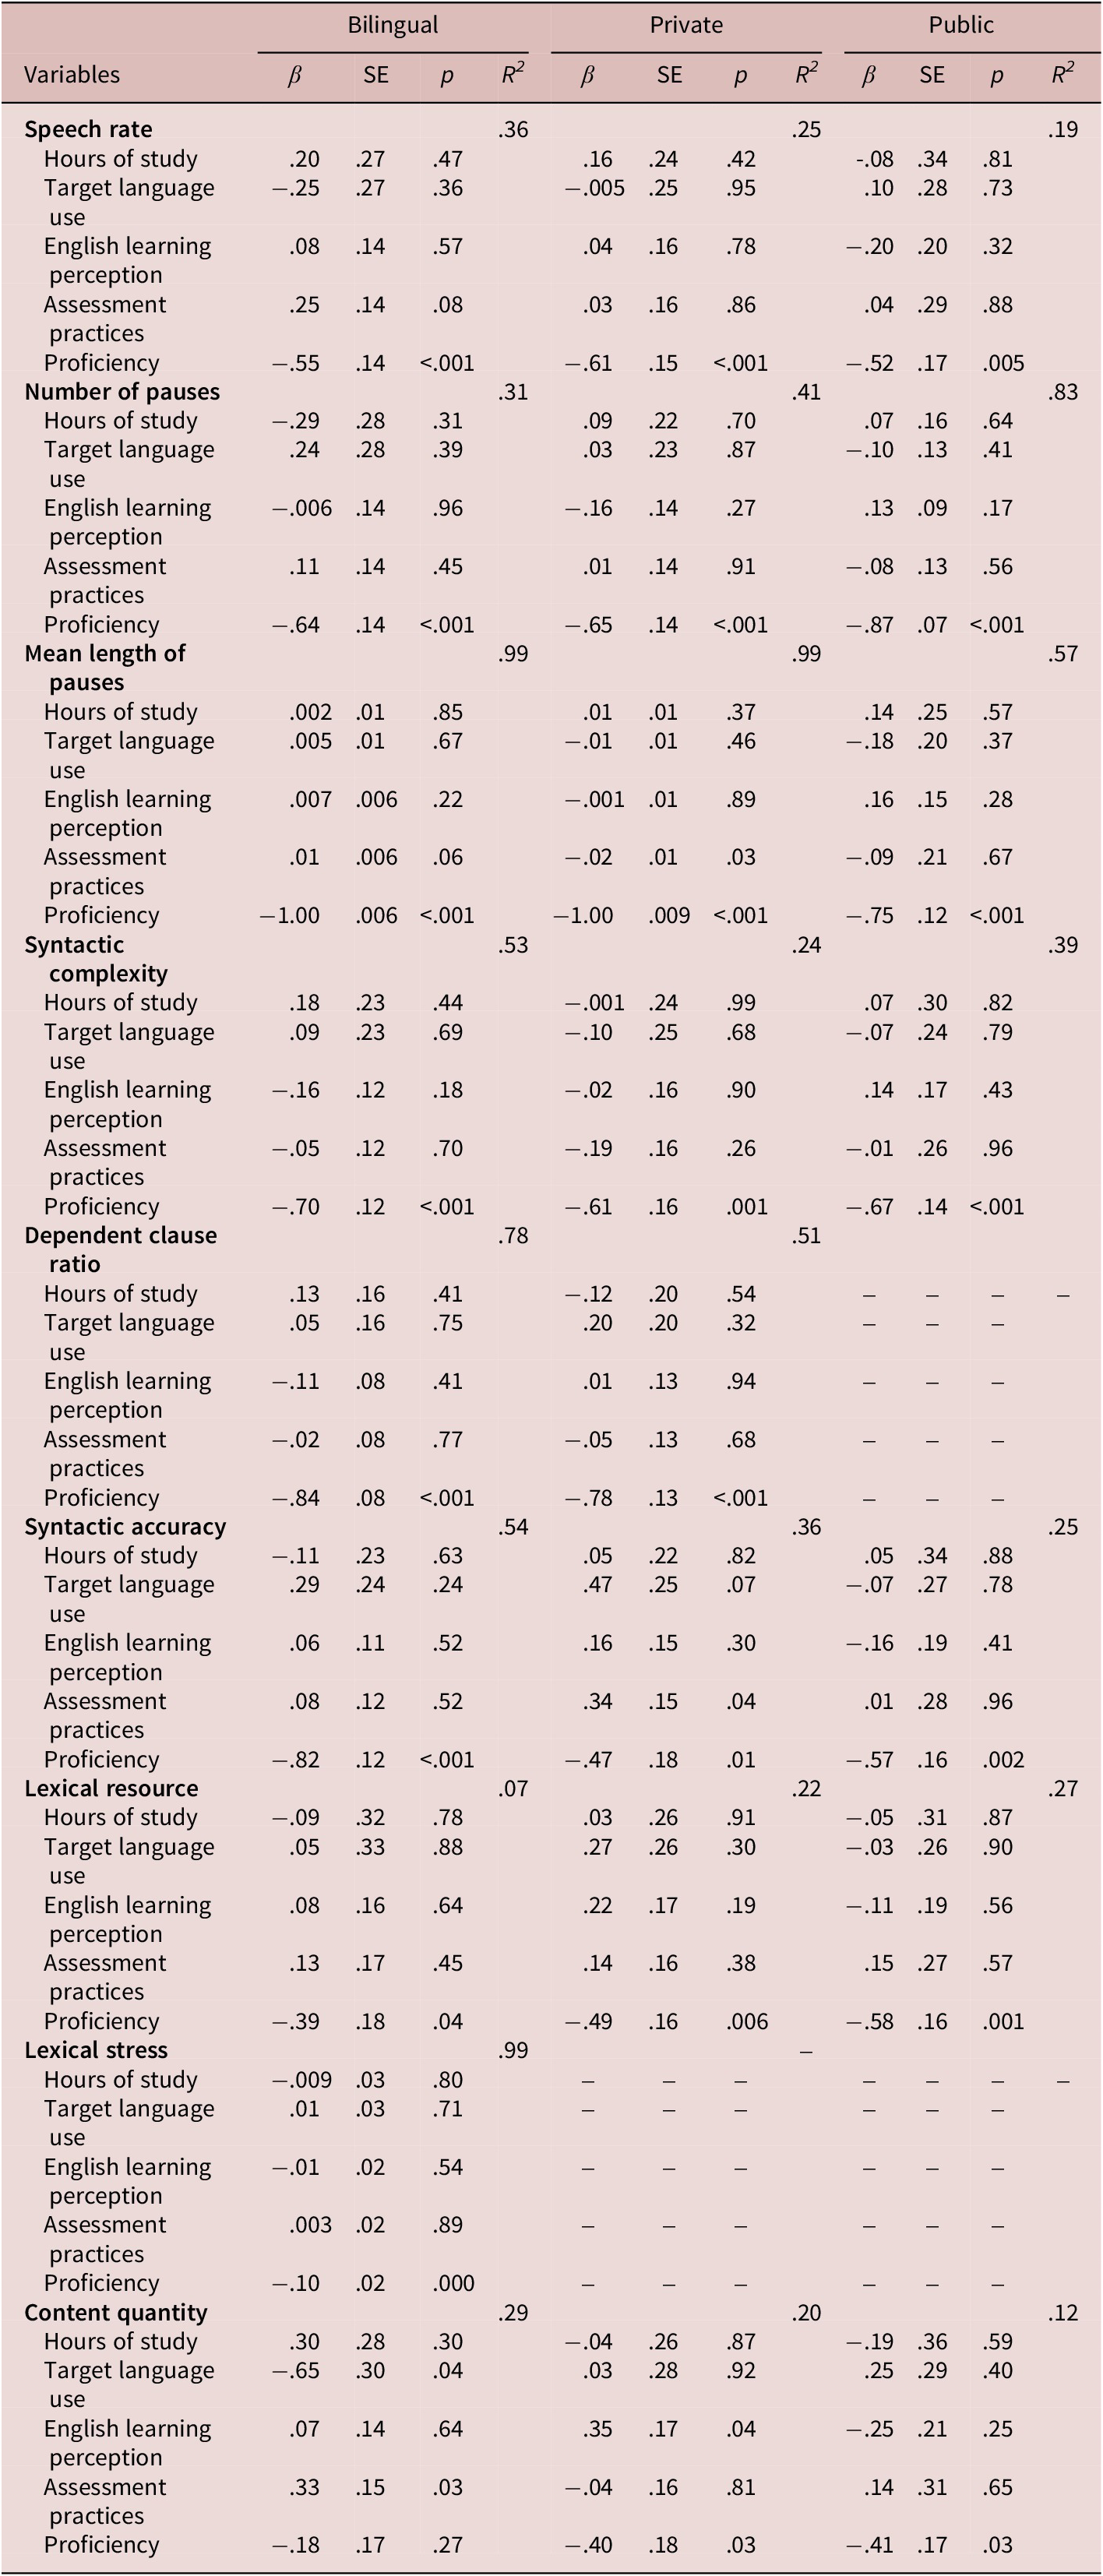


 Open access

