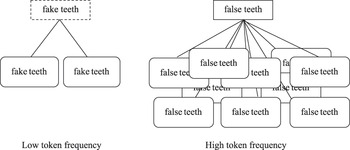
In first language (L1) research, it has been adequately demonstrated that language users are sensitive to frequency effects in language (e.g., Hare, Ford, & Marslen-Wilson, Reference Hare, Ford, Marslen-Wilson, Bybee and Hopper2001; Mitchell, Cuetos, Corley, & Brysbaert, Reference Mitchell, Cuetos, Corley and Brysbaert1995). For example, at a single-word level, the more frequent a word is in language, the quicker it is visually recognized as a word by speakers of that language in lexical decision tasks (e.g., Monsell, Reference Monsell, Besner and Humphreys1991). Recently, there has been a growing interest in investigating whether or not language users are sensitive to frequency effects across different levels of granularity: from morphemes, syllables, and words to phrasal and clausal structures (see, e.g., Alvarez, Carreiras, & Taft, Reference Alvarez, Carreiras and Taft2001; Arnon & Snider, Reference Arnon and Snider2010; Bannard & Matthews, Reference Bannard and Matthews2008; Reichle & Perfetti, Reference Reichle and Perfetti2003). The importance of frequency for language acquisition has been given primacy in a group of related models of language acquisition, all of which place frequency at center stage. In these usage-based models (e.g., Bybee, Reference Bybee2007; Bybee & Hopper, Reference Bybee, Hopper, Bybee and Hopper2001; Goldberg, Reference Goldberg2006; Langacker, Reference Langacker1987, Reference Langacker and Rudzka-Ostyn1988; MacWhinney, Reference MacWhinney, Barlow and Kemmer2000; and Tomasello, Reference Tomasello2000, Reference Tomasello2003), language learning is viewed as a predominantly inductive and experience-driven process, and the frequency with which structures occur in use plays a pivotal role in the emergence of the language system. On the basis of repeated use in a speech community, symbolic structures of different sizes, which are associations of semantic and phonological or orthographic structure—essentially form-meaning mappings with a clear resemblance to the Saussurean sign—eventually become automatically retrievable by speakers of that language. A term commonly used for the process through which a structure becomes automated into a unit is entrenchment (Langacker, Reference Langacker1987; see also automaticity as described in Segalowitz, Reference Segalowitz, Doughty and Long2003). Entrenchment has to do with the extent to which activation of a certain language structure (through either one’s input or one’s output) has become a highly automated routine (Schmid, Reference Schmid, Geeraerts and Cuyckens2007), meaning that no specific attention is needed when producing or understanding the structure. One of the main determinants of the degree of entrenchment of a unit is the token frequency of that structure in language use. Conversely, extended periods of disuse are expected to have negative effects on a structure’s degree of entrenchment. The difference between low and high token frequency and their effect on entrenchment is exemplified in Figure 1 (modeled after Croft & Cruse, Reference Croft and Cruse2004, p. 309).
Network patterns for low and high token frequency of usage events.
Note. Boxes with rounded corners represent usage events. A square, dashed box indicates a low degree of entrenchment for the superordinate category, whereas a box with an unbroken line indicates a higher degree of entrenchment. The low token frequency use of fake teeth results in a lack of, or low, entrenchment level, whereas the comparatively higher token frequency of false teeth results in a higher degree of entrenchment.

The majority of empirical and theoretical work on usage-based models has been done with respect to L1 acquisition; considerably less attention has been given to whether or not usage-based models can be effectively applied to second language (L2) acquisition. Nonetheless, there are some theoretical positions that suggest that L2 learners may not process frequently occurring structures as skillfully as native speakers (NSs), which would call into question the notion that usage-based models can be applied to L2 learning in a straightforward manner. The consensus in the research literature would seem to be that, although it is likely that frequency does play a role in L2 acquisition, there is a host of other factors that, in the words of Ellis (Reference Ellis2006a), “filter and color the perception of the second language” (p. 110; see also Gass & Mackey, Reference Gass and Mackey2002). As a result, many researchers have suggested that frequency might not be as central for L2 acquisition or that it might not be processed in the same way for learners as it is for NSs. In her work on formulaic language, Wray (Reference Wray2002) suggests that L2 learners are (perhaps necessarily) more analytical than L1 learners and, as a result of this, are less able to attend to frequency data in the L2, particularly across larger formulaic sequences. Similarly, Ellis (Reference Ellis2006b) suggests that
the fragile features of L2 acquisition are those which, however available as a result of frequency, recency, or context, fall short of intake because of one of the factors of contingency, cue competition, salience, interference, overshadowing, blocking, or perceptual learning, which are all shaped by the L1. (p. 164; see also Ellis, Reference Ellis2002a, Reference Ellis2002b)
Anecdotally speaking, it is not hard to see that L2 acquisition typically follows a different trajectory than L1 acquisition and that nativelike competence in a L2 is much more the exception than the norm. As such, there does seem to be reason to believe that L2 learners may not be able to process language input as effectively as L1 learners. Nonetheless, there is emerging empirical evidence that is indicative of the fact that learners (perhaps particularly higher proficiency learners) may still be sensitive to frequency effects in L2 input even if their ultimate state of linguistic knowledge typically bears some fundamental differences from that of most NSs. Furthermore, the evidence indicates that this tendency may extend beyond the single-word level to include larger grain sizes as well. For example, Siyanova-Chanturia, Conklin, and van Heuven (Reference Siyanova-Chanturia, Conklin and van Heuven2011) used an eye-tracking technique and determined that both NSs and highly proficient nonnative speakers (NNSs) processed binomials (e.g., bride and groom) significantly faster than their lower frequency reversed formulations (e.g., groom and bride). The fact that these binomials consisted of the same words allowed them to conclude that it was the frequency of the entire phrase that was central to the faster processing of the binomials over the reversed forms. At the same time, however, their results indicated that this ability to process the binomials faster than the reversed forms was closely tied to proficiency, with “more proficient nonnative speakers and native speakers reading binomials significantly faster than the reversed forms, and less proficient nonnative speakers exhibiting comparable reading speeds for both phrase types” (p. 780).
Another study that has shown that higher proficiency learners are sensitive to frequency effects at larger grain sizes is Durrant and Schmitt (Reference Durrant and Schmitt2010). In this study, the authors investigated how frequency of input affected adult L2 learners’ retention of novel collocational patterns. The authors found that the learners remembered nouns that had co-occurred with paired adjectives during a training session better than nouns that had not. On the basis of these results, Durrant and Schmitt concluded that “any deficit in learners’ knowledge of collocation is . . . likely to be the result of insufficient exposure to the language” (p. 182) rather than a language-learning process that is fundamentally distinct from that of NSs (see Wray, Reference Wray2002).
In sum, these studies seem to suggest that proficient L2 learners may indeed be sensitive to frequency effects in the L2 at different levels of granularity. However, as noted earlier, frequency is almost certainly not the only factor that influences processing speed in a L2. A general observation that seems to meet with very little opposition is that the L1 also has a tremendous impact on how we process input in the L2. In some cases, the L1’s impact is likely to be inhibitive, but where there is considerable overlap between the L1 and the L2, it can also play an important facilitative role. Numerous psycholinguistic investigations have demonstrated this in studies that show that learners process L2 cognates more rapidly than noncognate words that are matched for other aspects such as frequency and length (e.g., Cristoffanini, Kirsner, & Milech, Reference Cristoffanini, Kirsner and Milech1986; Dijkstra & van Heuven, Reference Dijkstra, van Heuven, Grainger and Jacobs1998; Kroll, Michael, Tokowicz, & Dufour, Reference Kroll, Michael, Tokowicz and Dufour2002). Furthermore, recent research has suggested that the processing advantage afforded by the L1 at a single-word level may also be extended to larger grain sizes (e.g., frequency effects). Yamashita and Jiang (Reference Yamashita and Jiang2010), for example, used an acceptability judgment task to present NSs, higher proficiency NNSs, and lower proficiency NNSs (both NNS groups were L1 Japanese) with two types of collocations: (a) congruent—that is, collocations with a word-for-word translation equivalent in the L1 (e.g., high salary)—and (b) incongruent—that is, collocations with no direct L1 translation (e.g., weak tea). They found that the NSs processed the collocations in the two conditions in much the same way, both in terms of response times (RTs) and error rates (ERs), whereas the higher proficiency NNSs showed a significant difference only with respect to ERs. The lower proficiency NNSs showed a significant difference both in terms of RTs and ERs. From these results, the authors concluded that (a) incongruent collocations are more difficult to acquire than congruent collocations and (b) incongruent collocations may be initially mediated through the L1, but, with increased exposure to the L2, “direct links between L2 collocations with concepts are formulated and L2 collocations come to be processed independently of the L1 lexicon” (p. 661). This second conclusion was based on the fact that the higher proficiency group demonstrated no significant difference in RTs for the incongruent items but did demonstrate a significant difference in ERs.
Wolter and Gyllstad (Reference Wolter and Gyllstad2011) also investigated the effects of congruency and incongruency on collocational processing. To do so, they used a primed lexical decision task to investigate whether or not the presentation of a verb prime was more likely to facilitate faster recognition of a (object) noun target if the resulting verb + (object) noun collocation was congruent versus incongruent. The study also used unrelated items for baseline data. Participants included NSs of English as well as advanced NNSs of English (i.e., L1 Swedish). The results showed almost identical, significant priming for the NSs for both the congruent (e.g., join club) and incongruent (e.g., throw party) items as compared to the unrelated baseline items, whereas the NNSs responded significantly faster to the congruent items over the incongruent items and the incongruent items over the unrelated baseline items. However, F2 analyses, which used items as random variables rather than participants, indicated that the results might not be generalizable to all the items in the three conditions. On the basis of these results, the authors reached a similar conclusion to that arrived at by Yamashita and Jiang (Reference Yamashita and Jiang2010): Incongruent collocations are harder to acquire than congruent collocations, but, once acquired, they can be processed as efficiently as congruent collocations. Nonetheless, the overall conclusion that can be drawn from these studies collectively is that there seems to be a processing advantage afforded to learners for congruent collocations over incongruent collocations, which again suggests that congruency benefits may extend beyond the single-word level and may also apply to larger grain sizes such as collocations.
To summarize the findings discussed in this section, learners do appear to be sensitive to frequency of input in their L2. However, frequency of input is not the only thing that affects processing efficiency in a L2. It would also seem that learners gain a distinct processing advantage when there is overlap between patterns in the L1 and the L2, as compared to when patterns have no equivalent form in the L2. Unfortunately, to the best of our knowledge, no one to date has attempted to investigate the possible interaction between these factors, particularly at the collocational level. As a result, there are a number of questions that remain unanswered regarding the interaction between frequency effects and congruency versus incongruency. These include whether or not learners are sensitive to frequency effects (regardless of whether the patterns are congruent or incongruent with their L1), and whether or not we can account for accelerated processing for congruent items by taking into account the relative frequency of the L1 items under investigation. Therefore, the goal of this study was to attempt to shed some light on these issues. In particular, we explored how high-proficiency learners of L2 English would process collocations under three conditions—namely, congruent, incongruent, and noncollocational—but with items with a matched range of English frequencies for the congruent and incongruent conditions. Furthermore, we also took into account the frequencies of the L1 translated forms for the congruent items in an effort to determine if this could account for the previously observed processing advantage for congruent collocations.
METHOD
Item Development
Any investigation into collocations must inevitably deal with the thorny issue of how to operationalize the term. There is no widely agreed upon definition for what constitutes a collocation (see Barfield & Gyllstad, Reference Barfield, Gyllstad, Barfield and Gyllstad2009; Gyllstad, Reference Gyllstad2007; Nesselhauf, Reference Nesselhauf, Allerton, Nesselhauf and Skandera2004, for a discussion of this issue), but there are two main traditions that encompass approaches that are different in some fundamental ways. The first approach is often referred to as the phraseological approach and is closely associated with the work of researchers such as Cowie (Reference Cowie and Asher1994) and Howarth (Reference Howarth1998). In the phraseological tradition, one of the key factors of collocations that make them of interest is that they usually involve an element of choice and are not simply free combinations of semantically transparent words that follow selectional restrictions (e.g., slash one’s wrist or cut one’s throat compared to slash one’s throat or cut one’s wrist). The other approach is the frequency-based approach, which can be seen in the work of Firthian researchers such as Sinclair (Reference Sinclair1991). This approach typically involves statistical measures applied to large, computerized text corpora in an attempt to determine which word combinations occur with greater frequency than we would expect on the basis of the comparative frequency of the individual words.
Not surprisingly, there are advantages and limitations to both approaches. In the present study, however, we felt it was necessary to adopt an approach that was rooted in the frequency-based tradition. Because our study was centrally concerned with frequency effects, we needed an objective way to operationalize frequency for collocations, and the frequency-based approach was the only reasonable way to do this. Nonetheless, we would like to point out that we are wholly sympathetic with the arguments posited by researchers working in the phraseological tradition and accept that there are some limitations in working exclusively with a frequency-based definition of collocation.
One limitation, in particular, that warrants further elaboration is the assumed connection between corpus-based frequency and frequency of input for language users. It would be foolish to assume that any corpus, no matter how large and how divergent its sources, could ever precisely replicate a given language user’s experience with the target language. A language user’s experience with the language is likely to be highly individualized and influenced by a number of factors, including education, dialectical factors, upbringing, and personal hobbies and interests, among other things. Nonetheless, as several researchers have pointed out (e.g., Hoey, Reference Hoey2005), a sufficiently large and adequately representative corpus can give us an indication of the types and regularity of input a language user is likely to have been exposed to, and it would certainly be odd to find proficient language users whose language input experiences had no overlap whatsoever with the sort of statistical data that can be gleaned from a corpus. In short, then, although we cannot assume that corpus data are entirely compatible with a language user’s experience, it seems reasonable to assume that they are, at least to a large extent, commensurable.
Once the decision to work with a frequency-based definition had been made, the next step was to decide what sorts of collocations to test. For this study, we opted to use adjective + noun combinations because these seemed most amenable to the procedure used (i.e., an acceptability judgment task). This amenability made it easier to control for consistency in the items due to the fact that these combinations do not exhibit the sort of variability in determiners often demonstrated in verb + (object) noun combinations (e.g., make a mistake vs. make progress). We then obtained a list of adjective + noun collocations that occurred with varying frequencies in the corpus. For this study, we used data from the 425-million-word version of the Corpus of Contemporary American English (COCA; Davies, 2008–). Setting the minimum frequency of occurrence at 10 enabled us to collect low-frequency collocations while avoiding very idiosyncratic word combinations, which could potentially show up in use, and resulted in no fewer than 207,835 adjective + noun collocations. As with word frequency, the frequency of occurrence for these collocations followed a Poissonian rather than a linear distribution. The raw frequencies for all the collocations were thus log adjusted before being divided into frequency bands. This resulted in a range of adjusted frequencies between 2.3 and 10.58, which were then divided into 10 equal bands solely on the basis of the frequencies. Our initial intention was to select five congruent and five incongruent collocations from each frequency band (using Swedish as the comparison language; see the following paragraph for a more detailed explanation), but this proved impossible for the three highest frequency bands due to the small number of items in these bands combined with a lack of incongruent items (e.g., the first band had a total of only four collocations and included only one that was incongruent). Therefore, we decided to combine these three frequency bands into a single band and selected five congruent and five incongruent collocations from this amalgamated band. After this, we continued to select five items of each collocation type from each of the remaining seven bands, which resulted in a total of 40 congruent and 40 incongruent items.
Determinations regarding congruency and incongruency were made by the second author, who is a NS of Swedish and has nativelike proficiency in English. For the purposes of item selection, a collocation was deemed congruent across English and Swedish if the assumed core meaning of the corresponding constituents (i.e., orthographic words) enabled a direct translation equivalence (see also Bahns, Reference Bahns1993; Nesselhauf, Reference Nesselhauf2005). As an example, the English collocation handsome man can be argued to correspond congruently to the Swedish collocation snygg man. The core meaning of the two constituents in the collocation enable a direct word-by-word translation in terms of prototypical semantic value (Verspoor & Lowie, Reference Verspoor and Lowie1993). An incongruent item, however, does not allow for this straightforward operation. For example, an English collocation like identical twins does not lend itself to the same word-by-word translation on the basis of the assumed prototypical core meanings of its constituents. The English adjective identical would prototypically correspond to identisk in Swedish, whereas the noun twins would be tvillingar. The resulting Swedish phrase, *identiska tvillingar, would then be infelicitous (the felicitous Swedish phrase would be enäggstvillingar, which is literally “one-egg twins”), and, as such, the collocation identical twins was analyzed as an incongruent item. In this fashion, 40 congruent and 40 incongruent items were selected, which resulted in a list of 80 items. Additionally, frequency estimates for Swedish translations of all collocational items were obtained from a 425-million-word version of the Swedish Language Bank corpus compilation, KorpFootnote 1 (see Borin, Forsberg, & Roxendal, Reference Borin, Forsberg and Roxendal2012), housed at the University of Gothenburg. It should be noted that we did not allow for any collocational homographs. In other words, there were no items for which both the adjective and the noun were homographs in Swedish and English.
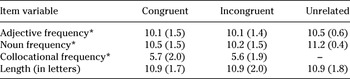
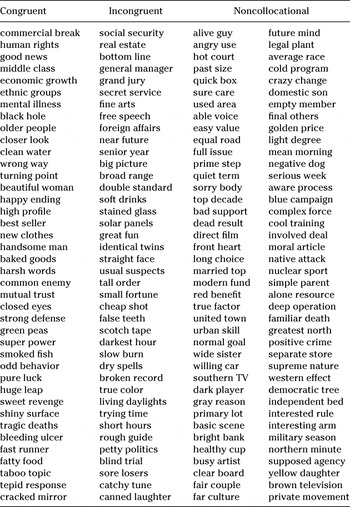
In addition to these 80 test items, we also constructed a list of 80 noncollocational items, which were assembled by randomly matching a list of high- to medium-frequency adjectives with high- to medium-frequency nouns. The resulting combinations were then checked against the online version of the COCA. If the combination appeared in the corpus at all, it was eliminated. If not, it was added to the list of noncollocational items. Additional steps were taken to ensure comparability across our two lists of collocational items (i.e., congruent and incongruent) as well as between all 80 collocational items and the 80 noncollocational items. First, the minimum item length was set at 8 letters, with a maximum length of 15. Additionally, word frequency (also log adjusted) was compared (both between the congruent and incongruent items and between all the test items and the noncollocational items) to ensure that there were no major differences between the lists in terms of individual words. Full details regarding the test items are provided in Table 1. The entire list of items is shown in the Appendix.
Summary of mean values for items used on the acceptability judgment task

Note.
Standard deviations are in parentheses.
* Log-adjusted values (higher values represent greater frequency).
The Acceptability Judgment Task
An acceptability judgment task was used to assess RTs on all of the items (both collocational and noncollocational). In its truest sense, an acceptability judgment task asks test takers to simply indicate whether or not the items are acceptable. However, it has most frequently been used with grammatical acceptability in which judgments are comparatively straightforward. With adjective + noun collocations, the situation is more complicated due to the fact that most adjective + noun collocations can be deemed acceptable if some flexibility is used in interpreting them. There is rarely anything that is grammatically wrong about these collocations, and, unless the combination of words indicates something that is physically impossible (or at least highly unlikely), it seems that a good number of adjective + noun collocations could be perceived as acceptable. Therefore, we opted to use an alternate phrasing, which we felt would encourage a slightly more conservative approach to the task, by asking participants to indicate whether or not the word combinations were “commonly used in English.” The exact instructions were as follows:
The following test asks you to determine whether the word combinations are commonly used in English or not. You will be presented with sets of two English words. Press the YES button (right CTRL) if the word combinations are commonly used in English. Press the NO button (left CTRL) if the word combinations are NOT commonly used in English. Please answer as accurately and quickly as you can. Again, the YES button is right CTRL, and the NO button is left CTRL.
The test was administered to two groups of participants: an experimental group of 25 L1 Swedish learners of English (the NNS group) and a control group of 27 L1 English speakers (the NS group). The NNS group consisted of undergraduate students enrolled in English courses at a Swedish university; the NS group consisted mostly of undergraduate students enrolled in an English composition course at a U.S. university supplemented by a few students enrolled in a graduate-level TESOL methodology course. Prior to testing, all participants were asked to fill out a brief questionnaire specifying their sex, age, vision (i.e., whether they had normal vision or corrected-to-normal vision), dexterity, mother tongue, and foreign language abilities. Table 2 provides a breakdown of the two groups of participants. It should be noted that none of the NS participants indicated any knowledge of Swedish as a L2.
Biographical information for participants

Note.
* Excludes two participants who indicated nonnormal, uncorrected vision.
**Excludes one participant who indicated ambidexterity.
The presentation of items was done using DMDX software (Forster & Forster, Reference Forster and Forster2003).Footnote 2 Prior to testing, computers at both sites (in the United States and in Sweden) were calibrated to ensure consistency in timing. The test began with a short practice session to acclimate the participants to the task. After this, the 160 test items (i.e., 80 collocational test items and 80 noncollocational items) were presented in an individually randomized order. The presentation of the items was as follows. First, the program presented the test takers with a series of eight asterisks for the purpose of eye fixation. This lasted for just more than 333 ms and was followed immediately by a blank screen, which lasted for just more than 50 ms. The blank screen was followed by the presentation of an item (i.e., the full adjective + noun combination). Each item remained displayed until either the test taker pressed a key indicating commonality or lack of commonality or the program timed out at 4,000 ms. Accuracy of responses and RTs were recorded by DMDX. The entire test typically took less than 10 minutes to complete.
In addition to the acceptability judgment task, the computerized version of the Eurocentres Vocabulary Size Test (EVST; Meara & Jones, Reference Meara and Jones1990) was administered to the NNS group to get a general sense of overall proficiency. The EVST asks test takers to make yes/no judgments in response to words of varying frequencies as a means of assessing receptive vocabulary size. It also includes a number of pseudoword distractor items and adjusts for test takers who may otherwise overestimate their knowledge.
RESULTS
The biographical data revealed that there were two NS participants who did not have normal or corrected-to-normal vision, so these participants’ data were eliminated, leaving exactly 25 participants in each group. The remaining results were analyzed in a number of ways. To begin, the NNS group’s EVST scores were evaluated in an effort to gain insight into the learners’ receptive vocabulary size (and, by extension, to ascertain a rough understanding of their proficiency). The mean score indicated the NNS group members had an average vocabulary size of 7,350 words (SD = 1,546).Footnote 3 It is indeed difficult to relate scores like these to the range of proficiency levels used in the SLA literature (e.g., intermediate, high intermediate, advanced) because there are no widely agreed standardized levels. For sake of comparison, Milton (Reference Milton, Bartning, Martin and Vedder2010) reports estimated receptive vocabulary size scores in relation to the Common European Framework of Reference for Languages (CEFR) levels and various Cambridge exams. He shows that passing the Cambridge Advanced English and the Cambridge Proficiency in English tests, which are roughly equated with the highest levels (i.e., C1 and C2) of the CEFR framework, is associated with vocabulary size scores of 3,750–5,000 words. Taking these findings into account, the NNS group in the present study—with a mean vocabulary size score of 7,350 words on the EVST—can be argued to be a fairly advanced group of learners.
Before analyzing the RTs, we had to prepare our data. The first step was to remove erroneous responses, which included those that (a) received a response that was unanticipated (i.e., a no response for a collocation and a yes response for a noncollocation) or (b) timed out at 4,000 ms. After this, we trimmed the data to excise any outlying responses that did not fall within three standard deviations of an individual’s mean RT for all correct responses. The trimming procedure eliminated 0.79% of the NS group’s responses to the collocational items and 2.71% of their responses to the noncollocational items. For the NNS group, these figures were 0.63% and 2.40%, respectively. The mean RTs and ERs for the three critical conditions for both groups are shown in Table 3.
Mean response times in ms, standard deviations (in parentheses), and error rates [in brackets]

Analyses on RTs were done through a series of mixed-effects models using the mixed procedure in the SAS software package. All RT models used log-adjusted RTs as the response variable and incorporated item as a random effect and person as a random intercept. The general procedure followed (here and throughout the rest of our analyses) was to include all fixed effects and all interactions between the fixed effects in the initial model. In light of the results, we then eliminated interactions that were nonsignificant and refit the model using only the significant interactions and all fixed effects. If any fixed effects were still found to be nonsignificant, these were eliminated, and the model was refit until it only included significant fixed effects and significant interactions. Furthermore, we also noted changes in the Akaike information criterion (AIC) to ensure that the resulting model was the best fitting model for the data. If any significant interactions were offset by an increase in the AIC, which would indicate a poorer fitting model, these were eliminated as well.
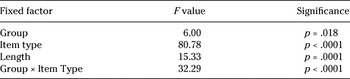
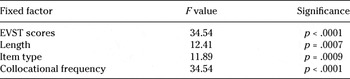
The first model was designed to determine (a) if the NSs responded significantly faster than the NNSs for any of the three item types (i.e., congruent, incongruent, or noncollocational), and (b) if there were significant differences in RTs within the two groups for the three item types. In addition to the aforementioned random effects, the model used group (i.e., NS or NNS), item type (i.e., congruent, incongruent, or noncollocational), and item length (i.e., total number of letters) as fixed effects. The results of our first model are shown in Table 4 (here and elsewhere only the significant effects that were included in the final model are reported). As can be seen in the table, group, item type, and item length demonstrated significant main effects. Additionally, there was a significant Group × Item Type interaction. To further explore these differences, post hoc tests were run for the significant interactions using a Tukey-Kramer adjustment for multiple comparisons.
Mixed-effects model results comparing group, item type, and item length with RT as the response variable

The NS group responded significantly faster than the NNS group only to the incongruent items (p = .003). No significant differences were found between the two groups in respect to the congruent (p = .186) or the noncollocational (p = .863) items. As for the differences for the three items types within the respective groups, the NSs’ responses to the congruent and incongruent items were significantly faster than to the noncollocational items (p < .0001 in both cases). However, RTs for the congruent versus the incongruent items were not significant (p = 1.0). The NNSs responded significantly faster to the congruent items over both the incongruent (p = .046) and noncollocational (p < .0001) items, and to the incongruent items over the noncollocational items (p < .0001). These results were consistent with our previous study (Wolter & Gyllstad, Reference Wolter and Gyllstad2011) and suggest that the congruent collocations were indeed recognized more quickly than the incongruent collocations for the NNSs.
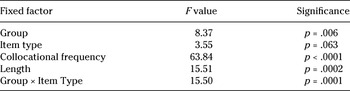
The next model was designed to assess the connection between English frequency for the collocations and RTs. The fixed effects for this model included group (i.e., NS or NNS), item type (i.e., congruent or incongruent), collocational frequency (English collocations, log adjusted), adjective frequency (log adjusted), noun frequency (log adjusted), and item length. The reason for excluding the noncollocational items from this analysis is that these all had a frequency of zero, which would have made the resulting model insoluble. The reason for including adjective and noun frequencies was to ensure that any significant difference found between collocational frequency and RTs was attributable to the frequency of the entire collocation rather than the frequency of the constituent words. The initial model indicated four significant interactions that included (a) Group × Item Type (p = .0003), (b) Collocational Frequency × Group × Item Type (p = .0004), (c) Item Length × Group × Item Type (p = .0002), and (d) Collocational Frequency × Item Length × Group × Item Type (p = .0004). Subsequent AIC analyses revealed that a better fitting model was obtained only when the Group × Item Type interaction was retained. Therefore, the other interactions were excluded, and the model was refit to include all of the initial main fixed effects and the Group × Item Type interaction. Notably, the resulting model showed no significant results for either adjective frequency (p = .468) or noun frequency (p = .952), so the model was refit again to exclude these effects. The results for the final model are shown in Table 5. As can be seen in the table, there was a significant main effect for group as well as for English frequency. In this model, item type was no longer significant (p = .063), likely due to the exclusion of the noncollocational items (and possibly the inclusion of frequency), but it was left in the model because it was superseded by the significant interaction between group and item type. Post hoc tests replicated the findings from our first model: NSs showed no significant difference in RTs between the two items types (p = .971), whereas the NNSs did (p = .011). Furthermore, the NSs responded faster than the NNSs only on the incongruent items (p = .003), with no significant difference observed for the congruent item RTs (p = .122). These results provide evidence that collocational frequency was an important factor for explaining RTs—regardless of whether the respondents were NSs or NNSs or whether the items were congruent or incongruent—whereas word frequency was not.
Mixed-effects model results comparing group, item length, item type, adjective frequency, noun frequency, and English collocational frequency with RT as the response variable

Note.
Neither adjective frequency (F = 0.53, p = .47) nor noun frequency (F = 0.00, p = .95) were significant factors and are therefore not included in the final model. Item type was retained in the model because it was superseded by the significant interaction between group and item type.
The third model was designed to determine if Swedish frequency could be used to explain variation in RTs between the congruent and incongruent items for the NNS group. Our earlier analyses as well as previous research findings (Wolter & Gyllstad, Reference Wolter and Gyllstad2011; Yamashita & Jiang, Reference Yamashita and Jiang2010) indicated that congruency provides something of a processing boost for NNSs for L2 collocations, yet it is unknown whether or not this boost is related to frequency in the L1. To model this, we used only the data for the NNS group (as the NSs would have been oblivious to the frequency of the collocations in Swedish) and only the data in the congruent condition, due to the fact that frequency values were only available in both languages for the items in this condition. As the two corpora used for obtaining frequency values in the respective languages were the same size, there was no need to scale the frequency values prior to analysis. Both English and Swedish frequencies were log adjusted and entered into the model as fixed effects. Not surprisingly—given the results of the previous analysis—there was a significant main effect for English frequency, F = 16.0, p < .0001. However, there was no significant main effect for Swedish frequency, F = 0.5, p = .483.Footnote 4 When combined with our other findings, this result suggests that, although there does seem to be an initial boost that comes from having a congruent L1 collocation when processing collocations in a L2, this processing gain is not affected by how frequent the congruent form is in the L1. Indeed, there seemed to be very little relationship between L1 frequency and RTs in this study.
Next, we conducted an error analysis using a generalized linear mixed-model procedure (for binomial data) in SAS to evaluate patterns emerging from the correct or incorrect responses (see Table 3). This involved two mixed-effect models. Both used response accuracy as a response variable with accuracy defined in terms of what was expected on each item (i.e., a yes response for the collocational items and a no response for the noncollocational items), and item as a random effect with person as a random intercept. The first model incorporated group (i.e., NS or NNS), item length (i.e., number of letters), and item type (i.e., congruent, incongruent, and noncollocational) as fixed effects. As with the RT analyses, the approach involved first fitting the model with all main fixed effects and all interactions between fixed effects. This model was then refit using all the main fixed effects and any significant interactions. Finally, nonsignificant main fixed effects were eliminated, and the model was, once again, refit so as to only include significant main effects and significant interactions. The results of the final model for the first error analysis are shown in Table 6. As can be seen in the table, the results indicated a significant main effect for group and item type and a significant Group × Item Type interaction effect. Post hoc analyses (again using a Tukey-Kramer adjustment for multiple comparisons) revealed a pattern that was slightly different from the RT results across the two groups: The NS group had significantly fewer errors than the NNS group for both the congruent (p = .047) and the incongruent (p = .009) items but not for the noncollocational items (p = 1.0). The analyses conducted within the two groups also showed some variation from the post hoc results obtained for the RT analysis within the groups, particularly for the NNS group. The NSs’ difference in ERs on the incongruent items and the congruent items was not significant (p = .087), but the differences between (a) the congruent items and the noncollocational items and (b) the incongruent items and the noncollocational items were significant (p < .0001 for both comparisons). Regarding the NNSs, the results showed significant differences between congruent and incongruent items (p = .026), and the congruent and noncollocational items (p < .0001). However, it is interesting to note that the difference between the incongruent items and the noncollocational items was not significant (p = .746). This means they were about as likely to identify a noncollocational item as collocational as they were to identify a collocational item as noncollocational. Furthermore, it suggests that the incongruent items were, as a whole, not as well known as the congruent items.
Mixed-effects model results comparing group, item length, and item type with ER as the response variable

Note.
Item length (F = 0.13, p = .71) was not a significant factor and is not included in the final model.
The second model for the ERs eliminated the noncollocational items (again due to the fact that the zero values for the noncollocational items would have made the results insoluble) and added collocational frequency (English only) as an additional fixed effect. The other fixed effects remained the same. The results of this model are shown in Table 7. As can be seen, the only fixed effects that were included in the final model were the main fixed effects of group, item type, and collocational frequency. The results show that even though group and item type were clearly associated with ERs, collocational frequency appeared to be the best predictor of ERs.
Mixed-effects model results comparing group, item length, item type, and English collocational frequency with ER as the response variable

Note.
Item length (F = 1.67, p = .20) was not a significant factor and is not included in the final model.
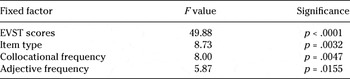
In addition to these models, a final group of six models was designed to assess if proficiency (as measured by EVST scores) was also related to RTs and ERs for the NNSs. Because EVST scores were not available for two of the participants, these results were all based on the data from 23 participants. As with the previously described models, these additional models included item as a random variable and person as a random intercept. The first three models used RT as the response variable, whereas the last three used ER. The first model was designed to determine if EVST had an effect on RTs for all three item types. In addition to EVST scores, it also included item length and item type as fixed factors (see Table 8). The second RT model included EVST scores, item length, item type, English collocational frequency, English adjective frequency, and English noun frequency as fixed factors (see Table 9). The third RT model included EVST scores, item length, English collocational frequency, and Swedish collocational frequency as fixed factors (see Table 10). The ER models replicated these three RT models in every respect except for the response variable (see Tables 11–13). It should also be noted that the second RT and the second ER models used only data from the congruent and incongruent items, whereas the third RT and ER models used only data from the congruent items for reasons related to insolubility as previously described. The results of all of these models are shown in Tables 8 through 13.
Mixed-effects model results comparing NNS EVST scores, item length, and item type with RT as the response variable

Mixed-effects model results comparing NNS EVST scores, item length, item type, and English collocational frequency, adjective frequency, and noun frequency with RT as the response variable

Note.
Adjective frequency (F = 0.12, p = .73) and noun frequency (F = 0.72, p = .40) were not significant factors and are not included in the final model.
Mixed-effects model results comparing NNS EVST scores, item length, English collocational frequency, and Swedish collocational frequency with RT as the response variable

Note.
Swedish collocational frequency (F = 0.68, p = .42) was not a significant factor and is not included in the final model.
Mixed-effects model results comparing NNS EVST scores, item length, and item type with ER as the response variable

Note.
Item length (F = 0.00, p = .95) was not a significant factor and is not included in the final model.
Mixed-effects model results comparing NNS EVST scores, item length, item type, and English collocational frequency, adjective frequency, and noun frequency with ER as the response variable

Note.
Item length (F = 0.07, p = .80) and noun frequency (F = 2.12, p = .15) were not significant factors and are not included in the final model.
Mixed-effects model results comparing NNS EVST scores, item length, English collocational frequency, and Swedish collocational frequency with ER as the response variable

Note.
Item length (F = 2.69, p = .10) and Swedish collocational frequency (F = 2.28, p = .13) were not significant factors and are not included in the final model.
Collectively, these results were largely in line with the results of the initial models in the sense that the same fixed factors tended to be associated with RTs. However, they also indicated that proficiency (as measured by the EVST) was a good predictor of both RTs and ERs for the NNS group. Furthermore, the nature of the relationship between the EVST scores and both response variables (RTs and ERs) was as expected: Higher EVST scores were linked to faster RTs and lower ERs in all models. This suggests that, in addition to congruency and frequency, L2 collocational processing is also affected by L2 proficiency (again, as measured by the EVST). Although this was not surprising, there was an additional unforeseen finding that emerged from these analyses that was particularly revealing. This was the significant EVST × Item Type interaction in respect to ERs as shown in Table 11. A logistic regression analysis of this result revealed that this significant difference was due to variations in the slope of the regression lines specifically for incongruent items when compared to the noncollocational items (t = 3.22, p = .0013). However, a comparison of the differences in the slope of the regression lines for congruent and noncollocational items was not significant (t = 1.37, p = .17). In simple terms, this means that, although higher EVST scores were linked to lower ERs in all three conditions, the link was most pronounced in the case of the incongruent items. To be more precise, the likelihood of producing an erroneous response decreased more rapidly with increases in EVST scores for the incongruent items than it did for the congruent items. This provides further evidence of the pervasive influence of the L1 on the development of L2 collocational knowledge. In effect, congruency appeared to act as something of an equalizer for participants at lower proficiency levels when making judgments about L2 collocations. The ability to correctly identify incongruent collocations, in contrast, was more closely associated with the participant’s proficiency in the L2.
To summarize the main findings from all the mixed models, it appears that learners (perhaps especially more advanced learners) are sensitive to frequency effects in the L2 for collocations regardless of whether or not the collocations have a congruent form in the L1. It also appears that congruency with the L1 provides learners with a processing advantage over collocations that are otherwise matched for other factors (e.g., frequency and item length). Nonetheless, this processing advantage seems unrelated to frequency in the L1. In this respect, although having a congruent form in the L1 appears to give a boost to processing speed, it does not appear that this boost is further accelerated through repeated exposures to the congruent L1 form, at least not on the basis of the results of this study. In short, frequency effects seem to be independent across the languages for congruent collocations. The error analyses seemed to largely parallel the RT analyses for the NSs, but there were some notable differences for the NNSs. More specifically, the NSs produced significantly more errors on the noncollocational items than on either of the collocational items but with no significant difference between the two types of collocational items. The NNSs, in contrast, produced significantly more errors on both the incongruent and the noncollocational items when compared to the congruent items but with no significant difference between the incongruent and noncollocational items. However, the tendency to correctly identify incongruent collocations as acceptable seemed closely linked to L2 proficiency. In brief, more proficient learners were better at correctly recognizing incongruent L2 collocations, whereas this same tendency was not as pronounced for congruent collocations.
DISCUSSION
As noted at the outset, this study was undertaken in an attempt to shed light on some key issues in L2 collocational processing. Specifically, we sought to determine if learners of English as a L2 would be sensitive to frequency effects for collocations regardless of whether or not the items had a congruent form in the L1. Furthermore, we sought to determine whether or not the frequency of translation equivalents in the L1 could account for variation in processing speed for congruent collocations. In this next section we explore what the results of this study suggest about these issues.
Frequency Effects for L2 Collocations
Our results are consistent with the small but growing body of evidence that indicates that proficient language learners are indeed sensitive to frequency effects in the L2 and that entrenchment occurs for NNSs at grain sizes above the single-word level (Durrant & Schmitt, Reference Durrant and Schmitt2010; Siyanova-Chanturia et al., Reference Siyanova-Chanturia, Conklin and van Heuven2011). This, in turn, provides further evidence in support of the idea that usage-based models of language acquisition may have a place in explaining the development of higher level L2 learners’ language systems. As stated in the introduction, usage-based language systems assume that language acquisition is experiential, data driven, and highly sensitive to frequency effects. In the words of Kemmer and Barlow (Reference Kemmer, Barlow, Barlow and Kemmer2000), “higher frequency of a unit or pattern results in a greater degree of . . . entrenchment, i.e. cognitive routinization, which affects the processing of the unit” (p. x). Specifically, usage-based models predict that higher frequency should lead to more rapid processing, and the fact that the single biggest predictor for RTs in the current study appeared to be the frequency at which the collocations appeared in the English corpus (for both the NSSs and the NSs) supports this view. In addition to the importance of frequency in structuring a language system, another key assumption of usage-based models is that linguistic forms are mapped to meanings at the granularity level at which meaning can be identified, regardless of whether the form is a single morpheme, a word or phrase, or even an entire sentence. The fact that collocational frequency was closely associated with variations in RTs (whereas word frequency was not) suggests that these learners were processing these collocations holistically as single units of meaning rather than compositionally as separate words. In turn, this suggests not only that advanced NNSs are sensitive to frequency effects but also that this sensitivity extends to grain sizes beyond the single-word level.
This would seem to contradict claims about NNSs’ limited sensitivity to frequency effects in language (e.g., Wray, Reference Wray2002). However, caution is needed in interpreting this finding too broadly. In other studies, findings such as this have been used to cast doubt on claims regarding the inability of L2 learners to process formulaic language as effectively as NSs. For example, Durrant and Schmitt (Reference Durrant and Schmitt2010) are particularly critical of Wray’s (Reference Wray2002) account of what she perceives as fundamental differences in the route of L1 and L2 language acquisition. Wray has suggested that L2 learners necessarily adapt a more analytic approach to the acquisition of the target language than L1 speakers, which ultimately limits their tendency to attend to larger formulaic sequences in language input. This, in turn, causes (or perhaps even forces) them to rely more on word-level processing. Durrant and Schmitt (Reference Durrant and Schmitt2010), in view of the results of their study, which indicated NNSs’ sensitivity to novel, recurrent collocational patterns in L2 input, counter Wray’s position and conclude that “adult second language learners do—in contrast to Wray’s claims—retain some memory of which words go together in the language they meet” (p. 179). Although we are sympathetic to Durrant and Schmitt’s position, we would also call for caution in applying the results of their study—and the present one—too liberally by assuming that most L2 learners are fully capable of processing larger, formulaic stretches of language in a manner that resembles that of NSs. For one thing, Durrant and Schmitt only tested cued recall of the second half of a second word in a word pair immediately after the treatment had been administered (e.g., warm FL__ for warm flat). Although this clearly resulted in a well-controlled study, it is debatable as to whether or not this approach fully represented the complexity of Wray’s ideas regarding the acquisition of formulaic language in naturalistic settings. Second, there is a danger in taking a one-size-fits-all approach when interpreting the results of empirical studies that investigate L2 frequency effects for larger grain sizes. Specifically, in the present study as well as the other studies that have shown NNS sensitivity to frequency for larger grain sizes (e.g., Durrant & Schmitt, Reference Durrant and Schmitt2010; Siyanova-Chanturia et al., Reference Siyanova-Chanturia, Conklin and van Heuven2011), the NNSs that have been shown to be sensitive to frequency effects have always been high-proficiency learners. In fact, Siyanova-Chanturia and her colleagues found that their group of lower proficiency learners did not, in contrast to their higher proficiency and NS groups, demonstrate a significantly faster processing speed for the higher frequency binomials over their lower frequency reversed forms. Indeed, it appeared that the lower proficiency group may have been relying much more on word-by-word analysis than their higher proficiency counterparts. In short, if a unified model of L2 processing is sought, it may be useful to consider the distinct possibility of a model that assumes greater centrality for frequency effects (and better recognition for larger grain sizes) with gains in L2 proficiency.
Accounting for the L1
It appears, then, that frequency may be a necessary component of accounts of L2 collocational acquisition. In light of the results of this study, it also appears that frequency by itself may not be sufficient. The results of the current study also suggest that the L1 may have a considerable impact on how rapidly collocations are processed in a L2. Four results in particular highlight this point: (a) The only significant difference in RTs between the NS and NNS groups was for the incongruent items, (b) only the NNS group responded significantly faster to the congruent items over the incongruent items, (c) only the NNS group produced significantly more errors on the incongruent items when compared to the congruent items, and (d) differences for ERs for incongruent items were more dramatically affected by proficiency than differences in ERs for congruent items. It would thus appear that the L1 does indeed have a considerable facilitating influence for recognition of L2 collocations, even at higher proficiency levels. How, then, can we account for this L1 influence in laying the foundations for a model of L2 collocational processing and storage?
The answer is perhaps not as straightforward as it would seem. The simplest approach would be to extend usage-based models to include frequency events across languages. In addition to the intuitive appeal this model gains from its simplicity, there is also theoretical and empirical support for the idea that language activation, at least at the single-word level, is nonselective. In other words, when processing in one language, bilinguals subconsciously and uniformly activate knowledge in their other language. This view is captured in models of word recognition such as the bilingual interactive activation (BIA) and BIA+ models (Dijkstra & van Heuven, Reference Dijkstra, van Heuven, Grainger and Jacobs1998, Reference Dijkstra and van Heuven2002), and the term often used to describe this cross-language activation is ballistic (Phillips, Segalowitz, O’Brien, & Yamasaki, Reference Phillips, Segalowitz, O’Brien and Yamasaki2004), meaning that it is unstoppable and not something that bilinguals are able to control. If we were to combine these two views, it would lead us to assume that (a) high-frequency collocations are stored in a manner that is on par with single words that also represent a single unit of meaning, and (b) when one of these collocations is activated in the L1, it causes ballistic activation of the associated collocation in the L2.
Unfortunately, there is conflicting evidence from word-level studies to suggest that this sort of ballistic activation also results in a frequency event in the latently activated language. In brief, the existing research indicates that, although lexical storage and access may not be language specific (see French & Jacquet, Reference French and Jacquet2004, and Kroll & Tokowicz, Reference Kroll, Tokowicz, Kroll and De Groot2005, for overviews), there is no consensus regarding whether frequency effects are tabulated only within the overtly activated language or across languages. In one lexical decision study, which investigated RTs to interlingual homographs (i.e., words with the same orthography but different meanings in two languages), Gerard and Scarborough (Reference Gerard and Scarborough1989) found that RTs were linked to the frequency of interlingual homographs in the activated language. For example, the homograph fin, which has a high frequency in Spanish (meaning “end”) and a low frequency in English, elicited faster RTs in a Spanish context over an English context, whereas red, which has a high frequency in English but a low frequency in Spanish (meaning “net”), produced the opposite result.
Other studies contradict this result. Beauvillain and Grainger (1987, Experiment 2) assessed whether it was the language mode of the test procedure (i.e., L1 or L2) or rather the higher frequency of interlingual homographs in either the L1 or the L2 that served as a better predictor of RTs. They found that the participants (i.e., English-French and French-English bilinguals) appeared to activate the higher frequency interpretation of the homograph (e.g., the string pain, meaning “bread” in French, over the English interpretation of pain, and the English four over the French interpretation of four, meaning “oven”) regardless of the language used in the task. From this, they concluded that (a) language activation is nonselective, and (b) frequency effects are tabulated across languages (at least in the case of interlingual homographs).
In relating the results of these investigations to the current study, two important considerations should be taken into account. One is the fact that interlingual homographs—and indeed L1-L2 phonological neighbors in general—likely account for a very small number of word forms in a proficient bilingual’s total lexical store (Vitevitch, Reference Vitevitch2012). The other consideration, which is arguably more important for the current study, is that congruent collocations are clearly and fundamentally distinct from interlingual homographs in a number of ways. We should therefore view the results of homograph studies with a degree of caution when attempting to draw comparisons to the current study on collocations. Nonetheless, the results of the current study seem to align more with those found in Gerard and Scarborough (Reference Gerard and Scarborough1989) in that they provide little evidence to suggest that frequency effects are tabulated across languages for congruent collocations. Swedish collocational frequency demonstrated almost no explanatory power for RTs. In view of this, although encountering a collocation in the L2 repeatedly seemed important for enhancing subsequent speed of recognition (as would be predicted in usage-based models), encountering the equivalent form repeatedly in one’s L1 seemed to do very little to further enhance this recognition. Thus, we are forced to find an alternate explanation for why the congruent collocations demonstrated a boost in processing speed over the incongruent collocations for our L2 group.
One possibility is that the accelerated RTs for the congruent items are related to what psychologists refer to as the age of acquisition (AoA) and order of acquisition (OoA) effects (Carroll & White, Reference Carroll and White1973). The basic premise of the AoA and OoA is that one of the most important factors for predicting speed and accuracy of recognition for words is the order in which the words were learned rather than any inherent qualities of the words (e.g., frequency). For example, in a recent study by Izura et al. (Reference Izura, Pérez, Agallou, Wright, Marín, Stadthagen-Gonzalez and Ellis2011), a series of picture-naming experiments demonstrated that OoA effects were instrumental in predicting RTs for recently learned L2 words. Furthermore, they found that OoA led to significant differences in RTs that were “independent of other factors such as cumulative frequency, frequency trajectory and imageability” (p. 32). Additionally, Izura and her colleagues found that these effects appeared to be fairly stable over the long term, with significantly faster RTs observed several weeks after the last training session had occurred.
Returning to the results of the current study, it may be that the faster RTs for the congruent over the incongruent collocations were due to these AoA and OoA effects. Although we recognize that learners are sometimes hesitant to make one-to-one assumptions about which collocations will transfer successfully from their L1 to their L2, particularly when the collocations are more figurative in nature (e.g., break glass vs. break promise; see Kellerman, Reference Kellerman1979), there are also compelling arguments in favor of the notion that acquisition is more straightforward when there is correspondence between the L1 and L2, at both the single-word level (Jiang, Reference Jiang2000) and the collocational level (Wolter, Reference Wolter2006; Yamashita & Jiang, Reference Yamashita and Jiang2010). With these considerations in mind, it may be the case that congruent L2 collocations are typically acquired earlier (although they are not necessarily met in input earlier) than incongruent collocations, and it is this general quality of the congruent collocations—rather than the frequency of the translations in the L1—that leads to more rapid recognition.
In making this claim, it is important to note that, although we cannot be sure at what point the earlier acquisition occurs, two main possibilities appear to exist. The first is that the early acquisition occurs in the L1 for the equivalent L1 collocations, and this acquisition is then transferred to the L2 congruent collocations once these are encountered. In this situation, the earlier exposure to the congruent L2 collocation would have presumably taken place several years prior to the learner’s first encounters with incongruent L2 forms, which would obviously lead to distinct AoA and OoA effects. The other possibility—and one that we feel is perhaps more plausible—is that the earlier exposure took place in the L2, but the knowledge of the L1 congruent form accelerated acquisition in a way that was not possible for incongruent collocations. Under this scenario, initial encounters with congruent collocations would lead to rapid acquisition, but incongruent collocations (even when they are equally frequent) would likely require more exposures before they could be acquired in the L2. Yamashita and Jiang (Reference Yamashita and Jiang2010) describe this scenario as follows:
We can imagine that, because congruent collocations can be accepted on the basis of their L1 counterparts, the frequency of encounters may not be as important for congruent collocations as it would be for incongruent ones in order to be understood and stored in the L2 lexicon. (p. 663)
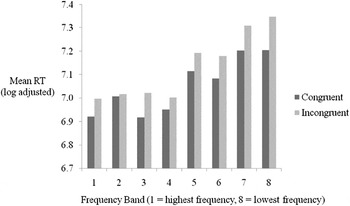
If this is indeed the case, it would lead to a situation in which the acquisitional advantages afforded to the congruent collocations by virtue of the L1 counterparts would tend to favor earlier acquisition for these collocations. Naturally, this would not exclude the possibility that incongruent collocations could be acquired earlier than congruent collocations, particularly if the incongruent collocations were of much higher frequency. However, it would result in a situation that would raise the likelihood for earlier acquisition for congruent items over incongruent items when the items occurred at roughly the same frequency in the L2. Clearly, this explanation will need further research before it can be verified, but it does provide an account that is consistent with our NNS data in terms of both slower RTs and higher ERs for the incongruent collocations when compared to the congruent collocations. It is also consistent with the observations that (a) our NNSs demonstrated sensitivity to frequency effects for both types of collocational items and (b) the link between ERs and proficiency was more pronounced for incongruent items than it was for congruent items. Furthermore, and importantly, it is consistent with the fact that, although the congruent collocations tended to be responded to more quickly than the incongruent collocations as a whole, higher frequency incongruent collocations tended to elicit faster RTs than lower frequency congruent collocations for our NNS group (see Figure 2).
Mean NNS RTs (log adjusted) arranged by frequency band comparing congruent versus incongruent items.

Differences in ERs
This leads us to our final issue: the results of the error analyses. To summarize the main findings here, we found that NSs produced significantly more errors on the noncollocational items than on either of the collocational items (i.e., congruent and incongruent), with no difference between the two types of collocational items. The NNSs also produced significantly more errors on the noncollocational items, although they concomitantly demonstrated a significant difference between the two types of collocational items. Furthermore, both groups showed a strong connection between frequency and ERs for the two collocational conditions. Specifically, the lower the frequency, the more likely they were to judge the item as not commonly occurring in English. Finally, as with RTs, ERs were clearly associated with proficiency in a predictable way. Neither the frequency-based results nor the proficiency-based results are difficult to account for. The frequency-based results simply resemble what we would expect to find on the basis of the previously described usage-based models of language: Frequent items are more likely to become entrenched—and therefore more likely to be identified as legitimate units in the target language—than less frequent items (see Figure 1). The proficiency-based results simply indicate that the higher proficiency participants were more accurate in their judgments. In this respect, neither of these findings needs extensive consideration.
The explanation for the other result that showed considerably higher ERs for the noncollocational items for both groups, however, is a little less straightforward. Before considering this, it is first useful to consider what constituted an error in each of these conditions. For the two collocational conditions, an error was an answer that indicated the participant believed it was not a common pattern in English. For the noncollocational items, however, an error was a response that indicated that the participant felt the item was a common pattern in English. The higher ERs in the noncollocational items indicated that participants were frequently willing to judge unattested collocations as common in English. One possible explanation, which we cannot disregard, is that these results came about due in part to the inadequacies inherent in corpus-derived estimations. As stated previously, corpora are clumsy approximations that can never fully capture the richness and complexity of an actual language user’s experience of accumulated usage events.
This inherent limitation notwithstanding, there may be an alternative (or perhaps an additional) explanation. Although it may not be quite as straightforward as our explanation for errors in the collocational conditions, this finding can also be accounted for by referring once again to usage-based models of language. One thing that any reasonable model of language structures needs to accommodate is novelty of expression. Indeed, one of the defining characteristics of language as a unique system of communication is our ability to encode and decode novel expressions, and a model that fails to explain this phenomenon is doomed to inadequacy. In usage-based models, novelty is explained through the presumed existence of so-called schemata (Langacker, Reference Langacker1987, Reference Langacker and Rudzka-Ostyn1988, Reference Langacker, Barlow and Kemmer2000). Roughly speaking, a schema is “a cognitive representation comprising a generalization over perceived similarities among instances of use” (Kemmer & Barlow, Reference Kemmer, Barlow, Barlow and Kemmer2000, p. xxiii). In other words, they are generic patterns that are abstracted from repeated exposure to recurrent structures in, among other things, a language. In the current study, the schema under investigation consisted of adjective + noun, which clearly represents a common schema in English (as well as a number of other languages, including Swedish). Because this is a schema with which all our participants were no doubt familiar and because of its high type frequency, it is possible that it was invoked in a manner that caused the participants to make assumptions regarding the prevalence of specific (and presumably semantically transparent) adjective + noun combinations in English. Furthermore, from a semantics perspective, it is worth noting our previous observation that adjective + noun combinations are rarely grammatically incorrect (as opposed to, say, verb + noun combinations that violate the argument structure of the verb), and it is generally possible to make sense of them even if they do not commonly occur in naturally occurring language.
CONCLUSION
This study was undertaken in an effort to gain a better understanding of some of the key factors that underlie collocational processing in a L2. The results suggest that NNSs, perhaps particularly higher proficiency NNSs, are highly sensitive to frequency effects for L2 collocations regardless of whether or not the collocations have a congruent form in the L1. This result is consistent with predictions emerging from usage-based models of language and suggests that future explanations of L2 language development will need to take into account both frequency effects and the NNSs’ apparent ability to process language at grain sizes beyond the single-word level. At the same time, it would appear that the L1 continues to have a considerable influence on how L2 collocations are processed, even at higher levels of proficiency (at least in cases in which the L1 and L2 are typologically and lexically closely related languages). Specifically, there seems to be a L1 boost that provides advanced NNSs with a processing advantage for congruent over incongruent L2 forms (at least as far as collocations are concerned). Given the observation that there does not appear to be any sort of one-to-one correlation between the frequency of translation equivalent L1 forms and the speed at which these forms are processed in the L2, it seems possible that this boost may instead be due to AoA and OoA effects.
Following is a list of items included on the acceptability judgment task. Congruent and incongruent items are arranged in descending collocational frequency. Noncollocational items are arranged according to item length.