INTRODUCTION
The last few decades have seen a growing interest in the cognitive organization of literacy skills and visual word recognition. One of the key theoretical insights of this research is that proficient reading in all writing systems requires an efficient mapping of orthographic units onto linguistic representations (phonology and morphology; e.g., Frost, Reference Frost2012). Importantly, in the process of accessing sound and meaning from print, readers utilize the statistical regularities that are characteristic of their writing system (Sawi & Rueckl, Reference Sawi and Rueckl2019). The mappings from orthography to linguistic representations, however, are often only quasiregular, and in many writing systems the mapping between a given grapheme and its phonological realization is not unequivocal. For example, in English, the letter i is pronounced differently in each of the words mint, side, and naive. Similarly, in the mappings from orthography to semantics, the two letters er in a word-final position convey a similar morpho-syntactic meaning in farmer, and teacher, but not in corner. This means that readers must not only acquire knowledge of what the statistical regularities are but also learn which regularities are more informative than others, and how to effectively leverage different possible dimensions of regularity to achieve an efficient division of labor between them. This understanding has led to the theoretical perspective that reading acquisition is an exercise in statistical learning (SL; Harm & Seidenberg, Reference Harm and Seidenberg2004; Sawi & Rueckl, Reference Sawi and Rueckl2019). The SL approach to literacy acquisition and reading processes is grounded in connectionist models of reading that demonstrate how the integration of statistical regularities into a learning model can explain complex linguistic behavior (McClelland & Patterson, Reference McClelland and Patterson2002; Rumelhart & McClelland, Reference Rumelhart, McClelland, McClelland and Rumelhart1986; Seidenberg & McClelland, Reference Seidenberg and McClelland1989). This approach has led to research focused on questions such as how regularities in letter-sound correspondences are assimilated by developing readers (Siegelman, Rueckl, et al., Reference Siegelman, Rueckl, Steacy, Frost, den Bunt, Zevin and Morris2020; Steacy et al., Reference Steacy, Compton, Petscher, Elliott, Smith, Rueckl and Pugh2019), how these regularities can be leveraged in learning to spell (Treiman & Kessler, Reference Treiman and Kessler2006), and how co-occurrence statistics between words can impact the processing of written sentences (Fine & Jaeger, Reference Fine and Jaeger2013). Within this research program, Strain and colleagues found that different levels of regularity in the mappings between print, speech, and meaning interact to jointly determine word-naming performance (Strain et al., Reference Strain, Patterson and Seidenberg1995), and that individual differences in the leveraging of regularities can explain word-naming skill in adults (Strain & Herdman, Reference Strain and Herdman1999). This examination of individual differences in the leveraging of regularities suggests that individuals vary in the division of labor between their reliance on different types of associations in a specific task. This conclusion also fits well with the computational modeling literature. Computational models such as the triangle model (Seidenberg & McClelland, Reference Seidenberg and McClelland1989) adopt from earlier dual-route models the idea that there is more than one way to access word meaning from the written signal, but deal with both lexical and sublexical mappings within a single framework, rather than through two distinct mechanisms. Crucially, according to such models, achieving efficient reading requires finding a balance between reliance on different pathways (Rueckl, Reference Rueckl2010).
Behavioral research into the relation between SL ability and reading skills has shown that performance in visual SL tasks predicts reading performance and development in both first-language (L1; Arciuli & Simpson, Reference Arciuli and Simpson2012) and second-language (L2) learners (Frost et al., Reference Frost, Siegelman, Narkiss and Afek2013). Although this research constitutes a proof of concept that individual differences in reading and SL abilities are related in some way, there are still many open questions both about how SL computations such as those as measured by a short SL task lead to variability in reading, and how performance in such tasks can extend to account for the rich and multidimensional statistics that characterize real-world reading behavior (see Erickson & Thiessen, Reference Erickson and Thiessen2015; Frost et al., Reference Frost, Armstrong and Christiansen2019 for further review). Correlations between SL performance and reading appear to depend on the specific SL tasks and reading tasks utilized (Elleman et al., Reference Elleman, Steacy and Compton2019; Lammertink et al., Reference Lammertink, Boersma, Wijnen and Rispens2020), and to vary somewhat in magnitude (Schmalz et al., Reference Schmalz, Moll, Mulatti and Schulte-Körne2019). Indeed, as a recent critical review of the literature on SL and reading disabilities points out, much of the individual-differences literature is vague about the theoretical constructs underlying SL, their mapping onto experimental tasks, and the relation of both of these to language behavior in general and to reading in particular (Bogaerts et al., Reference Bogaerts, Siegelman and Frost2020).
Recently, Siegelman et al. (Reference Siegelman, Kearns and Rueckl2020) have addressed this shortcoming, utilizing an alternative approach that focused on how lexical and sublexical statistical characteristics of words are reflected in naming performance of children who are developing literacy skills in their L1. They utilized a task designed to measure the impact of associations between orthography, phonology, and semantics on word naming performance (modeled after the group-level study by Strain et al., Reference Strain, Patterson and Seidenberg1995), finding that children who were more sensitive to print-speech associations, and less sensitive to print-meaning associations, were better readers. This approach allowed for a direct theoretical connection between individual differences in the assimilation of real-world statistical regularities and reading skill. By the joint manipulation of multiple dimensions of regularity within a single task, Siegelman et al. (Reference Siegelman, Kearns and Rueckl2020) were able to show how variability in the division of labor between different dimensions of regularity in printed information (i.e., orthography-to-phonology, orthography-to-semantics) explained individual differences in reading behavior across the spectrum of skills among developing L1 readers.
This approach has the promise of providing important insights regarding literacy acquisition in L2. If reading is indeed an exercise in statistical learning, then learning to read in a L2 has two additional facets beyond L1 reading. The first is that L2 literacy in adults is typically acquired by people who have already developed reading proficiency in their L1. Prior knowledge, both implicit and explicit, regarding the statistical properties of learners’ L1 likely impacts the way L2 literacy develops and affects the way O-P and O-S regularities are utilized by learners. The statistical regularities that characterize the writing system of the reader’s L1 do not usually characterize their L2, so that literacy acquisition in L2 involves adaptation to novel statistical regularities. In some cases, such as when the L2 utilizes a different script, it might constitute a completely new set of regularities, and in cases in which the same script is utilized by both languages, readers must adapt to those cases in which regularities in L2 compete with L1. For example, while most Germanic and Romance languages share an alphabet, the use of digraphs such as th and ch differ by language, as does the pronunciation of vowels and vowel digraphs. A word that ends in -ate in English will be pronounced quite differently from the same word in Italian or Spanish.
The second facet to consider is that in addition to prior knowledge from L1, L2 literacy is impacted differently by spoken L2 proficiency. While L1 literacy is acquired when spoken language is already fluent, L2 literacy is typically acquired simultaneously with, or even prior to, spoken proficiency. This is known to impact word learning (Havron & Arnon, Reference Havron and Arnon2017; Havron et al., Reference Havron, Raviv and Arnon2018) because words learned before and after literacy differentially rely on mappings between print, speech, and meaning (Chang et al., Reference Chang, Monaghan and Welbourne2019). This leads us to the present research. In the current study, we focus on investigating individual differences in L2 literacy, looking at how participants learning to read in a second language pick up on the statistical regularities of printed words in the novel L2 and leverage them during word naming. To this end, we examine how sensitivity to different types of regularities impacts L2 naming performance, hypothesizing that good L2 readers are those that develop sensitivity to the most informative dimensions of regularity in the novel writing system. Of particular interest is how this sensitivity develops over time.
LITERACY ACQUISITION AND THE LEVERAGING OF REGULARITIES
In the current study we characterize words in a naming task based on three types of regularities that have been shown to impact word reading behavior: (a) the consistency of mapping from orthography to phonology (O-P); (b) the mapping from orthography to semantics (O-S), as operationalized by imageability (see below); and (c) the frequency of words’ appearance. The joint impact of these three factors was first examined in the context of word naming by Strain et al. (Reference Strain, Patterson and Seidenberg1995). Strain et al. (Reference Strain, Patterson and Seidenberg1995) found that all three factors impact the behavior of adult readers in English as L1. In particular, Strain and his colleagues reported that highly imageable words are read faster and more accurately than those with low imageability. The impact on accuracy in naming was modulated, however, by both frequency and O-P consistency, with the imageability effect being larger for low-frequency and inconsistent words. This interaction demonstrated how different dimensions of regularity work together in tandem and determine reading behavior in the naming task, with O-S, O-P, and frequency jointly impacting performance: When one dimension is less informative, readers utilize other dimensions to facilitate naming.
We focus first on O-P consistency, or the correspondence between the written and phonological form of a word. Some words are phonologically fully consistent, that is, there is a single possible mapping from O to P: a word such as deer would only be pronounced one way. However, some words are phonologically inconsistent, and have multivalent O-P mappings, for example the word pint could potentially be read to rhyme with the word mint. The correspondence between the written and spoken form underlies phonological decoding of the written form, generally considered to be one of the fundamental skills underlying proficient reading (Ehri, Reference Ehri2005; Share, Reference Share1999). Indeed impaired phonological decoding is often taken to be one of the primary factors underlying reading disabilities (see e.g., Bishop, Reference Bishop2006; Jared et al., Reference Jared, McRae and Seidenberg1990; Ramus, Reference Ramus2003; Siegel, Reference Siegel1993; see Ramus & Ahissar, Reference Ramus and Ahissar2012 for review). A number of studies have shown that skilled L1 readers are both faster and more accurate when reading more “regular” words, that have higher O-P consistency (e.g., Cortese & Simpson, Reference Cortese and Simpson2000; Jared, Reference Jared2002). Importantly, O-P consistency can be assessed at different grain sizes, from smaller grain grapheme-phoneme mappings, to larger grain body-rime level consistency (Treiman et al., Reference Treiman, Mullennix, Bijeljac-Babic and Richmond-Welty1995). Research has shown that early readers rely more on small grain sizes, but that with more exposure and greater proficiency, larger grain sizes, which can be more informative than single grapheme mappings, are taken into account (Treiman & Kessler, Reference Treiman and Kessler2006; Ziegler & Goswami, Reference Ziegler and Goswami2006).
Next, we examine mappings from orthography to semantics (O-S). Although O-S regularities are less systematic than O-P mappings, there are statistical regularities at both lexical and sublexical levels that can be, and are, assimilated and leveraged by readers (Monaghan et al., Reference Monaghan, Shillcock, Christiansen and Kirby2014; Seidenberg & Gonnerman, Reference Seidenberg and Gonnerman2000; Strain & Herdman, Reference Strain and Herdman1999). O-S mappings are generally more arbitrary than O-P mappings, and often reflect morphological structure, with morphologically related words tending to be similar in both form and meaning (Rueckl, Reference Rueckl2010). Unlike O-P consistency, a precise calculation of O-S transparency is not straightforward. A common proxy for the extent of O-S involvement in reading has therefore been imageability, or how easily the printed word leads to a mental image of the semantics of the word (Paivio et al., Reference Paivio, Yuille and Madigan1968). Imageability has been taken to reflect the impact of conceptual knowledge, an aspect of O-S processes (Strain & Herdman, Reference Strain and Herdman1999; Strain et al., Reference Strain, Patterson and Seidenberg1995). As opposed to O-P consistency, imageability is related to statistical structure within the semantic domain, and related to the degree of intercorrelation among semantic features (Harm & Seidenberg, Reference Harm and Seidenberg2004; Woollams et al., Reference Woollams, Lambon Ralph, Madrid and Patterson2016). Accessing semantic representations depends on the degree of such intercorrelation, so that more imageable words are processed more efficiently, with a stronger involvement of O-S processes (Woollams et al., Reference Woollams, Lambon Ralph, Madrid and Patterson2016).
Finally, we examine word frequency, which is a major determinant of reading speed and accuracy (e.g., Grainger, Reference Grainger1990; Hudson & Bergman, Reference Hudson and Bergman1985; McRae et al., Reference McRae, Jared and Seidenberg1990), with more frequent words being read and named more quickly and accurately. In the present context, frequency has been shown to be an important modulating factor in word naming behavior, determining the division of labor between O-P and O-S associations (e.g., Strain et al., Reference Strain, Patterson and Seidenberg1995). Furthermore, more experienced and more proficient L1 readers are known to be less affected by frequency, showing good performance across the frequency spectrum, while weaker readers show slower and less accurate reading of infrequent words. This has been demonstrated across a range of behavioral tasks such as naming and lexical decisions (Chateau & Jared, Reference Chateau and Jared2000; Yap et al., Reference Yap, Balota, Sibley and Ratcliff2012), eye-movements (Kuperman & Van Dyke, Reference Kuperman and Van Dyke2011), and computational modeling of the impact of language exposure (Monaghan et al., Reference Monaghan, Chang, Welbourne and Brysbaert2017).
Individual differences in the division of labor between O-P consistency and O-S associations were shown to be related to standardized measures of L1 reading performance across the spectrum of typically developing children and those with reading disabilities (see Siegelman, Rueckl, et al., Reference Siegelman, Rueckl, Steacy, Frost, den Bunt, Zevin and Morris2020, for a detailed discussion). In their study, Siegelman and colleagues demonstrated that greater reliance on O-P regularities during a word-naming task was associated with better performance across a range of reading outcomes, whereas greater reliance on O-S regularities (operationalized as imageability) was associated with less proficient reading. Additionally, O-P regularities and imageability were shown to have independent impact on reading performance, but to jointly explain much of the individual variance in early L1 reading skills.
THE CURRENT STUDY
In the present study we take a similar approach to examine how L2 readers leverage frequency and O-P and O-S associations in naming words, and whether the relative reliance on these different dimensions vary as a function of L2 proficiency. Although the interplay of the various dimensions of regularity have been studied in L1 readers, both in adult (Strain & Herdman, Reference Strain and Herdman1999) and developing readers (Siegelman, Rueckl, et al., Reference Siegelman, Rueckl, Steacy, Frost, den Bunt, Zevin and Morris2020), to our knowledge there is no prior investigation regarding the division of labor in developing L2 readers. The present study addresses this gap, with a focus on how these regularities are picked up and are continuously assimilated across the trajectory of L2 acquisition, as readers become more and more attuned to the regularities of the novel writing system.
Our data was collected as part of a large-scale longitudinal study of the acquisition of English as an L2 across two years of immersion. Our sample is a cohort of new immigrants to the United States, all of whom emigrated from Israel, speak Hebrew as their mother tongue, and were working and/or studying in English during the time of immersion. Hebrew is a particularly good counterpart to English for our purposes, in that both languages have relatively opaque writing systems, and thus have complex systems of O-P mappings that must be learned; however, they utilize different alphabets and have very different lexical and morphological systems. The distinct alphabets and lexicons of the two languages allow us to be certain that O-P and O-S associations from the participants’ L1 do not either aid or compete with the new L2 regularities that are in the process of being learned. However, our participants have all acquired extensive reading skills in an opaque orthography (Hebrew), and thus have prior knowledge that O-P and O-S associations may be differentially reliable cues for reading in such systems.
Our main task was designed to measure the independent impact of O-P regularities, imageability, and frequency on word-naming behavior. In addition, a number of standardized measures of reading skill were collected. The same tasks were administered to the same subjects a second time following two years of L2 immersion (henceforth Time 1 and Time 2). This enabled us to examine how individual differences in leveraging the various dimensions of L2 regularity change across time. We looked at how individual differences in sensitivity to O-P and O-S regularities explain the variance of reading skills, and also at how this sensitivity develops across the two years of immersion, as readers assimilate the new regularities and leverage them for efficient reading.
At the group level, we expected that, similarly to L1 readers (Strain et al., Reference Strain, Patterson and Seidenberg1995), frequency, imageability, and O-P consistency should all aid word naming. Additionally, we examined whether the division of labor reported in L1 readers will characterize our cohort of L2 learners, so that O-S associations play a greater role when O-P consistency is lower. Regarding the interaction of imageability with frequency, evidence from previous studies with L1 readers is mixed. Whereas results from adult readers suggested a greater impact of imageability for low-frequency words (Strain & Herdman, Reference Strain and Herdman1999; Strain et al., Reference Strain, Patterson and Seidenberg1995), Siegelman et al.’s (Reference Siegelman, Kearns and Rueckl2020) work with beginning readers reported a reverse effect, with a super-additive interaction between the impact of O-P consistency and imageability. They attributed this to differences in the rate of learning of O-P and O-S associations, suggesting that O-S regularities are assimilated more slowly, and are thus too weak to assist word-naming performance of infrequent words for developing readers. Our study offers then a unique opportunity to examine these opposing predictions with L2 readers at different stages of their immersion in the second language.
Our focus, however, is primarily on individual differences in sensitivity to the different dimensions of regularity. We therefore estimated individual sensitivity to the regularities in L2 at each time point, looking at the impact of sensitivity to frequency, imageability, and O-P consistency at both small and large grain sizes, considering measures of accuracy and response time (RT). Given our interest in a potential trade-off between a reliance on O-P and O-S associations, we examine the relative reliance on these two factors for each individual, and whether this changes from Time 1 to Time 2 as proficiency increases. We hypothesize that with increased immersion in L2, readers will learn which regularities are more informative, with more skilled readers coming to rely more on O-P consistency.
We then turn to predicting L2 reading skill from individual differences in sensitivity to our different factors, by examining the correlations of our sensitivity measures with the standardized reading scores. As seen in L1 across development (Siegelman, Rueckl, et al., Reference Siegelman, Rueckl, Steacy, Frost, den Bunt, Zevin and Morris2020), we expect the more proficient L2 readers to rely more on O-P regularities, and the less proficient readers to rely more on imageability for naming. Here too, we examine whether and to what extent these correlations develop across time. We also predict that, with time, the more skilled L2 readers will be less impacted by frequency, as they learn to leverage sublexical O-P regularities. In another parallel with L1 development, we hypothesize that L2 readers will rely more on small grain sizes at early stages of development, and on large grain sizes as reading proficiency increases, and that this shift will characterize the more proficient readers in the sample.
In a nutshell, we examine how reliance on the different forms of statistical regularities jointly predicts individual performance in L2 reading skill, and how this develops from Time 1 to Time 2.
METHODS
PARTICIPANTS
Participants were recent Israeli immigrants to the United States, recruited in New York City. The average time participants had been in the United States upon entering the project was 1.2 years (SD: 11 months). All participants were studying and/or working in English upon entry to the study. Thirty-eight participants (25 male) provided data for analyses at Time 1, of these 33 remained in the project until completion and provided data for analyses at Time 2. The mean age of the participants at the start of the project was 22 years and 6 months (SD = 2.4). Participants were recruited into a larger project on L2 learning, and results from other cognitive and neuroimaging tasks used in the project are reported in Brice et al. (Reference Brice, Mencl, Frost, Bick, Rueckl, Pugh and Frost2019) and Brice et al. (Reference Brice, Frost, Bick, Molfese, Rueckl, Pugh and Frost2021). We focus here on a subset of behavioral tasks that probe the assimilation of various types of statistical regularities and the relation between these measures and reading outcomes.
MATERIALS, DESIGN, AND PROCEDURE
As part of a series of both neural and behavioral assessments, each subject participated in our word-naming task, as well as two standardized language tests, the Test of Word Reading Efficiency (TOWRE; Torgesen et al., Reference Torgesen, Wagner and Rashotte2012) measuring the number of correctly pronounced words and pseudowords read from a list within 45 seconds, and the Grey Oral Reading Test (GORT 4th ed.; Wiederholt & Bryant, Reference Wiederholt and Bryant2001), which measures passage reading fluency based on speed and accuracy in reading aloud and passage comprehension based on a series of multiple-choice questions for each passage. These tasks provide measures of various aspects of reading skill that will be related to individual measures of sensitivity to regularity. These tasks were administered as each subject entered the project, and then again following two years of immersion in English.
The word-naming task at the focus of the current study, identical to that utilized in Siegelman et al. (Reference Siegelman, Kearns and Rueckl2020), was modeled after the group-level investigation by Strain et al. (Reference Strain, Patterson and Seidenberg1995). The experiment was performed using Presentation software (Neurobehavioral Systems, www.neurobs.com). The task included 160 trials presented to subjects in a fixed order. In each trial, a fixation cross was presented for 500 ms, after which it was replaced by a monosyllabic English word presented in the center of the screen, which remained on screen until a verbal response was recorded by a microphone headset worn by the participant. Participants were asked to read each word out loud as accurately and quickly as possible, and their responses were marked for correctness by an experimenter who sat in the experiment room. In addition, responses were recorded for validation of the experimenters’ coding in cases in which the live scoring was not clear. Time until onset of the participants’ responses, as registered by Presentation from the microphone headset, was recorded for each trial. Words were chosen to vary along the three independent variables of interest: frequency, imageability, and O-P regularity. Log-transformed frequency was estimated for each target based on the Zeno corpus, grades 1–8 (Zeno et al., Reference Zeno, Ivens, Millard and Duvvuri1995), and words’ imageability was based on standard ratings (Paivio et al., Reference Paivio, Yuille and Madigan1968). These measures were chosen to ensure comparability with the results from the developmental study (Siegelman, Rueckl, et al., Reference Siegelman, Rueckl, Steacy, Frost, den Bunt, Zevin and Morris2020).Footnote 1
O-P regularities were operationalized in two ways. The primary operationalization was the surprisal (i.e., −log(p(i)) of the vowel pronunciation, which is a function of the relative likelihood of the pronunciation of a vowel grapheme; values from Siegelman et al., Reference Siegelman, Kearns and Rueckl2020). Hence, for example, the word pint has a higher surprisal value than mint because p(i →/aɪ/) is smaller than p(i →/ɪ/). Note that this is the operationalization used in the recent developmental study by Siegelman et al. (Siegelman, Rueckl, et al., Reference Siegelman, Rueckl, Steacy, Frost, den Bunt, Zevin and Morris2020) based on evidence that young readers rely more on grapheme-phoneme than body-rime regularities (Steacy et al., Reference Steacy, Compton, Petscher, Elliott, Smith, Rueckl and Pugh2019; Treiman & Kessler, Reference Treiman and Kessler2006). We also examined an additional measure of O-P regularities based on a larger grain size, hypothesizing that intermediate L2 readers may show increasing reliance on larger grain sizes as proficiency increases. To this end, we looked at a measure of O-P regularity based on the coda-conditional surprisal of the vowel pronunciation, utilizing relative likelihood of vowel pronunciation conditional on the coda. For example, while the digraph ea is likely to be read as /ɪː/ (e.g., in words such as heal, real, and deal), the rime -eart is consistently pronounced as /ɑɹt/ (or consistently /ɑːt/, depending on rhoticity of the speaker’s dialect), as that rime only appears in the word heart and its various derivations. Thus, while in the word heart the vowel-level surprisal (i.e., -log(p(ea → /ɑː/))) is relatively high (i.e., unpredictable pronunciation), its coda-conditional surprisal (i.e., -log(p(ea → /ɑ/ | /ɹt/))) will be low. Coda-conditional surprisal values were also taken from Siegelman et al. (Reference Siegelman, Kearns and Rueckl2020).
This task was originally designed for probing the development of L1 English reading, with words selected to be familiar to children in the second grade and above, and thus was suitable for beginner and intermediate L2 learners (see list of items in Siegelman, Rueckl, et al. Reference Siegelman, Rueckl, Steacy, Frost, den Bunt, Zevin and Morris2020). Items were selected to minimize the correlations between the three primary independent variables. Thus, the correlations between the three primary independent variables across the 160 items were small (unconditional surprisal and imageability: r = −0.08; unconditional surprisal and frequency: 0.04; imageability and frequency: 0.16). Unconditional surprisal and coda-conditional surprisal were more highly correlated with one another across items (r = 0.62). This is not surprising as words with greater (un)predictability in one grain size also tend to be more (un)predictable in the other (e.g., all words with ee in English are predictable regardless of grain size; see Siegelman, Kearns, et al. Reference Siegelman, Kearns and Rueckl2020). This correlation, however, must be kept in mind when considering differences in the relation of these two surprisal measures to other behavioral measures.
Our word-naming task was designed to measure accuracy in naming, however the protocol allowed us to collect RTs in addition to accuracy scores. Much of the developmental literature word naming has focused on accuracy, including the work by Siegelman, Rueckl, et al. (Reference Siegelman, Rueckl, Steacy, Frost, den Bunt, Zevin and Morris2020), as it is a reliable measure in developmental populations. However, once proficiency rises above a certain level, the validity of accuracy as a measure of reading skill can be constrained by a ceiling effect, and RTs are considered a more reliable and fine-grained window for tapping reading performance in adults. In the context of our study, the L2 readers are comparable to adults in terms of having a mature reading system, and mature general cognitive abilities, but are in fact developing readers in terms of exposure and proficiency. We therefore examine both accuracy and RT measures, with the understanding that (a) accuracy and RTs may tap into different aspects of the word-naming process and (b) the validity of accuracy and RTs in measuring the impact of regularities on word naming may shift as our readers become more proficient in their L2.
RESULTS AND DISCUSSION
GROUP-LEVEL RESULTS
We turn first to the group-level analysis of the word-naming task. We used the lme4 package in R (Bates et al., Reference Bates, Mächler, Bolker and Walker2015) to run mixed-effects models. We utilized linear models for modeling the log-transformed RTs, and logistic models (Jaeger, Reference Jaeger2008) for modeling accuracy, with correct responses coded as 1, and incorrect responses as 0. RTs from trials with microphone malfunctions were removed from RT analysis (10.4% of trials in total). All RTs from incorrect answers, and RTs longer than 2000 ms or shorter than 300 ms were removed from the RT analysis, and then all RTs over 3 standard deviations from each subject’s mean RT were also removed from analysis (1.29% of trials in total). Because our primary focus in this article is on individual differences, we ran data from Time 1 and Time 2 in a single combined model. The model included the effect-coded impact of time (Time 1, Time 2), and frequency, imageability, and unconditional surprisal, as well as all interactions between them, as fixed effects. Due to the high collinearity between unconditional and coda-conditional surprisal, we opted not to include both of them in the same model. Here we report models with unconditional surprisal only but results of models with coda-conditional surprisal returned similar results and can be seen in the supplementary material. All three continuous predictors were scaled and centered to reduce collinearity. Initial random effects included random intercepts for subjects and words, and random slopes for the three primary predictors by subject. For each model, the maximal random effects model that converged was utilized (Barr et al., Reference Barr, Levy, Scheepers and Tily2014), see supplementary material for the final converged models.
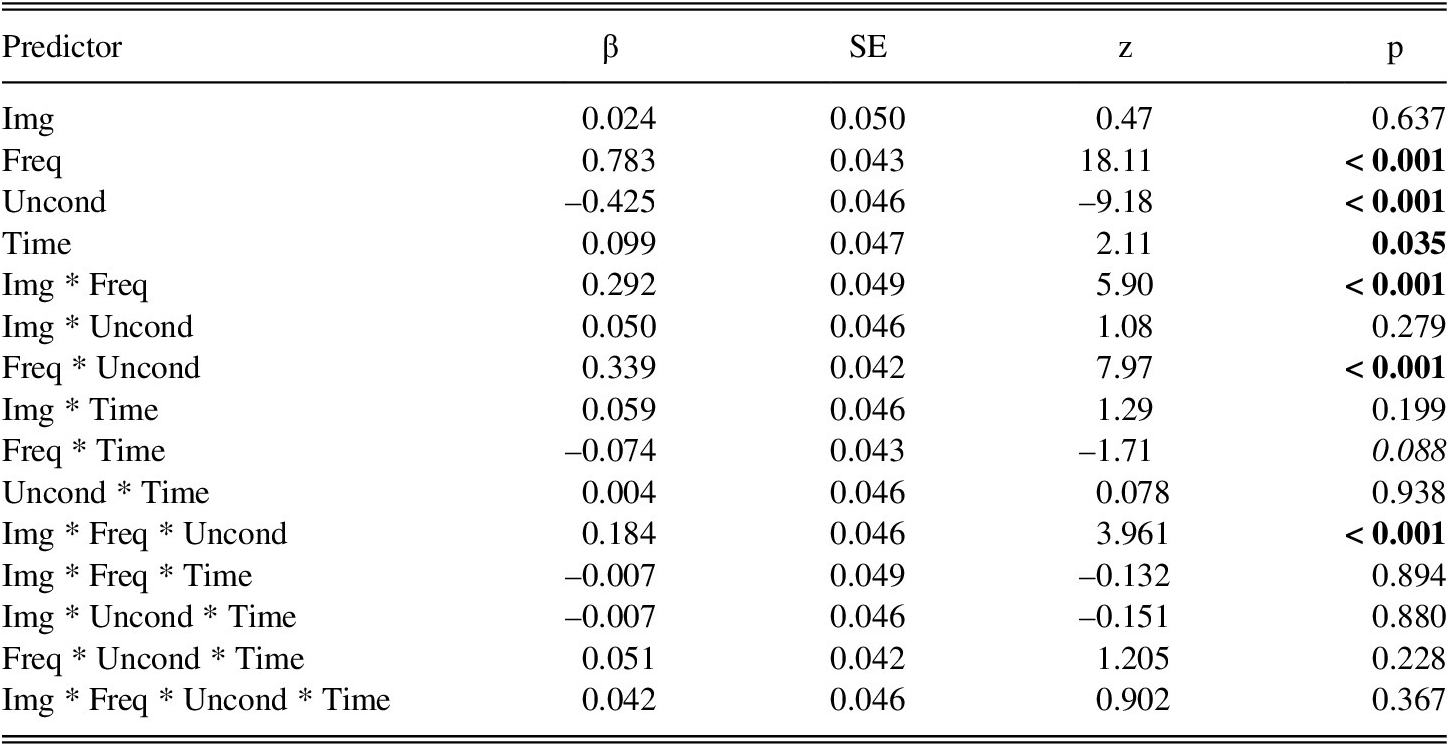
Table 1 shows results for the model on accuracy. Frequency and unconditional surprisal had the predicted effects, with more frequent and more consistent (i.e., lower surprisal) words being named more accurately. Interestingly, imageability had no main effect on naming accuracy. Time had a main effect, with accuracy increasing from Time 1 to Time 2 of immersion. In addition to the main effects, three interactions were found: unconditional surprisal by frequency, imageability by frequency, and a three-way interaction between unconditional surprisal, imageability, and frequency. The unconditional surprisal by frequency interaction was similar to that found in L1 readers, with the effect of O-P regularities being stronger for infrequent words (Strain et al., Reference Strain, Patterson and Seidenberg1995; Waters & Seidenberg, Reference Waters and Seidenberg1985). The interaction between frequency and imageability was, similar to that found in Siegelman et al. (Siegelman, Rueckl, et al., Reference Siegelman, Rueckl, Steacy, Frost, den Bunt, Zevin and Morris2020), in the opposite direction to that originally found (Strain & Herdman, Reference Strain and Herdman1999; Strain et al., Reference Strain, Patterson and Seidenberg1995), with the effect of frequency being stronger for more imageable words (i.e., a super-additive interaction). The three-way interaction shows that the interaction between frequency and imageability was greater for words with lower unconditional consistency. We discuss the patterns of interaction further in the general discussion.
Group-level fixed effects on accuracy in the word-naming task

Note: Img = Imageability, Freq = Frequency, Uncond = Unconditional surprisal.
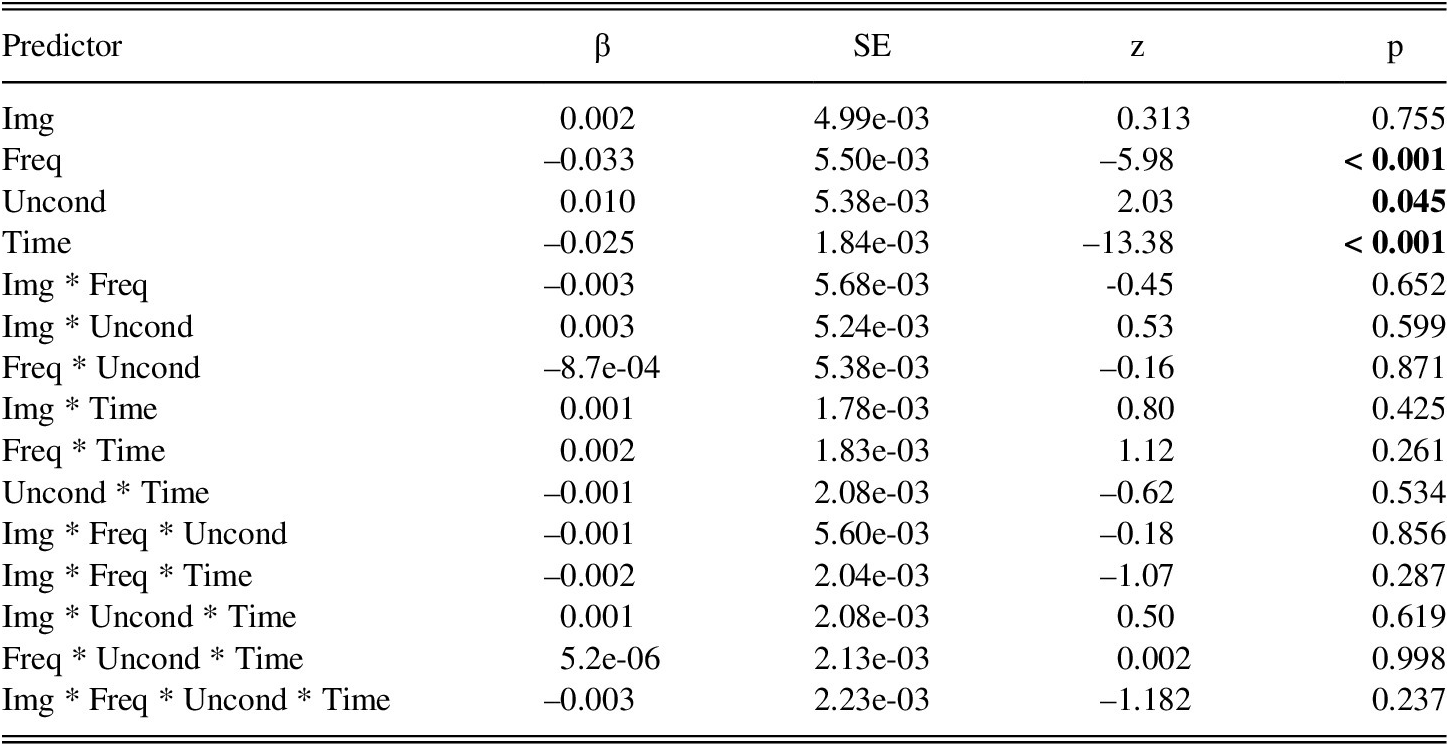
Table 2 shows the results of the model for RTs. The main effects were similar to the accuracy measures, with more frequent and more consistent words being named faster (and no significant effect of imageability), and with a reduction in RT from T1 to T2 as proficiency increases. However, the interactions seen in accuracy were not significant in the RT model.
Group-level effects on RT in the word-naming task

Note: Img = Imageability, Freq = Frequency, Uncond = Unconditional surprisal.
We also examined change in our measures of reading skill to ascertain that our participants’ reading ability indeed increased over the two years of the project. Table 3 shows descriptive statistics for the GORT and TOWRE measures at both times. As expected, reading fluency and comprehension both showed significant improvement over time, as did word reading (all p’s < 0.001). No significant change was seen in pseudoword reading.
Group-level results for GORT and TOWRE performance, and tests of improvement between time 1 and 2. Degrees of freedom differ between tasks due to missing or corrupted data, subjects were removed from tests on a case-by-case basis. GORT fluency score out of 140, comprehension out of 70. TOWRE scores are number of correctly named targets within 45 seconds.

Note: Comp = Comprehension, Psdword = Pseudoword.
INDIVIDUAL DIFFERENCES ANALYSES
We now turn to individual differences in the impact of sensitivity to regularities on word-naming performance and on the relation of these individual differences to L2 reading skills. To estimate sensitivity for each individual, we ran a set of eight regression models on each of our dependent variables. Each model had either accuracy or RT in the word-naming task as the dependent variable, and a single variable of interest (frequency, imageability, unconditional consistency, or coda-conditional consistency), scaled and centered, as the independent variable. The output of these models enables us to estimate a slope for each individual subject and each independent variable, estimating the impact of each of those variables on that individual’s word naming performance. Mean accuracy at Time 1 ranged between 81.1% and 97.5% (mean = 91.6%, SD = 4.7%), and at Time 2 between 85.9% and 97.9% (mean = 93.2%, SD = 3.7%). Note that the relatively high accuracy rates will impact the reliability of the measurements, as there are relatively few incorrect trials. However, this is not expected to systematically bias the estimates, and thus, if anything, should only underestimate correlation measures due to attenuation (see Siegelman, Rueckl, et al. Reference Siegelman, Rueckl, Steacy, Frost, den Bunt, Zevin and Morris2020 for discussion). All analyses in the following text are based on the 38 subjects in our sample (33 for Time 2), with subjects removed on a by-case basis wherever relevant data was missing.
It should be noted that higher unconditional or coda-conditional surprisal ratings reflect higher surprisal (i.e., less regular) words. Therefore, in the interests of simplicity of interpretation, the slopes for both unconditional and coda-conditional surprisal are “flipped” in all analyses in the following text, such that, as for frequency and imageability, a higher slope score reflects a reader who is more impacted by O-P regularities (in either the vowel alone or in the coda-conditional reading of the vowel). We therefore refer to these, hereafter, as unconditional and coda-conditional consistency. Similarly, for ease of interpretation, all RT slopes are reversed, such that participants whose RTs are more sped up by one of the measures have a higher (positive) slope score.
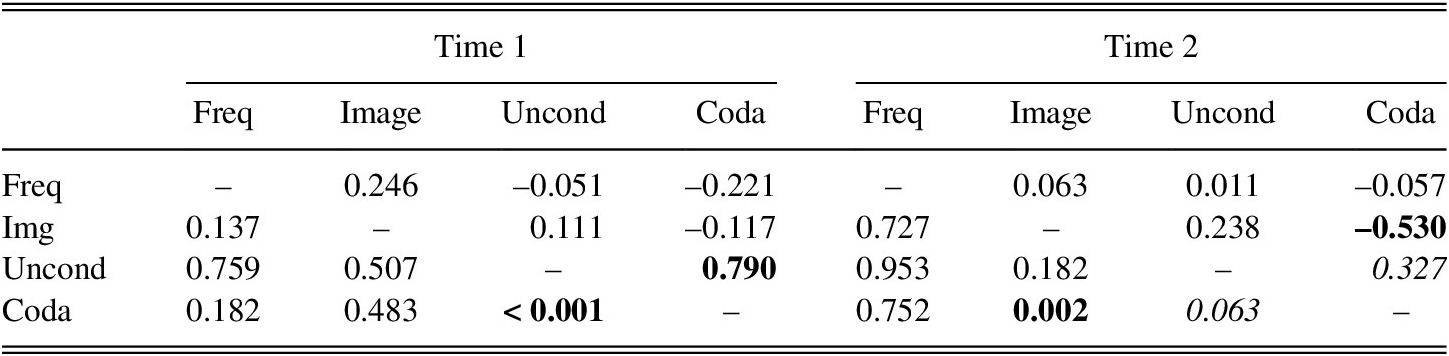
At Time 1, individual slopes for the impact of the three primary measures of frequency, imageability, and unconditional consistency on accuracy were not significantly correlated. Only the slopes for coda-conditional consistency and unconditional consistency were correlated with one another. By Time 2, the slope scores for imageability and coda-conditional consistency were negatively correlated, whereas the slope scores for vowel and coda-conditional consistency were now only marginally correlated. This shows first of all that a trade-off develops over time between leveraging O-P and O-S associations, and also that while O-P regularities were being leveraged to a similar extent at both small and large unit sizes at Time 1, the extent to which they are correlated within subjects decreases by Time 2. See Table 4 for the full matrix of correlations at each time point.
Bi-variate Pearson correlations of impact of sensitivity to frequency, imageability, and vowel and coda-conditional consistency on accuracy at time 1 and time 2. Significant correlations (p < 0.05) are shown in bold, marginal correlations (p < 0.1) in italics. Lower triangle contains p-values.

Note: Img = Imageability, Freq = Frequency, Uncond = Unconditional consistency, Coda = Coda-conditional consistency.
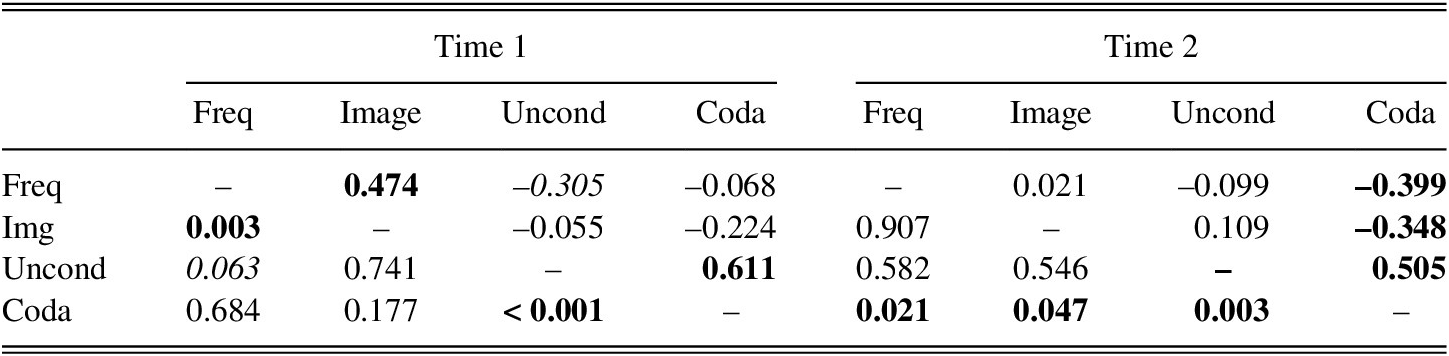
The individual slopes for RT showed a slightly different pattern. At Time 1, individual differences in the impact of frequency and imageability were correlated, as were the slopes for the impact of unconditional consistency and coda-conditional consistency. By Time 2, however, only coda-conditional consistency showed correlations, and was negatively correlated with the impact of frequency and imageability, and positively correlated with the impact of unconditional consistency. This shows, once again, a trade-off between relying on O-P consistency and O-S processes, as well as a shift such that the larger grain sizes seem to be playing a more important role in that trade-off with time. See Table 5 for the full matrix of correlations between the slopes.
Bi-variate Pearson correlations of impact of sensitivity to frequency, imageability, and unconditional and coda-conditional consistency on RT at time 1 and time 2. Significant correlations (p < 0.05) are shown in bold, marginal correlations in italics. Lower triangle contains p-values.

Note: Img = Imageability, Freq = Frequency, Uncond = Unconditional consistency, Coda = Coda-conditional consistency.
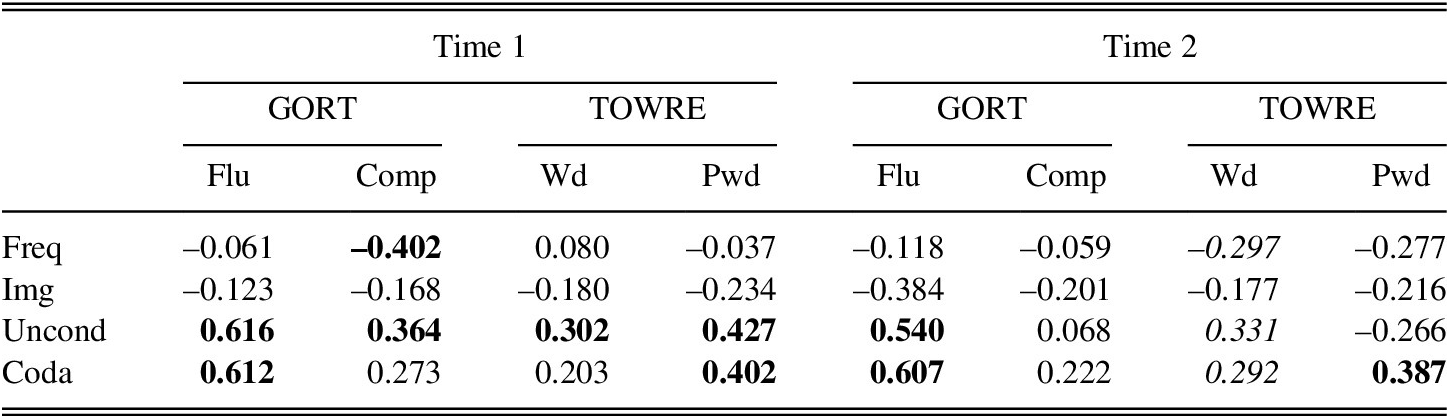
We next look at the relation between the individual slopes for sensitivity to our various measures, and the measures of reading skill. Looking first at the slopes for accuracy, the strongest effects are seen for the unconditional and coda-conditional consistency slopes. Unconditional consistency slopes correlate with all reading scores at Time 1, but only with GORT fluency at Time 2, while coda-conditional consistency correlates with GORT fluency and TOWRE pseudoword reading at both times. Sensitivity to frequency shows only a negative correlation with GORT comprehension at Time 1, and imageability shows no correlations at all. See Table 6 for the full table of correlations. Thus, we can see that, as predicted, stronger readers rely more on O-P consistency, whereas weaker readers show a tendency to be impacted more by frequency, especially at Time 1. Although it did not reach statistical significance, sensitivity to imageability was consistently negatively correlated with all reading skill measures. We also see the predicted shift in grain size, with unconditional consistency being more important for skilled readers at Time 1 but being less relevant than the larger grain-size consistency by Time 2.
Correlations between individual slopes on accuracy for frequency (Freq.), imageability (Imag), unconditional consistency (Vowel) and coda-conditional consistency (Coda), and the four behavioral measures. Significant correlations in bold, marginal correlations in italics.

Notes: Img = Imageability, Freq = Frequency, Uncond = Unconditional consistency, Coda = Coda-conditional consistency.
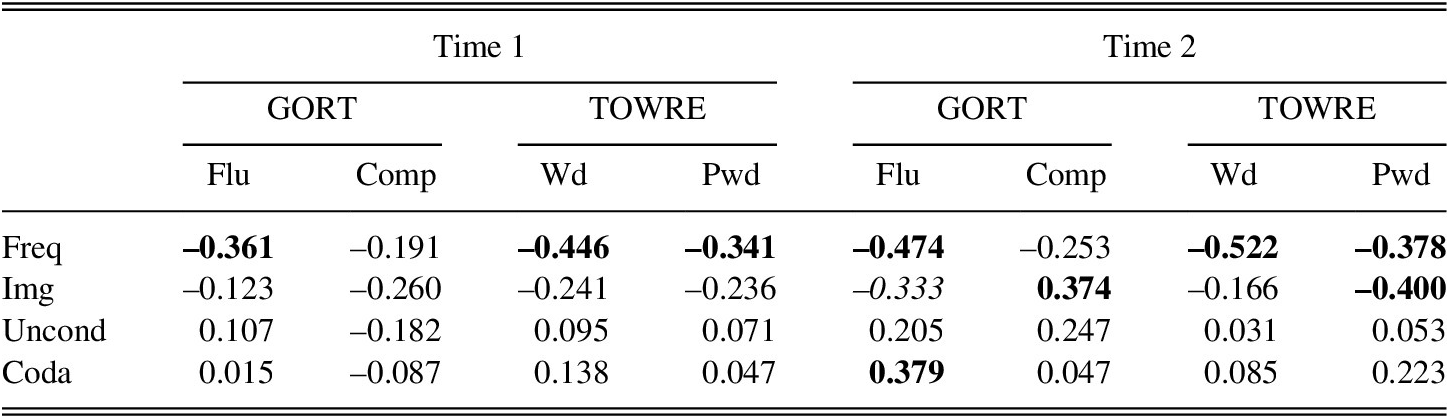
The pattern of correlations for the slopes on RT was very different, however, with stronger correlations seen for sensitivity to frequency and imageability. Frequency sensitivity was negatively correlated with all reading skills other than GORT comprehension at both times, whereas imageability showed a negative correlation with TOWRE pseudoword reading, and a marginal negative correlation with GORT fluency, but only at time 2. A positive correlation was obtained between imageability and GORT comprehension. Unconditional consistency slopes showed no correlations, and coda-conditional slopes correlated only with GORT fluency at time 2. Here we see that, as expected, a reliance on both frequency and imageability is a hallmark of poor readers. See Table 7 for all correlations.
Correlations between individual slopes on RTs for frequency (Freq), imageability (Imag), unconditional consistency (Uncond) and coda consistency (Coda), and the four behavioral measures. Significant correlations in bold, marginal correlations in italics.

Note: Img = Imageability, Freq = Frequency, Uncond = Unconditional consistency, Coda = Coda-conditional consistency.
Finally, we approach the question of the trade-off between O-P and O-S mappings in L2 readers, as assessed by the slope scores, and how sensitivity to these measures jointly explains reading behavior. Given the large number of potential measures available, we picked the measures that showed the strongest relations to reading skill, namely the slopes for frequency and imageability on RT, and the slope for coda-conditional consistency on accuracy. For reading skills, we present here data predicting GORT fluency, as this was the measure that showed the strongest correlations with our slopes for individual sensitivity. We ran a multiple regression model utilizing the slopes and reading scores to probe whether O-S and O-P regularities have distinct contributions to reading skill, and whether these contributions changes with increased L2 proficiency. Models were run on each time separately, with main effects of frequency, imageability, and coda-conditional consistency, and the interaction between imageability and coda-conditional consistency. All variables were scaled and mean-centered. Models were also run with unconditional consistency measures in place of coda-conditional consistency, and with the remaining skill measures as dependent variables. Very similar results were obtained, although the explained variance was lower, and individual effects were somewhat weaker. See supplementary material for results of all other models.
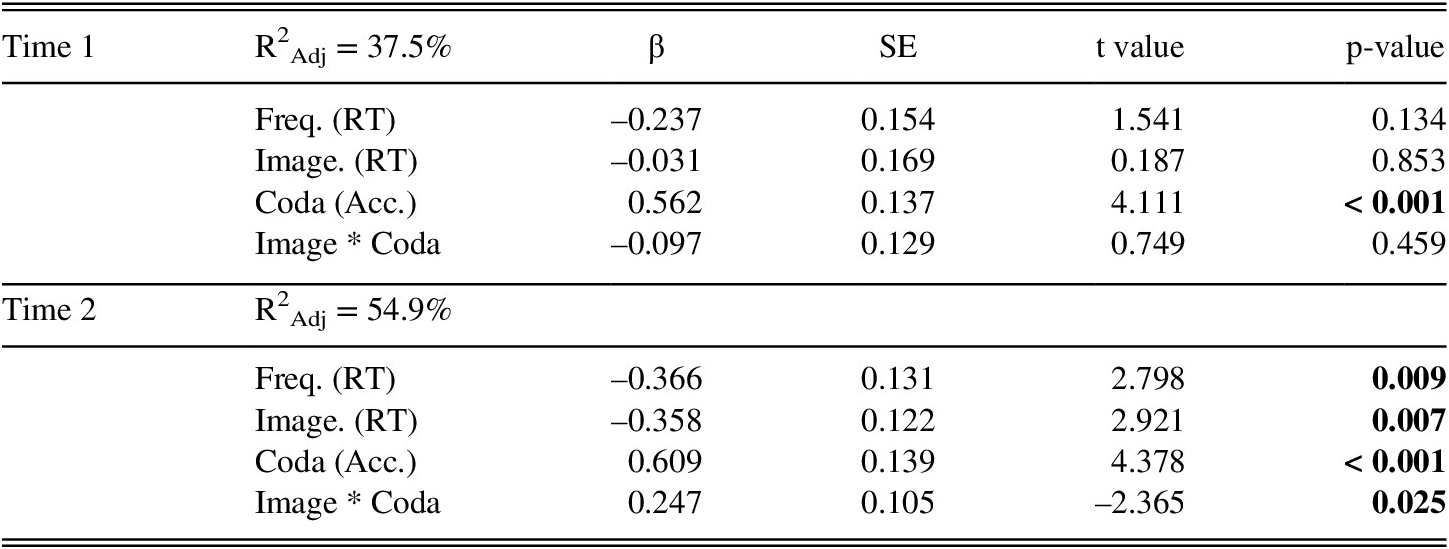
We found that at Time 1, only sensitivity to coda-conditional consistency was a significant predictor in the model, with better reading performance for participants with greater sensitivity to O-P consistency. However, at Time 2, better readers still showed greater sensitivity to coda-conditional consistency, but also showed less sensitivity to both frequency and imageability. In addition, an interaction at Time 2 between sensitivity to imageability and O-P consistency shows that sensitivity to O-P consistency was more crucial for reading skill for those participants who were also sensitive to imageability. In both models, but especially Time 2, not only were the models significant but they also explained a substantial proportion of the variance in performance, especially at Time 2, where more than 50% of individual variance in reading skill was explained by the model (total R2 Adj = 37.5% at Time 1, and 54.9% at Time 2).Footnote 2 See Table 8 for the full models.
Regression models predicting reading skill from sensitivity to O-P, O-S and frequency at both times.

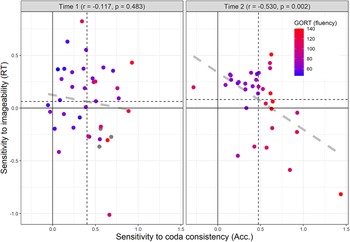
The association between imageability, coda-conditional consistency, and reading fluency can be seen in Figure 1, which provides the reading fluency skill on a color scale. Figure 1 shows that as a higher reading skill is associated with a higher sensitivity to coda-conditional consistency at both time points, but the relation of both reading skill and coda-conditional consistency to sensitivity to imageability emerges only at Time 2. In addition, although individual sensitivity to coda-conditional consistency does have a significant mean impact at both time points (i.e., mean coda-conditional consistency slopes larger than 0 in both time points: Time 1: t(37) = 9.55, p < 0.001, Time 2: t(32) = 9.00, p < 0.001) imageability does not have a significant mean impact at either time point (both p > 0.15).
Individual variability in sensitivity to coda consistency (x-axis) and imageability (y-axis) at each time. Dotted lines show the mean sensitivity to each factor, the dashed line shows the correlation between the individual slopes. Color scale shows performance on the GORT reading fluency task.

DISCUSSION
In this article we examined the development of L2 reading skills from the perspective of an SL account of reading. We looked at how leveraging statistical regularities across various dimensions of the writing system leads to developing proficient reading skills in L2, and whether the functional characteristics of reading in L2 resemble that of L1. To this aim, we tracked sensitivity of Hebrew speakers to frequency, O-P consistency, and imageability of English words across two years of immersion in an English-speaking environment. Investigating the joint contribution of frequency, O-P, and O-S regularities (including two different operationalizations of O-P consistency) to reading performance, allows us to examine how L2 readers leverage different dimensions of statistical regularities while mastering a novel writing system.
Individual sensitivity to these three primary factors during word reading aloud shows a pattern in L2 readers that is only somewhat similar to that reported in L1. Individual sensitivity to O-P consistency plays an important part in reading even in intermediate L2 readers and is better assimilated and leveraged by more proficient readers. With time and increasing proficiency, stronger readers come to rely on larger grain sizes of consistency. This parallels the importance of O-P regularities in L1 development (Siegelman, Rueckl, et al., Reference Siegelman, Rueckl, Steacy, Frost, den Bunt, Zevin and Morris2020) and the developmental trajectory of reliance on larger grain sizes in L1 readers (Treiman & Kessler, Reference Treiman and Kessler2006). The early and strong influence of O-P consistency is likely due to the fact that our L2 learners all have preexisting L1 literacy skills, with extensive experience in phonological decoding. However, assimilating the larger grain-size regularities requires more exposure to the L2. Interestingly, the impact of O-P consistency does not appear to saturate over time in our L2 readers, as it does for L1 readers (Siegelman, Rueckl, et al., Reference Siegelman, Rueckl, Steacy, Frost, den Bunt, Zevin and Morris2020), at least not in the time frame and level of expertise in our study.
Imageability shows an overall similar relation to reading skill as in L1, with the leveraging of O-S associations being a hallmark of poorer readers. Individual reliance on imageability shows a trade-off with O-P regularities, such that the less proficient readers are relying on imageability instead of O-P consistency, while stronger readers show the opposite trend. However, the impact of imageability was slow to emerge, with significant relation to reading skill only appearing at Time 2. This differs somewhat from the effects in L1, which are seen even in beginner readers (Siegelman, Rueckl, et al., Reference Siegelman, Rueckl, Steacy, Frost, den Bunt, Zevin and Morris2020). This difference is likely due to the fact that our L2 readers are learning spoken and written forms of their L2 simultaneously and have preexisting familiarity with literacy and an orthographic system. Research has shown that literacy impacts the processing of print, with words known before literacy is acquired relying more on O-S associations, while novel words learned after literacy acquisition rely more on O-P mappings (Chang et al., Reference Chang, Monaghan and Welbourne2019). Given that the L2 learners’ vocabulary is largely acquired simultaneously with and subsequently to orthographic knowledge, O-P mappings are leveraged immediately, but O-S associations are slower to develop, and do so only for the weaker readers. This also explains why at the group level no main effect was seen for O-S associations, in contrast to the usual effect seen in adult L1 populations (e.g. Strain & Herdman, Reference Strain and Herdman1999).
Finally, individual sensitivity to frequency was shown to relate to reading skill, with weaker readers being impacted more by frequency. Similar effects have been reported in L1 in adults (Chateau & Jared, Reference Chateau and Jared2000; Yap et al., Reference Yap, Balota, Sibley and Ratcliff2012). However, for developing L1 readers, individual differences in sensitivity to frequency did not explain much individual variance in reading behavior beyond O-P and imageability (Siegelman, Rueckl, et al., Reference Siegelman, Rueckl, Steacy, Frost, den Bunt, Zevin and Morris2020). The greater impact of frequency in L2 development as compared to L1 development is also likely due to the limited exposure L2 learners have had to their L2, meaning that infrequent words may barely have been encountered at all. It should be noted, however, that the impact of frequency in our study was seen primarily on RTs, which were not used in the L1 developmental sample, where accuracy is a more reliable metric (e.g. Siegelman, Rueckl, et al., Reference Siegelman, Rueckl, Steacy, Frost, den Bunt, Zevin and Morris2020).
Quantifying imageability, O-P consistency, and frequency, and measuring their impact within one statistical model, allowed us to assess how much of the individual variance in reading skill they jointly explain. This analysis mirrors the one in the L1 developmental sample by Siegelman, Rueckl, et al., (Reference Siegelman, Rueckl, Steacy, Frost, den Bunt, Zevin and Morris2020), where the joint contribution of O-P and O-S have explained a large portion of the variance in L1 development, while frequency did not have a significant additional contribution. Our findings with L2 learners do not concur with these results: First, at Time 1, only sensitivity to O-P consistency significantly explains performance, and neither O-S nor frequency show significant impact. By Time 2, sensitivity to both O-P and O-S associations explains distinct and significant variance in reading skill, similarly to L1 readers. However, for L2 readers, sensitivity to frequency is also found to explain a significant, and crucially independent, portion of the variance in reading ability, again showing that frequency effects, in general, are more pronounced in L2 relative to L1. While L1 readers are aided by their established spoken vocabulary during naming, L2 readers are learning spoken and written L2 in tandem. L2 readers have less overall exposure to the language and may have little if any exposure to infrequent words. This likely leads to the increased impact of frequency on L2 readers as compared to L1 readers.
Another facet of the results that must be noted is the different pattern of correlations with accuracy and RT measures. Frequency and imageability, which relate negatively to reading skill, show effects primarily on RT. O-P consistency measures, however, relate primarily to accuracy measures. This shows that different measures may tap different aspects of the reading process. Frequency and imageability can be leveraged for more efficient lexical access, which impacts the speed with which target words can be named. Reliance on O-P consistency, however, primarily impacts the ability to name words correctly, and to associate the correct phonological instantiation of the vowel given the orthographic and lexical context. The stronger relation between the impact of frequency and O-S associations on RT at Time 2 suggests that, as in L1 readers, RT provides a more granular window on reading skills in adults once proficiency has been acquired.
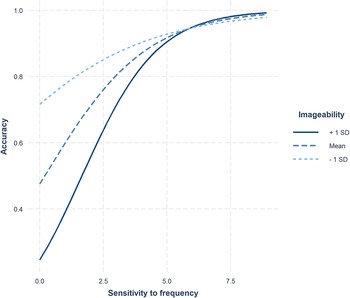
Although our primary interest in this study is in individual differences, the group effects are also of interest, in particular the trade-off between the different dimensions of regularity. The O-P regularity by frequency interaction was found as expected, but the interaction between frequency and imageability was in the opposite direction of that reported by Strain et al. (Reference Strain, Patterson and Seidenberg1995), with a greater impact of frequency on the high-imageability words than the low-imageability words (see Figure 2). This concurs with the findings reported by Siegelman et al. (Reference Siegelman, Kearns and Rueckl2020) for developing L1 readers. As in beginning readers of L1, this interaction may be due to different learning rates for O-P and O-S associations: The learning rate of O-S associations is slower given their lack of systematicity and because low-frequency words are learned later O-S associations may not be strong enough to contribute significantly to their naming (see Duff & Hulme, Reference Duff and Hulme2012, and Laing & Hulme, Reference Laing and Hulme1999, for similar results in an L1 word learning paradigm). The three-way interaction between frequency, imageability, and unconditional surprisal modified this effect somewhat, with the impact of imageability being greatest for low-frequency, high-surprisal words. Thus, we can see that, as in L1, the impact of imageability, O-P consistency and frequency are dependent on one another, with O-S mappings being leveraged where frequency and O-P consistency are less effective.
Interaction between imageability and frequency in their impact on accuracy. Plot created with the interact_plot() function in the interactions package for R (Long, Reference Long2019).

In summary, the longitudinal design of our study allows us to demonstrate how O-P and O-S regularities are acquired, leveraged, and differentially used with increased L2 reading experience. Our findings concur with the statistical perspective on reading, whereby proficient readers increasingly rely on more reliable and informative sources of systematicity, including in particular O-P regularities, and extend them to the domain of L2 reading. The similarities and differences between the trajectory found in L1 reading development and L2 literacy acquisition provide important insights regarding the acquisition of reading proficiency, and its relation to sensitivity to statistical regularities. The results show that preexisting literacy skills from the L2 learners’ L1, as well as the simultaneous acquisition of spoken and written L2 skills impact the way L2 readers assimilate and leverage regularities in print.
Competing Interest
The author(s) declare none.