





Introduction
Task-Based Language Teaching (TBLT) has emerged as a prominent approach in the field of additional language (L2) education for its potential to enhance learners’ communicative competence through meaningful language use. In TBLT, learners complete authentic, real-world tasks which encourage them to negotiate for meaning and develop communication skills in context. While TBLT has been shown to have advantages over other approaches (e.g., González-Lloret & Nielson, Reference González-Lloret and Nielson2015), the widespread adoption of TBLT has encountered challenges in large classes and exam-oriented education systems (e.g., East, Reference East2021; Newton, Reference Newton and East2025). Especially in contexts driven by high-stakes language assessments, stakeholders may doubt whether TBLT-based curricula can develop students’ language skills effectively for them to earn top marks (Butler, Reference Butler2011).
A strong task-based approach (Long, Reference Long2015) is distinct from structure-oriented L2 teaching approaches. TBLT prioritizes meaning-focused, goal-oriented communication rather than explicit form-focused instruction and decontextualized practice (East, Reference East2021). Despite decades of research on TBLT design, the comparative effectiveness of strong versions of TBLT with structural approaches, including task-supported approaches, for proficiency development remains under-researched, especially longitudinally (Boers, Bryfonski, Faez, & McKay, Reference Boers, Bryfonski, Faez and McKay2021; Boers & Faez, Reference Boers and Faez2026). Thus, the aim of this study was to compare language learning outcomes between a TBLT- and a language-focused, task-supported syllabus in a two-semester English for Business Purposes course. To capture a comprehensive picture of L2 development, outcomes were measured using two language assessments: a task-based language assessment (TBLA) to evaluate communicative performance and a lexicogrammatical test to evaluate explicit linguistic knowledge. This longitudinal comparative study contributes to calls for sorely needed research on TBLT’s effectiveness by examining these variables together, establishing whether TBLT can satisfy the demands of both real-world task performance and high-stakes language testing environments.
Background
Task-based language teaching
TBLT is an approach to language pedagogy which emphasizes language development via the completion of real-world tasks, fostering a learning environment where language is used receptively and productively to achieve specific goals aimed at building students’ language proficiency to function in relevant real-world contexts (Van den Branden, Reference Van den Branden2022). TBLT has been promoted as a strong form of communicative language teaching with a rich research tradition based on cognitive-interactionist, psycholinguistic, and sociocultural perspectives (Ellis, Skehan, Li, Shintani, & Lambert, Reference Ellis, Skehan, Li, Shintani and Lambert2020). Relatedly, TBLT has been argued to be the pedagogical approach most grounded in instructed second language acquisition (ISLA) theory and research to date (Loewen & Sato, Reference Loewen and Sato2021; Long, Reference Long2015).
Strong-form TBLT uses tasks as the unit of analysis in syllabus (i.e., curriculum) design (Long & Crookes, Reference Long, Crookes, Crookes and Gass1993). Meaningful and relevant real-world tasks are identified in a needs analysis and used to design a language syllabus and assessment plan (Long, Reference Long2015). In this approach, language learning occurs as learners engage in tasks that reflect authentic language use, with form-focused instruction provided as needed. However, there is “no a priori explicit teaching of language” (Ellis, Reference Ellis2024, p. 11). In contrast, weaker forms of TBLT use communicative tasks to supplement a form-focused curriculum (East, Reference East2021). Rather than driving learning, tasks may be used primarily as pedagogical tools for the practice of pre-taught forms (Samuda & Bygate, Reference Samuda and Bygate2008), often replicating a Presentation-Practice-Production (PPP) model, with tasks contributing to the practice (Ellis, Reference Ellis2024) and/or production phases (East, Reference East2021). “Weaker” forms of TBLT are often referred to as task-supported language teaching (TSLT) and constitute a fundamentally different approach from TBLT (East, Reference East2021; Ellis, Reference Ellis2024), as they are grounded in Skill Acquisition Theory (e.g., Dekeyser, Reference DeKeyser, Loewen and Sato2017). While both approaches incorporate tasks, strong TBLT places tasks at the core of the curriculum, whereas weaker forms of TBLT (i.e., TSLT) maintain a primary focus on the teaching and learning of grammatical structures and vocabulary, making “TSLT effectively no different from weak CLT [Communicative Language Teaching]” (East, Reference East2021, p. 75). Ellis (Reference Ellis2019, p. 456) described TSLT as “the mainstream methodology in structural language teaching today.”
Essential and still unanswered questions for TBLT are 1) the extent to which TBLT facilitates second or additional language (L2) development and 2) the extent to which TBLT outperforms non-TBLT approaches (Norris & Davis, Reference Norris, Davis, Ahmadian and Long2021). In a meta-analysis of 52 studies, Bryfonski and McKay (Reference Bryfonski and McKay2019) concluded that TBLT programs had a strong positive effect on L2 learning outcomes. However, the authors noted the inconsistent use of instruments for these outcomes and a lack of reporting of how outcomes were tracked. In addition, few programs collected information beyond one semester (15–16 weeks), making it difficult to evaluate the longitudinal impact of TBLT. In a critical reanalysis of this dataset, however, Boers et al. (Reference Boers, Bryfonski, Faez and McKay2021) and Boers and Faez (Reference Boers and Faez2026) reported that only one of the 52 studies used strong-form TBLT. Furthermore, a prevalent lack of methodological detail (e.g., amount of instructional time, learning opportunities outside the classroom, etc.) casts doubt on the validity of the claims supporting TBLT, leading the authors to conclude that “much more (and more solid and replicable) empirical work on the comparative effectiveness of TBLT needs to be done” (Boers et al., Reference Boers, Bryfonski, Faez and McKay2021, p. 15).
There are few longitudinal classroom-based studies comparing a strong TBLT approach with other approaches, and those that exist show mixed results. Ganjouee, Ghonsooly, and Fatemi (Reference Ganjouee, Ghonsooly and Fatemi2018) and Pomarolli, Artoni, Boschiero, and Piccinin (Reference Pomarolli, Artoni, Boschiero and Piccinin2023), for example, demonstrated that TBLT can lead to stronger outcomes than alternative approaches, but whereas Ganjouee et al. (Reference Ganjouee, Ghonsooly and Fatemi2018) found significantly higher speaking test scores in their TBLT condition than their PPP condition, in the Pomarolli et al. (Reference Pomarolli, Artoni, Boschiero and Piccinin2023) study, the TBLT group outperformed the control PPP group in writing, but not on listening, reading, or speaking. Others found that TBLT and PPP (Harris & Leeming, Reference Harris and Leeming2022) or TSLT (Qi, Reference Qi2023) approaches were equally effective in building L2 speaking proficiency, although Harris and Leeming (Reference Harris and Leeming2022) found slightly different developmental trajectories for each group. Whereas these studies adopted pre- and post-test designs, an important limitation is that the studies did not compare the development of both task-based performance ability and linguistic knowledge.
To our knowledge, González-Lloret and Nielson (Reference González-Lloret and Nielson2015) is the only study with a strong-form TBLT operationalization that evaluated students’ task-based L2 performance and linguistic knowledge and compared a TBLT to a non-TBLT approach. Seven target tasks, selected on the basis of a needs analysis, were implemented in an eight-week strong-form TBLT program that included task-based and non-task-based assessments. The students in the TBLT course significantly outperformed the students in the grammar-based comparison course in terms of oral fluency and syntactic complexity on the task-based assessments, with no differences in lexical complexity or grammatical accuracy between groups. On a standardized language proficiency test, the TBLT students improved over the course of the program on discrete components of sentence mastery and vocabulary, with smaller gains in fluency and pronunciation. Comparison group proficiency data was not available due to contextual constraints.
The capacity for TBLT to enhance discrete linguistic knowledge alongside communicative performance, as observed by González-Lloret and Nielson (Reference González-Lloret and Nielson2015), is supported by a broader body of empirical research. Regarding grammatical development, Cobb’s (Reference Cobb2010) meta-analysis demonstrated that engaging adult learners in focused oral communication tasks yields durable, medium-to-large effect sizes for the acquisition of target grammatical structures, indicating that meaning-focused interaction effectively drives morphosyntactic development. Similarly, Keck, Iberri-Shea, Tracy-Ventura, and Wa-Mbaleka’s (Reference Keck, Iberri-Shea, Tracy-Ventura, Wa-Mbaleka, Norris and Ortega2006) meta-analysis found that task-based interaction in focused tasks (i.e., with predetermined grammatical and lexical features) produced large gains in both grammatical and lexical acquisition, with effects persisting over delayed posttests and being particularly pronounced when tasks elicited pushed output. Together, these findings align with González-Lloret and Nielson’s (Reference González-Lloret and Nielson2015) results, supporting the premise that TBLT effectively supports the acquisition of discrete vocabulary and grammar knowledge typically targeted by TSLT without an overt pre-planned language syllabus (see also Long, Reference Long2016). However, while meta-analyses by Cobb (Reference Cobb2010) and Keck et al. (Reference Keck, Iberri-Shea, Tracy-Ventura, Wa-Mbaleka, Norris and Ortega2006) demonstrate that task-based interaction effectively fosters grammar and vocabulary acquisition, these reviews heavily emphasize dyadic task interaction rather than monologic oral performance. Furthermore, echoing the methodological limitations of González-Lloret and Nielson (Reference González-Lloret and Nielson2015), among others, there remains a notable lack of longitudinal studies comparing the outcomes of TBLT with those of form-focused instruction. Therefore, a clear gap remains for longitudinal research examining the effects of TBLT on both explicit linguistic knowledge and monologic task-based speaking performance among adult English for Specific Purposes (ESP) learners.
Task-based language assessment
Task-based language assessment (TBLA) is a form of evaluation that simulates a target task performance in a real-world (or simulated) language use context and assesses that performance “according to highly specific task-criteria like those used in non-assessment settings” (Norris & East, Reference Norris, East, Ahmadian and Long2021, p. 512). TBLA generally prioritizes learners’ ability to successfully complete a task; in other words, task completion is often the primary or only criterion for success or failure (Long, Reference Long2015; Norris & East, Reference Norris, East, Ahmadian and Long2021). TBLA thus aims to make meaningful interpretations about what learners can do in a target language use domain (Bachman & Palmer, Reference Bachman and Palmer2010), contrasting with general language proficiency or achievement tests which aim to measure L2 ability more broadly. Although TBLA may also include evaluations of L2 ability (e.g., fluency, vocabulary, grammar) alongside task-based criteria, Long (Reference Long2015) questioned this practice, arguing that the “introduction of a linguistic caboose could eventually lead to a reorientation of a task-based course, as a result of negative washback, to one which devotes progressively larger segments of class time to work on language as an object” (p. 333). He instead argued for a holistic assessment of a learner’s language performance, focused specifically on task completion, rather than evaluating a learner’s language performance at the level of specific linguistic features.
A challenge that TBLT evaluations face is thus selecting the most appropriate type of assessment and outcome measures to assess their effectiveness (Vandommele, Van Gorp, Van den Branden, & De Maeyer, Reference Vandommele, Van Gorp, Van den Branden and De Maeyer2022). While many TBLT studies logically opt for TBLA to document gains, TBLT programs may also face pressure from stakeholders to use standardized (often discrete and/or performance-based) language proficiency tests (e.g., González-Lloret & Nielson, Reference González-Lloret and Nielson2015). The extent to which TBLA and L2 proficiency tests, especially those proficiency tests that include a language use component assessing grammatical and lexical knowledge through discrete-point formats, show convergent or divergent evidence of L2 development is unclear, much like the enduring question of the L2 developmental affordances of TBLT versus other pedagogical approaches. Indeed, Bachman (Reference Bachman2002) argued that the extent to which a TBLA or a standardized proficiency test alone can fully capture L2 development is doubtful given the complexity of the underlying construct. To date, few studies have compared L2 development outcomes across different assessment types, and none have done so using an experimental design. These questions are relevant both at the theoretical level, to examine TBLT’s efficacy, and at the practical level, especially if TBLT is to show evidence of viability in contexts where L2 abilities are tested using discrete linguistic items in high-stakes tests.
The present study
To date, the effectiveness of TBLT programs, especially of strong-form TBLT programs (Long, Reference Long2015), has not been established in a robust way, with a notable lack of longitudinal studies comparing the outcomes of TBLT with those of form-focused instruction (Boers et al., Reference Boers, Bryfonski, Faez and McKay2021; Boers & Faez, Reference Boers and Faez2026). Furthermore, while studies have evaluated TBLT using either TBLA or general language ability tests, there are significant gaps in evaluating both domains simultaneously. It is not yet clear to what extent TBLT supports the development of explicit linguistic knowledge (i.e., grammatical and lexical knowledge measured through discrete-point assessments) alongside task-specific communicative proficiency. To address these gaps—specifically, the need for longitudinal comparisons of TBLT and TSLT outcomes, and the need to examine these outcomes using both TBLA and linguistic knowledge assessments together—we investigated the following two research questions:
RQ1: To what extent does a strong TBLT course improve students’ performance on a task-based speaking assessment and a linguistic knowledge test compared to a task-supported language course?
RQ2: How do task completion scores compare to other linguistic criteria (e.g., organization, comprehensibility, language use) on a monologic speaking task across time and instructional conditions?
Based on González-Lloret and Nielson (Reference González-Lloret and Nielson2015) and the argument that TBLT is more effective than form-focused approaches in facilitating language acquisition (Ellis et al., Reference Ellis, Skehan, Li, Shintani and Lambert2020; Long, Reference Long2015), we hypothesized that students in the TBLT condition would outperform students in the TSLT comparison condition on a TBLA measure, and that they would perform at least equally well on a linguistic knowledge test. Given the exploratory nature of the second research question, we did not make an a priori hypothesis for RQ2.
Method
We collected data for the present quasi-experimental study from two intact Business English classes at a public three-year polytechnical vocational college in Guangzhou, China. Both classes were taught by the same instructor (the third author). As a student in a master’s program in TESOL in China and the U.S., the third author familiarized herself extensively with TBLT at both theoretical and classroom-practice levels. Instruction and data collection took place during student participants’ second and third semesters of college, from March 2020 to December 2020. English was a required subject for all students, and all students were required to take a high-stakes government-mandated English proficiency test (the College English Test Band-4 [CET-4]) during the year of the quasi-experimental intervention.
Participants
Participants in the study were L1 speakers of one or more varieties of Chinese. Learners enrolled in one of two intact L2 English classes prior to the outset of the study (i.e., learners were not assigned to classes by the research team). The two classes were randomly assigned to a comparison condition (n = 40) or an experimental TBLT intervention (n = 40). The sample size in this study was determined primarily by practical constraints, as only two intact classes, each consisting of 40 students, were available at the research site during the intervention period. As a result, an a priori power analysis was not feasible for determining the optimal sample size. The learners were between 19 and 21 years old (experimental group, M = 20, SD = .69; comparison group, M = 20.02, SD = .77), and 12% (n = 9) identified as male. The L2 learners had been studying English for an average of 11.5 years (TBLT, M = 11.33, SD = 1.24; Comparison, M = 12.33, SD = 2.07) in formal primary and secondary schools. Their language proficiency at the outset of the treatment ranged from roughly A2 to B1 on the Common European Framework of Reference (CEFR) scale as measured by a version of the Quick Placement Test (UCLES, 2001), with no statistically significant differences in proficiency between the groups (TBLT, M = 29.85, 95% CI [28.44, 31.26], SD = 4.42; Comparison, M = 27.50, 95% CI [26.00, 29.00], SD = 4.71).
Instructional conditions: curricula, methodology, and implementation
The two groups took part in a two-semester (one academic year, 34 weeks, 128 lessons of 40 minutes) Business English program, which began with 15 weeks of online instruction during the COVID-19 pandemic before transitioning to face-to-face teaching. The shared institutional goal for both groups was to develop the functional English abilities needed for business-related communication. However, the two groups followed distinct curricula and pedagogical approaches. In the TBLT condition, this broad goal was operationalized through a task-based needs analysis (reported in Van Gorp, Guan, & Coss, Reference Van Gorp, Guan, Coss, Gilabert and Malicka2026b), which identified 41 target tasks representing the personal and occupational situations in which students were expected to use English. These target tasks provided the basis for the design and sequencing of the TBLT syllabus, pedagogic tasks, and task-based assessment. The comparison group pursued the same broad institutional goal through the institution’s pre-existing textbook-based curriculum via TSLT methodology. Although both groups addressed broadly similar domains of workplace and business communication, their underlying curricular design, lesson procedures, and orientation toward language learning differed substantially. Both syllabi, one sample speaking lesson, and one writing lesson for both conditions are available on the Open Science Framework (Van Gorp, Coss, Guan, Burton, & Tuzcu, Reference Van Gorp, Coss, Guan, Burton and Tuzcu2026a) (see Syllabi and sample tasks subfolder). We selected speaking and writing lesson plans that were comparable across conditions and that included the same task in both conditions to highlight the different position and role the speaking and writing tasks occupied in the student learning activities for the two conditions. These tasks are referenced in the following sections.
Comparison group (textbook-based TSLT). The comparison group followed the already existing local curriculum built around two textbooks: Century Business English Integrated Course: Foundation II (Dai & Zheng, Reference Dai and Zheng2014) during the first semester and Intercultural Communication for Business (Ma & Pan, Reference Ma and Pan2011) during the second semester. These textbooks emphasize practical workplace communication (semester one) and cross-cultural business (semester two) topics. Semester one was intended to strengthen general listening, speaking, reading, and writing skills with introductory business content, while semester two built on these skills by emphasizing students’ ability to use English for oral communication and pragmatic action in professional contexts, with attention to intercultural business communication. As required by the institutional English program administrators, the instructor focused on vocabulary and grammar instruction, reading comprehension, listening, speaking (role plays, group discussions), short essay writing, and translation in this course. In practice, lessons followed a task-supported PPP sequence in which tasks were used in the practice and production phases of lessons. The teacher first presented new grammar and vocabulary (e.g., inversion structures for formality, contract terminology, polite requests), then guided students through controlled practice activities (multiple-choice or true-false comprehension exercises, sentence transformations, gap-fill exercises, translations, structured dialogues), and finally engaged the students in short role-play tasks or writing tasks in which the taught forms were applied. The textbook for the second semester focused on cross-cultural communication, cultural business customs, and intercultural business negotiation, addressing topics like etiquette, verbal and non-verbal communication, values, gender differences, etc. The textbook put a strong focus on translation and analysis of textbook passages which the teacher supplemented with videos and student whole-class demonstrations. While lesson topics often referenced workplace or intercultural scenarios, they did not center tasks in the TBLT sense. Instead, tasks were used as practice of pre-taught forms rather than as the basis of curriculum, instruction, and assessment.
For example, in writing lessons, students learned grammatical structures (e.g., inversion for emphasis) and email etiquette before composing a short business email that had to include one inversion sentence and adhere to etiquette conventions. In speaking lessons, students listened to and read passages on contract negotiations, answered comprehension questions, practiced target vocabulary, translated key sentences into Chinese, and only in the final stage performed short role plays simulating a buyer–seller exchange. Tasks served primarily as practice vehicles to demonstrate mastery of taught forms, as is the case typically in TSLT pedagogy. Thus, although the syllabus included workplace-relevant content and tasks, the methodology remained form-focused and accuracy-oriented, distinguishing it from task-based instruction.
TBLT group (task-based syllabus). In contrast, the intervention group followed a newly developed TBLT syllabus. Following internationally recognized scholarship in TBLT, the curriculum was designed by the third author in collaboration with the first author through a task-based needs analysis (Long, Reference Long2005, Reference Long2015) (reported in Van Gorp et al., Reference Van Gorp, Guan, Coss, Gilabert and Malicka2026b). The needs analysis utilized questionnaires, interviews, and focus groups with students, teachers, and business-domain experts to identify 41 authentic target tasks relevant to the students’ personal and occupational domains. These target tasks were then used as the basis for pedagogic tasks adapted to learners’ proficiency and the classroom context. The pedagogic tasks met Ellis and Shintani’s (Reference Ellis and Shintani2014) four task criteria—focus on meaning, an information or opinion gap, reliance on learners’ own resources, and a clearly defined communicative outcome—while also providing opportunities for feedback and focus on form.
To form the yearlong syllabus, these tasks were sequenced by thematic coherence and task complexity, informed by Robinson’s (Reference Robinson and Robinson2011) Triadic Componential Framework. The first semester targeted personal-domain tasks (e.g., introducing oneself, making a hotel reservation, seeing a doctor), while the second focused on occupational tasks (e.g., developing business relations, promoting products, providing customer service, conducting a sales pitch). Within each lesson, instruction adopted the three-stage task cycle (pre-task, task, post-task) described by Willis and Willis (Reference Willis and Willis2007). Students first engaged in input and planning activities (e.g., analyzing model texts, watching authentic product-pitch videos, brainstorming persuasive strategies), then performed the main task collaboratively (e.g., drafting an email to a potential client, presenting a product to foreign buyers at a simulated trade fair), and concluded with post-task reflection and form-focused feedback. Unlike the TSLT condition, attention to form occurred reactively or incidentally during task performance and was reinforced afterward, often in response to teacher-observed errors or gaps during students’ task performance.
Curricular vs. methodological distinction. Both conditions addressed similar business English content domains but differed fundamentally in the organization of instruction. To illustrate, consider the business email writing unit. In the TBLT group, students analyzed authentic samples, brainstormed expressions for polite requests, and then drafted and revised emails to potential clients through multiple cycles of peer and teacher feedback, with the communicative purpose of securing future business at the center of the lesson. In the TSLT comparison group, students first practiced inversion grammar and textbook email conventions, then wrote a short email that demonstrated their use of these forms, with peer review guided by a checklist (which included the use of the inversion structure). Similarly, in speaking-focused lesson sequences, the TBLT group engaged in extended simulations of a trade fair where they presented products and negotiated with rotating roles, while the TSLT comparison group read textbook passages on business deals, practiced vocabulary, and only then performed brief role plays with scripted prompts. These contrasts exemplify how the distinction between conditions was methodological as well as curricular, with a task-based approach in the intervention condition versus a task-supported approach in the comparison condition.
Implementation fidelity. Implementation fidelity was closely attended to in both course planning and delivery. During the intervention, only limited syllabus adaptations were made reflecting responsive implementation rather than a departure from the task-based syllabus. For example, in the first online semester, Tasks 2 and 3 were repeated after Task 20 because the instructor observed that students had not fully mastered these earlier tasks, yet their content was needed for subsequent task performance. In addition, as the instructor noticed that initially students showed resistance to engaging in online group work, an interaction-heavy task (Task 4) scheduled early in Semester 1 was moved to the beginning of Semester 2, when face-to-face teaching resumed.
The same instructor taught both groups, ensuring comparability of teaching style and classroom management. Teacher logs documented some implementation and especially classroom management challenges in the first semester of the TBLT group (e.g., not always enough time for post-task phase, slow transitions from whole class to group work). These issues occurred primarily during the initial quarter of the semester (March 2020); from Lesson 10 onward (early April 2020), lessons proceeded as intended, and in the second semester both conditions were implemented fully according to plan. Fidelity was documented through additional sources beyond teacher reflection logs, including email correspondence with the first author (who guided the curriculum design), lesson recordings, and learners’ post-task surveys. The email correspondence captured ongoing guidance on pedagogical dilemmas, teaching decisions, and the extent to which lessons preserved authentic task-based practice. Although reflection logs, lesson recordings, emails, and post-task surveys were not analyzed as data sources in the present study, they served as supplementary documentation of implementation fidelity.
Instructor-as-researcher role. The third author served as the instructor for both groups and, in her researcher role, contributed to the needs analysis, curriculum design, and documentation of the two conditions. This dual role reflected the practitioner-led nature of this study and the limited institutional and research resources available. The project emerged from her interest in exploring whether TBLT could address Chinese EFL learners’ persistent difficulties in developing communicative competence despite years of formal English instruction (Hu, Reference Hu2005). Because this study was designed with the hypothesis that the TBLT condition would yield stronger outcomes, we acknowledge that this dual role may have introduced potential expectancy effects as a limitation; it is possible that the instructor’s enthusiasm or commitment to the intervention could have unintentionally influenced instructional delivery. However, having the same instructor teach both groups helped control instructor-related differences in teaching style, classroom management, pacing, feedback, rapport with students, contextual familiarity, and responsiveness to learner difficulties. Furthermore, avoiding variance introduced by an instructor-pedagogy confound has been highlighted in TBLT scholarship as a core design feature of high-quality comparative studies (Shintani, Reference Shintani2020). The instructor sought to provide comparable guidance and support across conditions. As a novice teacher, she was invested in supporting students in both groups, including the comparison group, where students’ silence and passive learning prompted reflection on adaptive strategies to motivate and engage them, such as diversifying classroom activities, adding occasional competitive elements, and using short theme-related videos as lesson warm-ups, without altering the textbook-based TSLT curriculum. This dual role and its potential limitations are therefore considered when interpreting the findings.
Assessment instruments
All students completed three complementary measures of language development: (a) a freely available version of the Quick Placement Test (QPT) (UCLES, 2001), a discrete-point multiple-choice test of English lexicogrammar knowledge, (b) a monologic task-based speaking assessment (TBLA), and (c) the official government-mandated Chinese English Test Band Four (CET-4), which did not include a speaking section.
Language Proficiency Assessment. For reasons of practicality, we used the freely available pen-and-paper Quick Placement Test Version 1 (UCLES, 2001)Footnote 1 to measure linguistic knowledge. The Quick Placement Test (QPT) is “a flexible test of English language proficiency developed by Oxford University Press and Cambridge ESOL to give teachers a reliable and time-saving method of finding a student’s level of English” (Geranpayeh, Reference Geranpayeh2003, p. 8). The QPT is a 60-item multiple-choice test, using gap-filling cloze and sentence-level exercises, which focuses on lexis and grammar, with test-score interpretations ranging from below A1 to C2 on the CEFR (Geranpayeh, Reference Geranpayeh2003). The QPT is a curriculum-independent placement test and screening examination, the use of which provides a standardized external benchmark that is not tied to the specific instructional materials used in either group. The same version of the QPT was administered as a pre-test before the beginning of semester one (January 2020) and as a post-test at the end of semester two (December 2020). All QPTs were administered face-to-face, with QPT1 completed before the COVID-19 lockdown.
Task-Based Assessments. The task-based assessment was a monologic speaking task with a clear communicative purpose. Presenting products and services through a sales pitch was one of the occupational target tasks identified in the needs analysis. We selected it because it was broadly relevant to the students’ anticipated business communication contexts and elicited an extended individual performance that could be administered and scored consistently across groups and measurement occasions. Students were provided with a task sheet in English (see Appendix A) and given one minute to prepare before delivering a two-minute presentation, which was video-recorded. This standardized format supported longitudinal comparison; however, we acknowledge that a single monologic task captures only part of learners’ communicative ability.
The same sales-pitch assessment task was administered three times: at the beginning of semester one (March 2020), the end of semester one (June 2020), and the end of semester two (December 2020). The pre-test was conducted online due to COVID-19 restrictions, whereas Post-test 1 and Post-test 2 were conducted face-to-face. In both groups, students encountered a product-pitching task that was similar to the assessment task (though with different content) once in their respective syllabi. In the TSLT condition, this occurred before the first post-test (at the end of semester 1), whereas in the TBLT condition it occurred in the second semester.
To analyze student performance on this assessment task, we collaboratively developed a 7-point analytic rubric with four criteria: task completion, comprehensibility, organization, and language use (see Appendix B for the full rubric). Seven-point scales have been shown to have higher psychometric precision than five or fewer points (Simms, Zelazny, Williams, & Bernstein, Reference Simms, Zelazny, Williams and Bernstein2019). The empty categories for 2, 4, and 6 served as “halfway” points when performances demonstrated some but not all aspects of two adjacent categories with descriptors (in line with operational practice in Cambridge Assessment scales and IELTS). Both test-internal (test purpose and score use) and test-external (existing speaking rubrics and theory/literature) sources informed our scale construction (Knoch, Deygers, & Khamboonruang, Reference Knoch, Deygers and Khamboonruang2021). Considering test purpose and score use, we included a task-specific task completion criterion in addition to three task-independent criteria which were modeled after standardized speaking task rubrics (IELTS, TOEFL, Advanced Placement) as well as recent rubrics from functional adequacy research (e.g., Kuiken & Vedder, Reference Kuiken and Vedder2022). It is important to note that performing well on the task completion criterion required more than simply mentioning the prompts provided in the task instructions. As detailed in our analytic rubric, top scores were awarded only to students who successfully “elaborated beyond the content provided on the task sheet.” After drafting the rubric, we completed four rounds of rater training and consensus building using randomly selected samples from the full dataset, each of which resulted in revisions to the rubric and the scales. Three raters (authors 2, 3, and 5), with varied language backgrounds (English, Chinese, and Turkish as L1s, respectively) and varied experience with teaching L2 learners of English with an L1 Chinese backgroundFootnote 2 (from extensive to none), each independently rated all 240 student performances on the TBLA (40 students × 2 classes × 3 test sessions). The order of the 240 test samples was randomized for each rater.
The CET-4. As described in Jin (Reference Jin, Lily, Su, Weir and Wu2019), “the CET is an exit test to assess the English language proficiency of tertiary-level learners upon their completion of the College English program” (p. 101). This test is generally administered to students in their fourth semester of college, after they have completed the first four levels of the College English curriculum. The CET-4 is made up of four parts, taking “a componential view of the construct of language proficiency, assessing language skills independently” (Jin, Reference Jin, Lily, Su, Weir and Wu2019, p. 104). The test contains sections for listening, reading, translation, and writing. Each section is given a score, and the composite score on the whole test ranges from 290 to 710. The passing score is 425. We included CET scores in this analysis because this was the test with the most published validity evidence available in our dataset, all test takers were required to take it during this intervention, and it is a high-stakes, locally meaningful test, and therefore consequential when evaluating the viability of TBLT in this context. Furthermore, it served as a covariate in our models to account for variance attributable to underlying proficiency; that is, to more appropriately model the trajectories of the outcome variables.
Because the CET-4 was administered just two weeks into the second semester (September 16, 2020),Footnote 3 the scores primarily reflect students’ underlying English proficiency developed prior to the intervention and during the first semester. This timing was methodologically appropriate for our study, as the CET-4 was utilized as a covariate in our statistical models to control for baseline proficiency rather than as a summative outcome measure. However, we acknowledge that this early administration timing limits the extent to which the CET-4 scores reflect the full impact of the two-semester intervention. It is entirely possible that a later administration at the end of the second semester might have yielded different results, potentially capturing further divergence in language ability between the instructional conditions.
Data analysis
To answer how instructional groups compared on a linguistic knowledge test (RQ1), we analyzed QPT scores prior to starting the course (pre-test) and at the end of the course (post-test). Internal consistency was below operational range for the two administrations (α Pretest = .54, α Posttest = .56), likely because the restricted range of ability among the learners attenuated this estimate. To ensure our test scores were as meaningful as possible, we ran additional quality assurance checks on the test items, reported in Appendix C. We were satisfied with the quality of the items, and because our focus was on total scores (an aggregated sum of all 60 items), rather than item-level inferences, we used the QPT for analysis.
We calculated the dependent variable as total test scores out of 60 possible correct responses with no weighted items. We conducted a 2 × 2 factorial ANOVA to investigate the effects of the task intervention on language ability as measured with the QPT. We used the aov function in R (v.4.3.2) to account for both within- and between-person effects. We specified repeated measurements in the model using the syntax Score~Class*Time+Error(ID). The outcome measure was the test scores, and the independent variables were group membership (Comparison vs. Experimental) and time. We calculated effect sizes using eta squared rather than partial eta squared (Norouzian & Plonsky, Reference Norouzian and Plonsky2018) using the eta_squared function (effectsizes package v.0.8.9). Despite the presence of one outlier, the assumptions for the statistical model were met. Test scores for each group at each time were distributed normally with non-significant Shapiro-Wilk tests (ps = .29, .29, .27, .12). Levene’s test for the homogeneity of variance held across both instructional groups, F(1, 158) = 0.02, p = .89, and test time, F(1, 158) = 0.01, p = .94. Sphericity was not applicable in this design since the study involved only two time points, and observations were independent across participants.
To answer how the instructional groups compared on the task-based speaking assessment, we followed two main steps. First, we confirmed that the scoring mechanism for the task-based language assessment (TBLA) was psychometrically robust prior to using any of the data in any inferential models. Robustness, reported in Appendix C, was important to confirm for the four scales used in the study as well as rater and test-taker behavior. After confirming that the scales functioned as intended, we ran inferential statistical analyses to determine the relationships between group, time, and the four rated outcomes. Because this dataset consisted of repeated measurements and ordinal values on seven-point scales, we analyzed the outcomes using ordinal mixed-effects regression using clmm in R (v.2023.12-4), with a logit link and flexible thresholds. The first model (RQ1) included all rated outcomes together (an omnibus model), with raters, test takers, and differences in criteria modeled as random effects. This model is roughly equivalent to an explanatory rating scale Many Facet Rasch model. To answer RQ2, we also modeled each rated outcome separately. For the omnibus model and the four separate models, we modeled the interaction between group membership (Comparison × Experimental) and time (three time points). The comparison group and the first administration of the TBLA served as reference values in the model. We included random effects of test taker and rater in the model (and criteria for the omnibus model). We also controlled for the test takers’ language proficiency using their official CET scores as a covariate predictor. We controlled for CET given that mean scores differed slightly between the comparison group, M = 429.58, and the experimental group, M = 436.17, although this difference was not significant in a Welch’s independent samples t-test, t(76.01) = −0.65, p = .52. We calculated model fit based on comparisons of the full model with the null model with no predictors and the model with random effects removed. Effect sizes are reported as odds ratios. Conditional and marginal R2 is reported using Nakagawa’s R 2 (Nakagawa & Schielzeth, Reference Nakagawa and Schielzeth2013), computed in sjPlot (v.2.8.17). We adjusted alpha to 0.01 to account for the five repeated statistical tests (Bonferroni correction).
Assumptions of ordinality and a lack of multicollinearity were met. The assumption of proportional odds was generally met in the models of individual criteria using Brant’s tests (Brant, Reference Brant1990) using the brant package (v.0.3-0) (on models with random effects removed [polr models], as there are no methods to check this assumption for clmm models with random effects). Nonetheless, for our purposes, we were interested in the average odds ratios rather than predicted discrete outcomes, which Harrell (Reference Harrell2020) stated was a less problematic violation. R code for the descriptive and inferential data is available in Van Gorp et al. (Reference Van Gorp, Coss, Guan, Burton and Tuzcu2026a).
Results
QPT results
RQ1 investigated whether learning gains on a discrete language test would be present in both the TBLT and comparison group. Table 1 displays the mean scores for each group at the two testing times. Figure 1 shows the distribution of these trends in both violin and boxplots. Both groups demonstrated a normal distribution around a mean that was roughly 50% of the total test score (30/60) at both time periods, with small differences between groups by experimental condition and at each time point.
Descriptive Statistics for TBLT and Comparison Groups at Times 1 and 2 (QPT)

Table 1. Long description
QPT descriptive statistics are reported for the comparison and experimental groups at two times. At Time 1 (pre-test), the comparison group mean is 27.50, 95% CI [26.00, 29.00], SD 4.71; the experimental group mean is 29.85, 95% CI [28.44, 31.26], SD 4.42. At Time 2 (post-test), the comparison group mean is 30.73, 95% CI [29.36, 32.09], SD 4.26; the experimental group mean is 31.70, 95% CI [30.03, 33.37], SD 5.23.
Violin plots and boxplots of QPT.

Figure 1 Long description
The vertical axis shows QPT scores and the horizontal axis shows Time 1 and Time 2. Red violins represent the control group and blue violins represent the experimental group. Embedded boxplots show medians and interquartile ranges. At Time 1, scores are centered in the high 20s, with the control mean at 27.50 and experimental mean at 29.85. At Time 2, both distributions move upward, with means of 30.73 and 31.70, successively. The distributions moslty overlap at both times, and the between-group difference remains small relative to within-group variation.
A 2 × 2 factorial ANOVA confirmed that there was a significant main effect of time, F(1, 78) = 26.62, p < .001, with η p2 = .25, η 2 = .07, which is a medium effect size (Cohen, Reference Cohen1969). Test scores, regardless of the grouping variable, grew from a mean of 28.7 [27.60, 29.70] in the pre-test to a mean of 31.20 [30.20, 32.20] in the post-test. However, this relationship was not significant for the grouping variable, F(1, 78) = 3.25, p = .08, η p2 = .04, η 2 = .03, or the interaction between group and time, F(1, 78) = 1.96, p = .17, η p2 = .02, η 2 < .001, both with small effect sizes.
TBLA results
Descriptive statistics for the TBLA data are shown in Table 2. Median score values were centered around a score of 4 on the seven-point scale for task completion, comprehensibility, and organization, with interquartile ranges one point above and below each scale and no differences between the comparison and TBLT groups. Language use was rated somewhat more severely, with medians in each group at 3. The comparison group exhibited more variance in language use scores, with interquartile ranges from 2 to 4, while the TBLT group showed more centrality with the ranges from 3 to 4.
Descriptive Statistics of Rating Scale Data

Table 2. Long description
For the comparison group, Task Completion has Q1 3, median 4, Q3 5, SE 0.09; Comprehensibility has Q1 3, median 4, Q3 5, SE 0.08; Organization has Q1 3, median 4, Q3 5, SE 0.07; and Language Use has Q1 2, median 3, Q3 4, SE 0.06. For the experimental group, Task Completion has Q1 3, median 4, Q3 5, SE 0.09; Comprehensibility has Q1 3, median 4, Q3 5, SE 0.07; Organization has Q1 3, median 4, Q3 5, SE 0.07; and Language Use has Q1 3, median 3, Q3 4, SE 0.06. Q1 and Q3 are shown as the first and third quartiles for these variables.
Note: Median and first (Q1) and third (Q3) interquartile ranges are reported for ordinal variables.
In terms of rater reliability (further discussed in Appendix C), the rater separation statistic indicated that raters differed in their severity but in a very narrow range. We inspected these differences further by calculating Krippendorff’s Alpha (a measure of agreement among raters on ordinal scores while taking into account chance agreements), which was .69. Both statistics suggest that exact agreement was only medium. However, we estimated the effect that these differences might bias any findings by decomposing the intraclass correlation coefficient (ICC) by raters. ICC indicated that rater effects accounted for only 1% of total score variance (ICCRATER = .01), suggesting that while raters could be statistically distinguished, systematic severity differences were negligible in magnitude.
Table 3 shows the polychoric correlations among the rated scales. The lowest correlation was between task completion and comprehensibility (.43), while language use and organization correlated the strongest (.78). Overall, language-related elements tended to correlate more strongly together than with task completion.
Polychoric Scale Correlations

Table 3. Long description
All six pairwise correlations are positive. Task Completion correlates 0.43 with Comprehensibility, 0.70 with Organization, and 0.58 with Language Use. Comprehensibility correlates 0.70 with Organization and 0.65 with Language Use. Organization and Language Use have the strongest correlation, 0.78.
Four Outcome (Omnibus) Model. The omnibus model of all four outcomes (rubric criteria) modeled together is shown in Table 4. Both the interaction between group and time and their main effects were significant predictors in this model, with odds ratios ranging from 2.81 to 4.80. The strongest effect of the model was the interaction between the TBLT group and the final test, in which being in the TBLT group led to scores being 4.80 times more likely to be higher than the comparison group. The covariate of CET score had little predictive effect on the model, odds ratio = 1.04. Nakagawa’s marginal R 2 was .22 and conditional R 2 was .53, indicating that the predictors and random effects explained 53% of the variance and the predictors alone explained 22% of the variance on the latent scale. The intraclass correlation coefficient (ICC) was .41, indicating that approximately 41% of the total variance in scores was attributable to group-level clustering. Variance in the random effects was small for raters, indicating only small differences in scoring patterns. Criterion variance showed that the four outcomes did not behave uniformly. The interaction between group and time is visualized in Figure 2.
Model of All Outcomes

Table 4. Long description
Fixed effects are reported as b, 95% CI, SE, z, p, odds ratio (OR), and OR 95% CI. TBLT: b -0.29, CI [-0.93, 0.36], SE 0.33, z -0.86, p .39, OR 0.75, OR CI [0.39, 1.44]. Time 2: b 1.03, CI [0.80, 1.27], SE 0.12, z 8.54, p < .001, OR 2.81, OR CI [2.22, 3.56]. Time 3: b 1.31, CI [1.07, 1.55], SE 0.12, z 10.65, p < .001, OR 3.71, OR CI [2.92, 4.73]. CET: b 0.04, CI [0.02, 0.06], SE 0.01, z 4.51, p < .001, OR 1.04, OR CI [1.02, 1.06]. TBLT by Time 2: b 1.00, CI [0.67, 1.33], SE 0.17, z 5.89, p < .001, OR 2.72, OR CI [1.95, 3.80]. TBLT by Time 3: b 1.57, CI [1.22, 1.91], SE 0.17, z 9.04, p < .001, OR 4.80, OR CI [3.41, 6.74]. Random-effect variance and SD are 0.07 and 0.27 for raters, 1.87 and 1.37 for test takers, and 0.31 and 0.56 for criteria. TBLT corresponds to the experimental group, and an asterisk (*) indicates p < .01.
Note: TBLT = experimental group. b = standardized regression coefficient, 95% CI = 95% confidence interval, SE = standard error, z value = z-statistic, OR = odds ratio, *p < .01.
Model of All Scores (Omnibus Model).

Figure 2. Long description
The vertical axis is the seven-point rating scale for all four scores, and the horizontal axis shows Times 1, 2, and 3. Individual observations are plotted as red and blue points. The red solid control line and blue dashed experimental line begin near 4 at Time 1. By Time 2, the control estimate is about 4.6 and the experimental estimate about 5.1; by Time 3, they are about 4.8 and 5.6. The widening separation shows the positive group-by-time interaction, strongest at Time 3.
Task Completion. The final model of task completion is shown in Table 5. Both the interaction between group and time and their main effects were significant predictors of this outcome, with odds ratios ranging from 5.30 to 15.51. The strongest effect of the model was the interaction between the TBLT group and the final test, in which being in the TBLT group led to scores being 15.51 times more likely to be higher than the comparison group. The covariate of CET score had little predictive effect on the model, odds ratio = 1.04. Nakagawa’s marginal R 2 was .27 and conditional R 2 was 0.70, indicating that the fixed effects explained a reasonable amount of variance in task completion, with the random effects accounting for most of the variance (ICC = .59). Variance in the random effects was greater for test takers than raters, and of the four outcomes, residual variance in raters was highest for task completion, indicating larger between-rater differences than other outcomes. The interaction between group and time is modeled in Figure 3.
Model of Task Completion

Table 5. Long description
Fixed effects are reported as b, 95% CI, SE, z, p, odds ratio (OR), and OR 95% CI. TBLT: b -0.85, CI [-1.82, 0.12], SE 0.50, z -1.71, p .09, OR 0.43, OR CI [0.16, 1.13]. Time 2: b 1.93, CI [1.42, 2.45], SE 0.26, z 7.34, p < .001, OR 6.90, OR CI [4.12, 11.55]. Time 3: b 1.67, CI [1.15, 2.17], SE 0.26, z 6.49, p < .001, OR 5.30, OR CI [3.20, 8.78]. CET: b 0.04, CI [0.02, 0.07], SE 0.01, z 3.23, p .001, OR 1.04, OR CI [1.02, 1.07]. TBLT by Time 2: b 1.62, CI [0.92, 2.32], SE 0.36, z 4.54, p < .001, OR 5.05, OR CI [2.51, 10.16]. TBLT by Time 3: b 2.74, CI [2.02, 3.46], SE 0.37, z 7.47, p < .001, OR 15.51, OR CI [7.56, 31.85]. Random-effect variance and SD are 0.99 and 0.99 for raters and 3.67 and 1.91 for test takers. An asterisk indicates p < .01.
Note: b = standardized regression coefficient, 95% CI = 95% confidence interval, SE = standard error, z value = z-statistic, OR = odds ratio, *p < .01.
Model of Task Completion.

Figure 3. Long description
The vertical axis is the seven-point Task Completion scale, and the horizontal axis shows Times 1, 2, and 3. Translucent points show individual ratings; gray bands show uncertainty. At Time 1, the red solid control estimate is about 4.1 and the blue dashed experimental estimate about 3.5. At Time 2, both go up to about 5.0 for control and 5.5 for experimental. At Time 3, control remains near 4.9 while experimental goes up to about 5.8. The crossings and widenings are strong group-by-time interactions, especially at Time 3.
Comprehensibility. The final model of comprehensibility is shown in Table 6. Only the main effects of time and CET were significant predictors in this model, with odds ratios ranging from 1.03 to 3.99. The strongest effect of the model was the effect of time, showing that compared to time 1, all test takers were 4 times more likely to improve on comprehensibility regardless of their instructional condition. The covariate of CET score had little predictive effect on the model, odds ratio = 1.03. Nakagawa’s marginal R 2 was .14 and conditional R 2 was .47, indicating that the fixed effects explained a smaller amount of variance for comprehensibility than task completion on the latent scale, with the random effects of the grouping variables accounting for substantial variance (ICC = .39). Variance in the random effects of raters was negligible (.05), showing high consistency. The model is visualized in Figure 4.
Model of Comprehensibility

Table 6. Long description
Fixed effects are reported as b, 95% CI, SE, z, p, odds ratio (OR), and OR 95% CI. TBLT: b 0.40, CI [-0.39, 1.94], SE 0.40, z 1.00, p .32, OR 1.50, OR CI [0.68, 3.30]. Time 2: b 0.76, CI [0.30, 1.25], SE 0.24, z 3.21, p .001, OR 2.17, OR CI [1.35, 3.49]. Time 3: b 1.38, CI [0.90, 1.87], SE 0.25, z 5.63, p < .001, OR 3.99, OR CI [2.46, 6.46]. CET: b 0.03, CI [0.01, 0.05], SE 0.01, z 2.92, p .004, OR 1.03, OR CI [1.01, 1.05]. TBLT by Time 2: b 0.12, CI [-0.53, 0.78], SE 0.34, z 0.37, p .71, OR 1.13, OR CI [0.59, 2.19]. TBLT by Time 3: b 0.53, CI [-0.14, 1.20], SE 0.34, z 1.56, p .12, OR 1.70, OR CI [0.87, 3.32]. Random-effect variance and SD are 0.05 and 0.23 for raters and 2.06 and 1.43 for test takers. An asteriks indicates p < .01.
Note: b = standardized regression coefficient, 95% CI = 95% confidence interval, SE = standard error, z value = z-statistic, OR = odds ratio, *p < .01.
Model of comprehensibility.

Figure 4. Long description
The vertical axis is the seven point comprehensibility scale, and the horizontal axis shows Times 1, 2, and 3. The red solid control trajectory rises from about 4.2 at Time 1 to 4.7 at Time 2 and 5.0 at Time 3. The blue dashed experimental trajectory rises from about 4.5 to 5.1 and 5.7. Both groups improve over time. The experimental line remains higher, but the model reported significant effects of time and CET but no significant TBLT-by-time interactions.
Organization. The final model of organization is shown in Table 7. Both the interaction between group and time and their main effects were significant predictors of this outcome, with odds ratios ranging from 2.34 to 17.41. The strongest effect of the model was the interaction between the TBLT group and the last test, in which being in the TBLT group led to scores being 17.41 times more likely to be higher than the comparison group. The covariate of CET score had little predictive effect on the model, odds ratio = 1.05. To calculate R 2, the near 0 residual variance of rater after accounting for fixed effects caused a singularity issue; thus, variance was estimated with the random effect removed: Nakagawa’s marginal R 2 was .35 and conditional R 2 was .65, indicating that the fixed effects explained a large amount of variance for organization on the latent scale, with the random effects of the grouping variable accounting for substantial variance (ICC = .46). The interaction between group and time is modeled in Figure 5.
Model of Organization

Table 7. Long description
Fixed effects are reported as b, 95% CI, SE, z, p, odds ratio (OR), and OR 95% CI. TBLT: b -0.92, CI [-1.81, -0.03], SE 0.46, z -2.02, p .04, OR 0.40, OR CI [0.16, 0.97]. Time 2: b 0.85, CI [0.35, 1.35], SE 0.25, z 3.36, p < .001, OR 2.34, OR CI [1.43, 3.85]. Time 3: b 1.52, CI [1.02, 2.04], SE 0.26, z 5.86, p < .001, OR 4.60, OR CI [2.76, 7.66]. CET: b 0.06, CI [0.04, 0.08], SE 0.01, z 5.14, p < .001, OR 1.05, OR CI [1.04, 1.09]. TBLT by Time 2: b 2.23, CI [1.51, 2.94], SE 0.36, z 6.11, p < .001, OR 9.26, OR CI [4.54, 18.91]. TBLT by Time 3: b 2.85, CI [2.12, 3.59], SE 0.37, z 7.65, p < .001, OR 17.41, OR CI [8.37, 36.19]. Random-effect variance and SD are both below 0.01 for raters and are 2.82 and 1.68 for test takers. An asterisk indicates p < .01.
Note: b = standardized regression coefficient, 95% CI = 95% confidence interval, SE = standard error, z value = z-statistic, OR = odds ratio, *p < .01.
Model of organization.

Figure 5. Long description
The vertical axis is the seven point organization scale, and the horizontal axis shows Times 1, 2, and 3. At Time 1, the red solid control estimate is about 4.3 and the blue dashed experimental estimate about 3.9. At Time 2, control rises to about 4.7 while experimental goes up to about 5.3. At Time 3, control is about 5.0 and experimental about 5.9. The experimental trajectory crosses the control trajectory and then separates. This shows the strong positive group-by-time interactions.
Language Use. The final model of language use is shown in Table 8. Only the interaction between instructional group and Time 3 was significant, as well as the main effects of time. Odds ratios ranged from 2.82 to 3.93. The strongest effect of the model was the interaction between the TBLT group and the final test, in which being in the TBLT group led to scores being 3.93 times more likely to be higher than the comparison group. The covariate of CET score had little predictive effect on the model, odds ratio = 1.06. Nakagawa’s marginal R 2 was .26 and conditional R 2 was .55, indicating that the fixed effects explained a sizeable amount of variance for language use on the latent scale, with the random effects of test takers accounting for substantial variance (ICC = .39). The interaction between group and time is modeled in Figure 6.
Model of Language Use

Table 8. Long description
Fixed effects are reported as b, 95% CI, SE, z, p, odds ratio (OR), and OR 95% CI. TBLT: b -0.09, CI [-0.89, 0.72], SE 0.41, z -0.21, p .83, OR 0.92, OR CI [0.41, 2.04]. Time 2: b 1.04, CI [0.54, 1.53], SE 0.25, z 4.09, p < .001, OR 2.82, OR CI [1.72, 4.64]. Time 3: b 1.31, CI [0.80, 1.81], SE 0.26, z 5.06, p < .001, OR 3.70, OR CI [2.23, 6.14]. CET: b 0.06, CI [0.04, 0.08], SE 0.01, z 5.34, p < .001, OR 1.06, OR CI [1.04, 1.08]. TBLT by Time 2: b 0.73, CI [0.04, 1.43], SE 0.35, z 2.07, p .04, OR 2.08, OR CI [1.04, 4.15]. TBLT by Time 3: b 1.37, CI [0.66, 2.07], SE 0.36, z 3.81, p < .001, OR 3.93, OR CI [1.94, 7.96]. Random-effect variance and SD are 0.05 and 0.22 for raters and 2.04 and 1.43 for test takers. An asterisks indicates p < .01.
Note: b = standardized regression coefficient, 95% CI = 95% confidence interval, SE = standard error, z value = z-statistic, OR = odds ratio, *p < .01.
Model of language use.

Figure 6. Long description
The vertical axis is the seven point Language Use scale, and the horizontal axis shows Times 1, 2, and 3. Both the red solid control line and blue dashed experimental line begin near 3.7 at Time 1. At Time 2, control is about 4.1 and experimental about 4.4. At Time 3, control is about 4.3 and experimental about 4.8. Both groups improve, and the gap is largest at Time 3. This corresponds to the significant TBLT-by-Time 3 interaction.
Discussion
In this study, we examined the extent to which a strong-form TBLT approach would lead to stronger task-based speaking performance and equivalent or better linguistic gains compared to a task-supported language course focused on vocabulary and grammar. Given that past research has generally either measured outcomes on a linguistic knowledge assessment or a task-based assessment but not both (Boers & Faez, Reference Boers and Faez2026), we were interested in how the two measures would compare, as there is a risk in assuming that different assessment methods provide equivalent evidence of language development (Bachman, Reference Bachman2002). In addition, by using two complementary outcome measures, we aimed to evaluate TBLT’s role in supporting both communicative competence and explicit linguistic knowledge development. Furthermore, we explored how changes in students’ task completion ability—a central criterion in strong-form TBLT/A—compared to growth on linguistic and textual dimensions of language performance. In doing so, the study contributes to a better understanding of the robustness and instructional relevance of different performance criteria in task-based assessment. This study is novel in its use of a longer-term longitudinal design, which lasted the course of an academic year, and its use of both task-based and explicit linguistic knowledge assessments. Crucially, this investigation was carried out in a high-stakes-test-oriented East Asian tertiary educational setting, an environment often seen as an impediment to the successful implementation of TBLT.
To answer our first research question, we examined students’ performance on a task-based speaking assessment and on the Quick Placement Test (QPT), a test of linguistic knowledge, to address how TBLT students perform compared to TSLT students. Our findings indicate that the TBLT group significantly outperformed the comparison group on the speaking task at the end of both first and second semesters. This result aligns with expectations (Ellis et al., Reference Ellis, Skehan, Li, Shintani and Lambert2020; Long, Reference Long2015) and prior research by González-Lloret and Nielson (Reference González-Lloret and Nielson2015) (see also Ganjouee et al., Reference Ganjouee, Ghonsooly and Fatemi2018), as the TBLT course emphasized speaking and communicative competence in real-world workplace-related tasks. The work-related speaking task as a focal outcome measure might explain the differences between our findings and González-Lloret and Nielson’s (Reference González-Lloret and Nielson2015) findings with Harris and Leeming’s (Reference Harris and Leeming2022) and Pomarolli et al. (Reference Pomarolli, Artoni, Boschiero and Piccinin2023) findings, who reported that both TBLT and non-TBLT (i.e., PPP in their two studies) were equally effective in supporting speaking development. The Harris and Leeming (Reference Harris and Leeming2022) study used a speaking assessment procedure that was almost identical to our procedure, but, like Pomarolli et al. (Reference Pomarolli, Artoni, Boschiero and Piccinin2023), focused on everyday-life content and used typical classroom speaking assignments with no stated audience or communicative purpose (cf. Norris, Reference Norris2016). The ability of TBLT students in our study to successfully complete real-world communicative tasks supports TBLT’s pedagogical philosophy, which prioritizes authentic task performance as the driver of language development (Long, Reference Long2015).
Interestingly, on the vocabulary and grammar test (the QPT), the TBLT group performed comparably to the comparison group, despite the latter receiving two semesters of explicit grammar and vocabulary instruction, while the TBLT group’s language instruction was limited to reactive focus on form (Long, Reference Long, Lambert and Shohamy2000). This suggests that although the TBLT program did not explicitly focus on lexical and grammatical knowledge, TBLT still facilitated the acquisition of these domains of L2 knowledge to a similar degree as a structural syllabus. This finding is also in line with González-Lloret and Nielson’s (Reference González-Lloret and Nielson2015) findings. Although the scores only represented an overall 3–4 point gain on the QPT (out of 60 total possible points), this represents progress of approximately half a skill level between B1 and B2 on the CEFR (Geranpayeh, Reference Geranpayeh2003), which is in line with language development trends in similar classroom-based contexts.
A key observation from our longitudinal mixed-effects regression analyses is that students showed the most substantial improvement between their first and second speaking assessments (i.e., the first semester), with sustained but more moderate gains in the second semester. This pattern is in line with Harris and Leeming’s (Reference Harris and Leeming2022) findings. They not only found a differential outcome between the TBLT and PPP groups, but also found that the growth curve (i.e., slope) between Time 1 and Time 2 was much steeper than the slope between Time 2 and Time 3 in the TBLT group, with the PPP group showing the opposite pattern. In contrast, our comparison group showed more consistent growth (i.e., a more consistent slope across time). The growth pattern of the TBLT group suggests that the initial exposure to communicative tasks and feedback played a substantial role in immediate language gains, while continued improvements reinforced long-term benefits of TBLT, contrary to Harris and Leeming’s (Reference Harris and Leeming2022) findings where their TBLT and PPP groups turned out to be equally effective over a similar two-semester timeframe. Two additional possible contributors to the relatively stronger growth during semester one versus semester two for the TBLT group could be (a) the fact that the TBLA closely resembled the format of the speaking tasks throughout the TBLT course (and thus possibly contributed to students’ confidence, positively impacting performance) and/or (b) the novelty of the TBLT approach enhancing students’ motivation to perform well, given that their past L2 learning experience had not included TBLT pedagogy. Overall, the findings for RQ1 aligned with our hypotheses, supporting the argument that task-based instruction enhances both task-specific language performance and other dimensions of linguistic competence.
An interesting question emerges as to why the TSLT group, whose instruction focused primarily on discrete language knowledge, did not substantially outperform the TBLT group on measures of explicit linguistic knowledge (the QPT and the CET-4). As our data do not isolate specific mechanisms, we can only speculate about underlying reasons. It may be that the TBLT syllabus, organized around tasks rather than language, provided more robust grounds for interleaved use of language, which has been shown to result in more robust long-term retention than massed, focused “practice” (Rogers, Reference Rogers2017; Suzuki, Reference Suzuki2023). Additionally, there may be a motivational component to these longitudinal results: if the TSLT group consistently felt exceedingly challenged or discouraged by the language-based, accuracy-focused curriculum, this might have led to decreased engagement and, over time, less retention of language knowledge, and thereby lower-than-expected test performance.
Task completion and other (analytic) assessment criteria (A “linguistic caboose”)
Our second research question examined the relationship between the four rated TBLA outcomes (task completion and other criteria), the instructional group and the interaction between group and time. The analyses showed that at both Times 2 and 3 the TBLT group outperformed the comparison group on task completion and organization; a clear indication that the TBLT group was more adept at expanding upon basic prompts with original information. With respect to the language use criterion, the TBLT group outperformed the comparison group only at Time 3 (i.e., the end of the course). There was no difference between the TBLT group and the comparison group on the comprehensibility of the speaking performances. The TBLT course made an impact on speaking performance (marginal R 2 = .22) overall, but especially in terms of task completion (marginal R 2 = .27) and organization (marginal R 2 = .35), which it impacted the most over time. The TBLT intervention facilitated the development in language use over time, moderately, and it did not differentially improve comprehensibility scores, as everyone improved on this criterion.
These results revealed a pattern consistent with the overall TBLA results: raters’ judgment of task completion aligns well with the overall quality of speaking performances, as evidenced by the organization and language use criteria. Because this systematic relationship suggests that growth in task completion mirrors growth in language use, practitioners can make more informed decisions regarding the inclusion and weighting of language-use criteria based on specific assessment purposes. For summative TBLAs (i.e., “target tasks”, Long, Reference Long2015), practitioners might confidently rely on holistic task completion as the primary, heavily weighted criterion; this reliably reflects overall language development and minimizes the potential negative washback of a “linguistic caboose”—where an over-emphasis on discrete language forms risks shifting attention away from the task as the unit of analysis (Long, Reference Long2015). However, because task completion alone does not fully account for the complexity of language development and may obscure key linguistic strengths and weaknesses (Norris, Brown, Hudson, & Yoshioka, Reference Norris, Brown, Hudson and Yoshioka1998), there is likely a time and place for more detailed assessments. To effectively align assessment practices with instructional goals (Norris & East, Reference Norris, East, Ahmadian and Long2021), practitioners can intentionally include specific language-use criteria alongside task completion to pinpoint areas for targeted diagnostic feedback and to identify students who need individual support when using assessments for formative purposes. Ultimately, determining how and when to balance holistic task completion with analytic language criteria remains a ripe area for further TBLT and TBLA research.
Interestingly, while the TBLT group initially lagged behind in language use, by the third measurement point, they had surpassed their non-TBLT peers. This finding may be an indication that the students were getting used to a new methodology, or that they were differentially impacted by the type of instruction (Spada & Tomita, Reference Spada and Tomita2010). In Qi’s (Reference Qi2023) study, the TSLT group did make more noticeable attempts to use new grammar structures than the TBLT group. In contrast, the TBLT group showed an advantage, although not a statistically significant advantage, on grammar knowledge tests. As we did not analyze the learners’ performances in terms of complexity, accuracy, fluency, or specific linguistic structures, we cannot provide a clearer idea of why the TBLT group lagged behind in the present study. Given that task-based instruction devotes less time to explicit L2 learning, lexicogrammatical development may emerge at a more gradual pace compared to a structure-based course. Nevertheless, our results suggest that students in the task-based course developed the necessary textual and grammatical knowledge (Bachman & Palmer, Reference Bachman and Palmer2010) to deliver increasingly coherent and structured spoken performances, at least as measured in the present study’s TBLA. Although the TBLT group and the comparison group performed similarly on discrete lexicogrammar items in the QPT—that is, the TBLT group did not perform significantly differently than the comparison group—the TBLT students demonstrated a greater ability to integrate this knowledge into spoken communication, demonstrating the dual benefits of TBLT.
Interestingly, despite the overall success of TBLT, comprehensibility showed a different pattern compared to other assessment criteria. Although TBLT students consistently received slightly higher comprehensibility ratings, the difference was not statistically significant. Similar findings have been reported in González-Lloret and Nielson (Reference González-Lloret and Nielson2015) and studies on L2 pronunciation gains (e.g., Saito, Reference Saito2021). Given that pronunciation improvements are often linked to explicit phonetic instruction, it is possible that neither instructional approach, as implemented, provided a sufficient pronunciation focus. In addition, it must be acknowledged that a single monologic task might not be the most appropriate speech elicitation instrument to assess comprehensibility, and that task complexity is likely to affect the comprehensibility of speech (Crowther & Isbell, Reference Crowther and Isbell2024). Therefore, gauging comprehensibility, and especially changes in comprehensibility, may require more numerous and varied (e.g., interactive) tasks. Furthermore, we cannot discount the possibility that the change in comprehensibility over time in our results might be a result of practice effects or task repetition (Lambert, Kormos, & Minn, Reference Lambert, Kormos and Minn2017).
High-stakes language testing and TBLT
An additional indicator of TBLT’s effectiveness was students’ performance on the CET-4, a high-stakes standardized English test in China. Given the strong washback effect of the CET-4 on Chinese higher education English curricula (Sun, Reference Sun2016), one might expect the comparison group, whose curriculum was designed to prepare students for this test, to outperform the TBLT group. However, this was not the case. This finding reinforces the argument that proficiency-based, communicative approaches like TBLT can be equally effective, even in test-driven educational environments.
Implications of the study
Theoretical implications. The findings strengthen the theoretical case for tasks as the central unit of curriculum and instruction. Over two semesters, a strong-form TBLT program produced greater development in learners’ ability to complete a relevant communicative task while supporting gains in explicit lexicogrammatical knowledge comparable to those achieved through a form-focused, task-supported curriculum. This pattern suggests that sustained meaning-focused task performance, combined with reactive focus on form, can support both functional language use and the development of linguistic knowledge. At the same time, the differential results across task completion, organization, language use, and comprehensibility indicate that communicative development is multidimensional and that gains associated with TBLT should not be assumed to occur uniformly across all aspects of performance.
Methodological implications. The study illustrates the value of evaluating TBLT as a coherent program rather than as an isolated classroom activity. Connecting needs analysis, syllabus design, implementation, and assessment made it possible to examine the effectiveness of a needs-based strong-form TBLT program under ecologically valid conditions. The longitudinal comparison and use of both a task-based performance assessment and a discrete-point measure also yielded complementary evidence that either measure alone would have missed. Future comparative evaluations should similarly document curricular and methodological contrasts, monitor implementation over time, and employ multiple outcome measures aligned with both communicative and institutional goals.
Pedagogical implications. For practitioners in examination-oriented settings, the findings suggest that organizing instruction around needs-based tasks need not come at the expense of performance on lexicogrammatical measures. A task-based curriculum may therefore help learners develop real-world communicative ability while remaining responsive to institutional testing demands. More generally, the assessment findings suggest that task completion can serve as a practical primary criterion in summative TBLA, whereas analytic criteria such as organization and language use remain valuable for formative feedback and diagnosis—which may be a useful takeaway across diverse contexts that employ TBLA. Curriculum designers should maintain clear alignment among target tasks, classroom pedagogic tasks, and assessments while recognizing that additional tasks and more focused support (e.g., pronunciation instruction) may be needed for improvement along dimensions such as comprehensibility.
Limitations and future research directions
This study has several limitations that should be acknowledged when interpreting findings. First, the study was conducted in an English for Specific Purposes (ESP) context at a higher education institution in China. As a result, the findings may not be directly transferable to other educational settings, such as primary or secondary education within China or EFL settings in other countries. However, the strong similarities between our results and those of González-Lloret and Nielson (Reference González-Lloret and Nielson2015) suggest that, at least in the context of language for specific purposes and adult learning, some generalizability of our findings is plausible.
Second, our design involved a comparison of both curricular and methodological differences (needs-based TBLT vs. textbook-based TSLT), which limits the extent to which instructional methods can be isolated from curriculum. At the same time, this design reflects how these approaches are typically implemented in practice, which enhances the ecological validity of our approach. In addition, a more detailed qualitative analysis of students’ language use and the classroom practices in both the TBLT and TSLT groups would allow for a finer-grained interpretation of our findings. Given that both groups were taught by the same instructor, had the same number of contact hours, and were randomly assigned to condition, many variables in the study were controlled. However, to offer a maximally robust account of TBLT compared to other pedagogical approaches, examining both the products (i.e., language outcomes) and the processes (i.e., pedagogy), including classroom interactions and instructional practices, of both TBLT and the comparison condition is necessary. Furthermore, such an analysis could help establish clearer links between teacher actions and student language learning outcomes (Norris & Davis, Reference Norris, Davis, Ahmadian and Long2021). Teacher logs revealed some implementation challenges in the first semester of the TBLT condition related to instructor inexperience. Although these issues were resolved from lesson 10 onward and both conditions were implemented as intended in the second semester, future research should include a more in-depth study of implementation fidelity, ideally carried out by an external researcher to provide an independent account of how TBLT and TSLT interventions unfold in classroom practice.
Third, TBLA focuses on “the elicitation and evaluation of language use (across all modalities)” (Norris, Reference Norris2016, p. 232). Thus, a broader range of task-based assessments, including varied speaking tasks and integrated skills assessments, is needed to capture L2 development more comprehensively. It is well established that multiple tasks per skill are necessary for making generalizable inferences about a learner’s language performance, as proficiency in one task does not necessarily transfer to another task with different content or complexity (Norris, Reference Norris2016). To fully assess what students learn within a task-based syllabus, future research should examine a more extensive repertoire of language use, incorporating pragmatic competence (Timpe-Laughlin, Reference Timpe-Laughlin, Davis and Norris2024) alongside other linguistic dimensions. To achieve this, future studies should integrate both formative and summative classroom-based assessments throughout the semester, in addition to end-of-semester language tests. Moreover, a stronger alignment between instructional standards, large-scale external exams, and classroom-based task-based assessment practices is essential to accurately describe and promote student learning (Van Gorp, Reference Van Gorp, Long and Ahmadian2022). Strengthening this alignment will contribute to a more robust empirical foundation for TBLT, ensuring its validity and effectiveness in real-world educational settings.
Conclusion
This study is unique in that it demonstrates that TBLT not only fosters students’ ability to engage in real-world communicative tasks but also supports the development of linguistic knowledge, even within test-driven educational contexts. The extended duration of the intervention and the use of multiple assessment measures provide robust evidence that TBLT can outperform structural approaches over time. Furthermore, the growth pattern of task completion mirrored the overall growth pattern and, to a large extent, the growth pattern of the individual linguistic criteria. This opens interesting perspectives for teachers to use task completion as a passkey criterion to gauge quickly and efficiently the overall development of students in their classroom.
These results reinforce calls within the TBLT literature to move beyond short-term interventions by demonstrating the longitudinal comparative effectiveness of strong-form TBLT against task-supported instruction. Furthermore, by evaluating outcomes through both task-based language assessment (TBLA) and discrete-point measures of explicit linguistic knowledge, our findings highlight the necessity of refining assessment practices to capture a comprehensive picture of L2 development. Ultimately, this study positions TBLT as a highly viable pedagogical approach capable of satisfying both the pedagogical goal of building real-world communicative competence and the institutional demands of high-stakes testing environments, such as those in China.
Data availability statement
The experiment in this article earned Open Data and Open Materials badges for transparent practices. The data files are available on https://osf.io/t8dbv/overview.
Acknowledgments
The authors acknowledge the use of ChatGPT-5.5 (OpenAI) during the preparation and revision of this manuscript to improve the clarity and readability of the language. All suggestions generated by the tool were carefully reviewed, edited, and verified by the authors, who take full responsibility for the final content of the manuscript.
Competing interests
The authors declare no competing interests.
Appendix A: task sheet
Speaking Task: A business presentation of a product
Time: 3 minutes
Now, I’m going to give you a business situation and I’d like you to talk about it for 2 minutes.
Before your talk, you’ll have one minute to think about what you are going to say and outline main points you want to make and you can make notes if you wish. Do you understand?
New product presentation sheet.

Table A1. Long description
The table has four sections.
Pros: the phone is foldable, measuring 8 inches unfolded and 6.6 inches folded. SuperCharge reaches 85% in 30 minutes. and it provides faster wireless reverse charging.
Cons: it lacks Google Play services because of the US ban.
Specifications: fingerprint feature, support for 5G, 4G, 3G, and 2G networks, 8 GB RAM, 512 GB storage, and a price of 2,500 euros.
Basic company information: Huawei was established in 1987, supplies products in more than 140 countries, and is subject to the US ban on Huawei products and services.
Situation : You are a sales representative at Huawei Technologies Co., Ltd. Recently your company launched a new smartphone—Huawei Mate Xs (see Table A1). You are asked to give a presentation about the new product to a business client who is from Europe. Your task is to sell the new smartphone, that is, to convince the business client to buy the product for the European market.
Appendix B: speaking task rubric
Speaking task rubric.

Table B1. Long description
Seven-point rubric with ratings for task completion, comprehensibility, organization, and language use. Task completion covers introducing the person and product, at least four strengths or specifications, and price. Higher scores reflect more complete content, easier comprehension, smoother organization, and wider, more accurate language. Score 7 represents full, elaborated completion. Score 5 represents successful completion with all points minimally addressed. Score 3 represents the most points addressed with some listener effort and language or organization problems. Score 1 represents the few points addressed with constant listener effort and severe language or organization problems. Lastly, Score 0 represents being off-task, and mostly or completely incomprehensible response. Score 6 has no descriptor, scores 4 and 2 provide comprehensibility descriptors only.
Appendix C: quality control analyses
QPT analysis
Although the tests were the same across the two time points, the QPT test results exhibited somewhat low internal consistency (α Pretest = .54, α Posttest = .56). We thus conducted a preliminary item-level analysis to confirm that the test functioned as intended in the two administrations. We checked item-level test statistics for the QPT using a 1PL Rasch model for each administration to confirm that the test functioned properly.
We ran a 1PL Rasch model in R. We ran the model on all 60 items. We did not combine all items into one analysis because the test takers’ abilities (thetas) were in flux across the two sessions. The Wright maps are displayed in Figure C1 for Time 1 and Figure C2 for Time 2. R produces these slightly differently from Winsteps. On the left is a histogram of the ability levels of the test takers, and on the right are the difficulty estimates of the items, which are numbered on the x-axis. They roughly get more difficult as the test goes on for all tests. The item-difficulty patterns correlated at .95 for the two administrations. For the test takers, the histograms show a broader spread of ability estimates in the second test administration compared to the first.
Wright map of the QPT data at Time 1.

Figure C1. Long description
Time 1 Wright map. The left side shows a histogram of test-taker ability estimates, and the right side shows difficulty estimates for the 60 QPT items. Items generally become more difficult as the test progresses. The item-difficulty patterns at Times 1 and 2 correlate at .95. Ability estimates are less distributed than at Time 2.
Wright map of the QPT data at Time 2.

Figure C2. Long description
Time 2 Wright map. The left side shows a histogram of test-taker ability estimates, and the right side shows difficulty estimates for the 60 QPT items. Items generally become more difficult as the test progresses. The item difficulty patterns at Times 1 and 2 correlate at .95. Ability estimates are more distributed than at Time 1.
Item infit statistics showed that all items were within Linacre’s (Reference Linacre2002) acceptable bounds of .50 and 1.50 and even Bond and Fox’s (Reference Bond and Fox2015) more conservative range of .75 to 1.3. The plots in Figure C3 show the distribution of the infit values across the two tests. The x-axis contains the 60 individual items and the y-axis identifies the infit statistics.
Item fit distributions.

Figure C3. Long description
A two-panel scatter plot. Both panels share a vertical Y axis labeled Infit Values with increments of 0.25 ranging from 0.50 to 1.50. Horizontal grid lines are present at each increment.
* Left Panel (Time 1): The X axis is labeled Time 1. Approximately 50 black circular data points are plotted. The points are concentrated in a narrow horizontal band centered on the 1.00 grid line. The values fluctuate minimally, with the lowest point near 0.90 and the highest point near 1.10.
* Right Panel (Time 2): The X axis is labeled Time 2. The distribution is similar to Time 1, with approximately 50 data points clustered around the 1.00 mark. The spread is slightly wider than the first panel, with one outlier reaching approximately 1.15 and another dipping to approximately 0.88, but the overall trend remains stable and centered on 1.00.
Person infit statistics showed that most participants were also within Linacre’s (Reference Linacre2002) acceptable bounds of .50 and 1.50. In the first administration, only one test taker (ID = 1) had an outlying fit statistic, and in the second administration three (IDs = 1, 7, and 5). In these four cases, fit was 1.64–1.67, which indicates slightly more unpredictable response patterns (such as answering a question that is calculated as easy for one’s ability incorrectly). However, these statistics are all below 2, so this was relatively unproblematic for the model. The plots in Figure C4 show the distribution of the person infit values across the two tests. The x-axis contains the 80 individuals and the y-axis identifies the infit statistics.
Person fit distributions.

Figure C4. Long description
A multi-panel figure containing two side-by-side scatter plots.
Both plots share a vertical Y axis labeled Person Infit Values ranging from 0.0 to 2.0 with horizontal grid lines at intervals of 0.5. The horizontal X axis represents individual cases over time.
Left Panel (Time 1):
* The X axis is labeled Time 1.
* Data points are scattered across the horizontal plane.
* Most points are concentrated between the 0.7 and 1.3 infit value marks.
* There are two notable outliers above the 1.5 line, with one point reaching approximately 1.7.
* A few points fall below the 0.7 mark but remain above 0.5.
Right Panel (Time 2):
* The X axis is labeled Time 2.
* The distribution is similar to Time 1, with the majority of points clustered around the 1.0 horizontal line.
* There are three distinct outliers above the 1.5 line, appearing slightly higher than those in the first panel.
* The density of points between 0.5 and 1.0 appears slightly higher than in the first panel, with one point dipping very close to the 0.5 threshold.
TBLA analysis
We checked the quality of the TBLA rater data by running a partial-credit many-facet Rasch model (MFRM) using Facets (v.3.83.6). MFRM assumes unidimensionality across scales (that is to say, that all scales load onto one factor), of which we found evidence by running a one-factor confirmatory factor analysis using the lavaan package in R (v.0.6-18). A one-factor model was a reasonable fit for the rating scale data, suggesting that the scales measured the same construct, thus meeting the unidimensionality assumption (CFI > .95, TLI > .95, SRMR < .05; Hu & Bentler, Reference Hu and Bentler1999). RMSEA was 0.13, which is greater than the cutoff of .05, but we continued with the analysis given that CFI, TLI, and SRMR indices were within acceptable limits. MFRM showed that the scale categories fit the model with model infit and outfit values ranging from .8 to 1.24, well within Bond and Fox’s (Reference Bond and Fox2015) conservative range of .75 to 1.3. The separation (3.11) and strata (4.49) values showed that the raters were distinct in their ratings (separation reliability = .91). The three raters showed values that fit the model (.84–1.32) using Linacre’s (Reference Linacre2002) more lenient criterion of model fit (.5–1.5), demonstrating a good level of interrater reliability (exact agreement = 50%). The raters did not, however, demonstrate a high degree of difference in severity, with an absolute difference between the strictest (.11) and most lenient (−0.16) rater being .27 logits. The majority of the test takers also fit the model (85%), demonstrating approximately four levels of ability (separation = 3.77, reliability = .93).


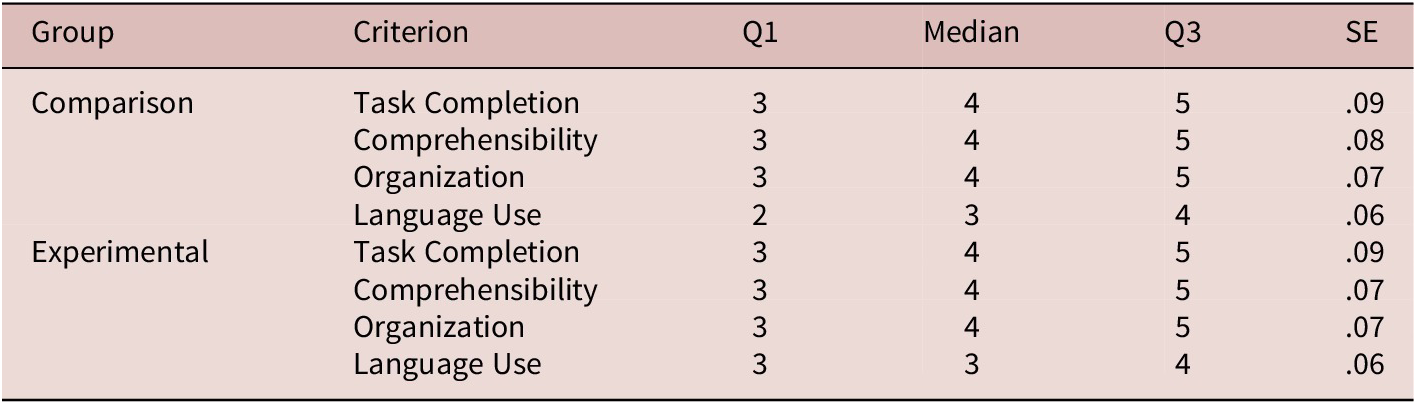



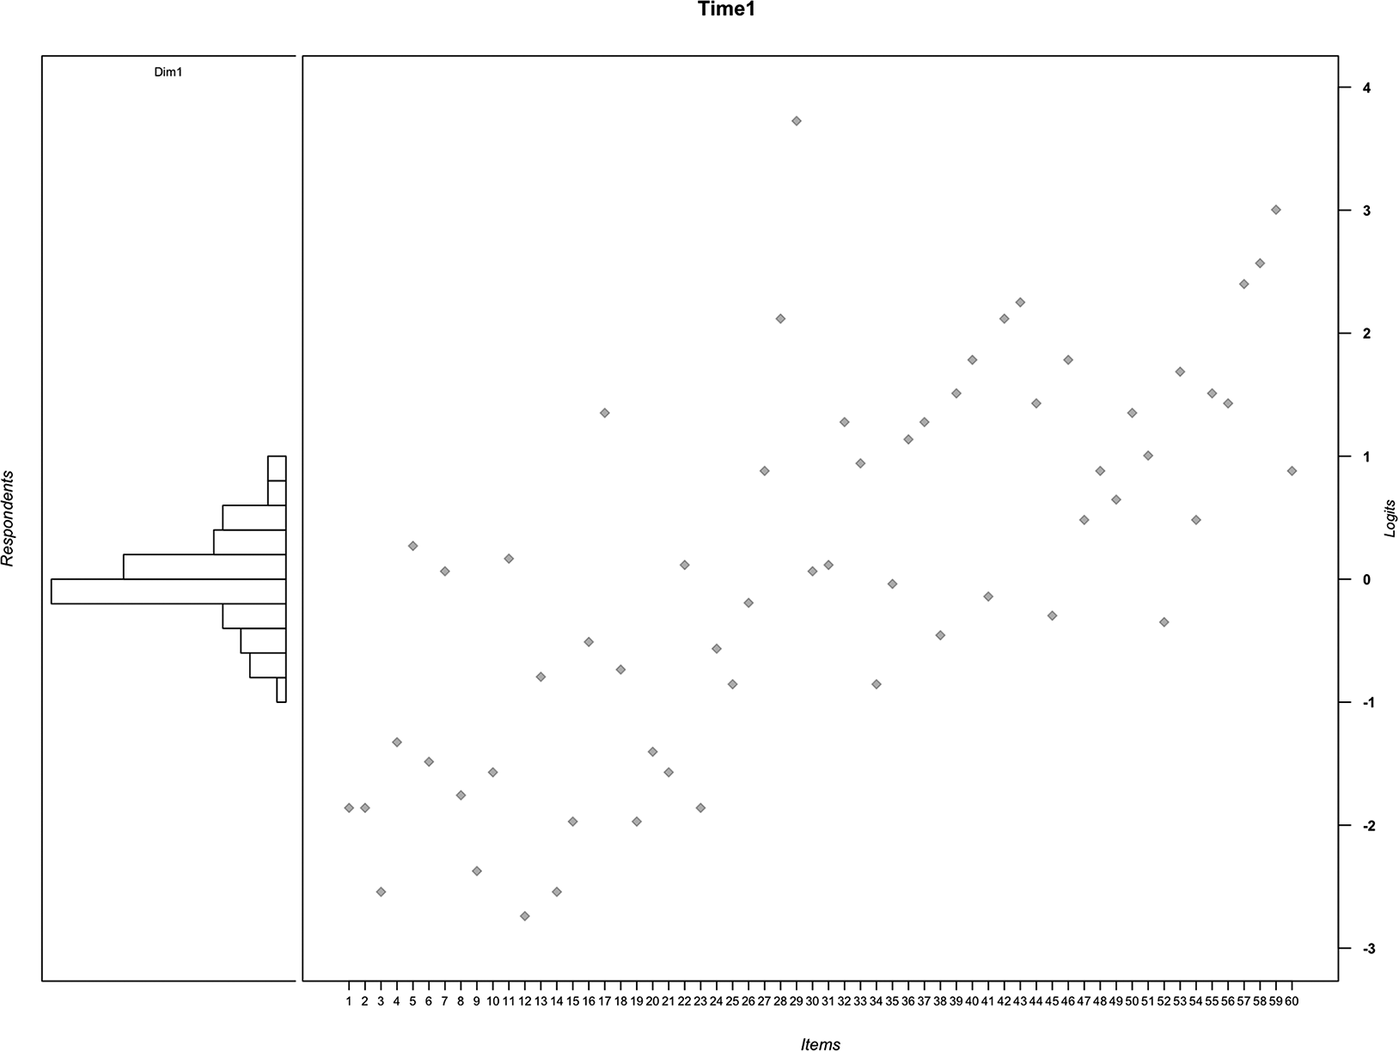
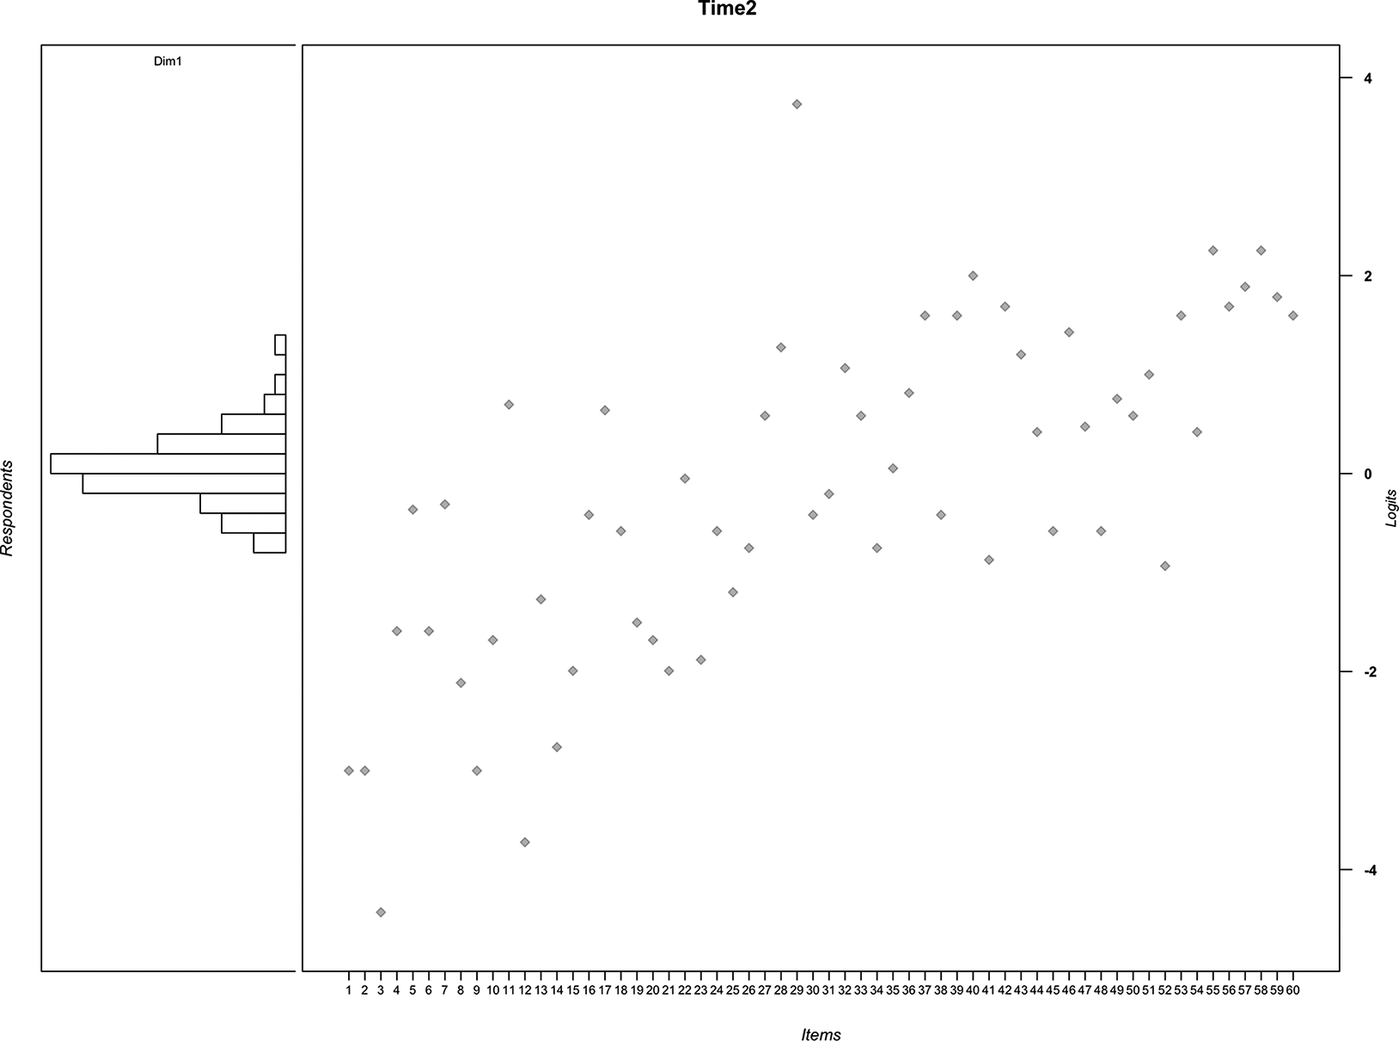
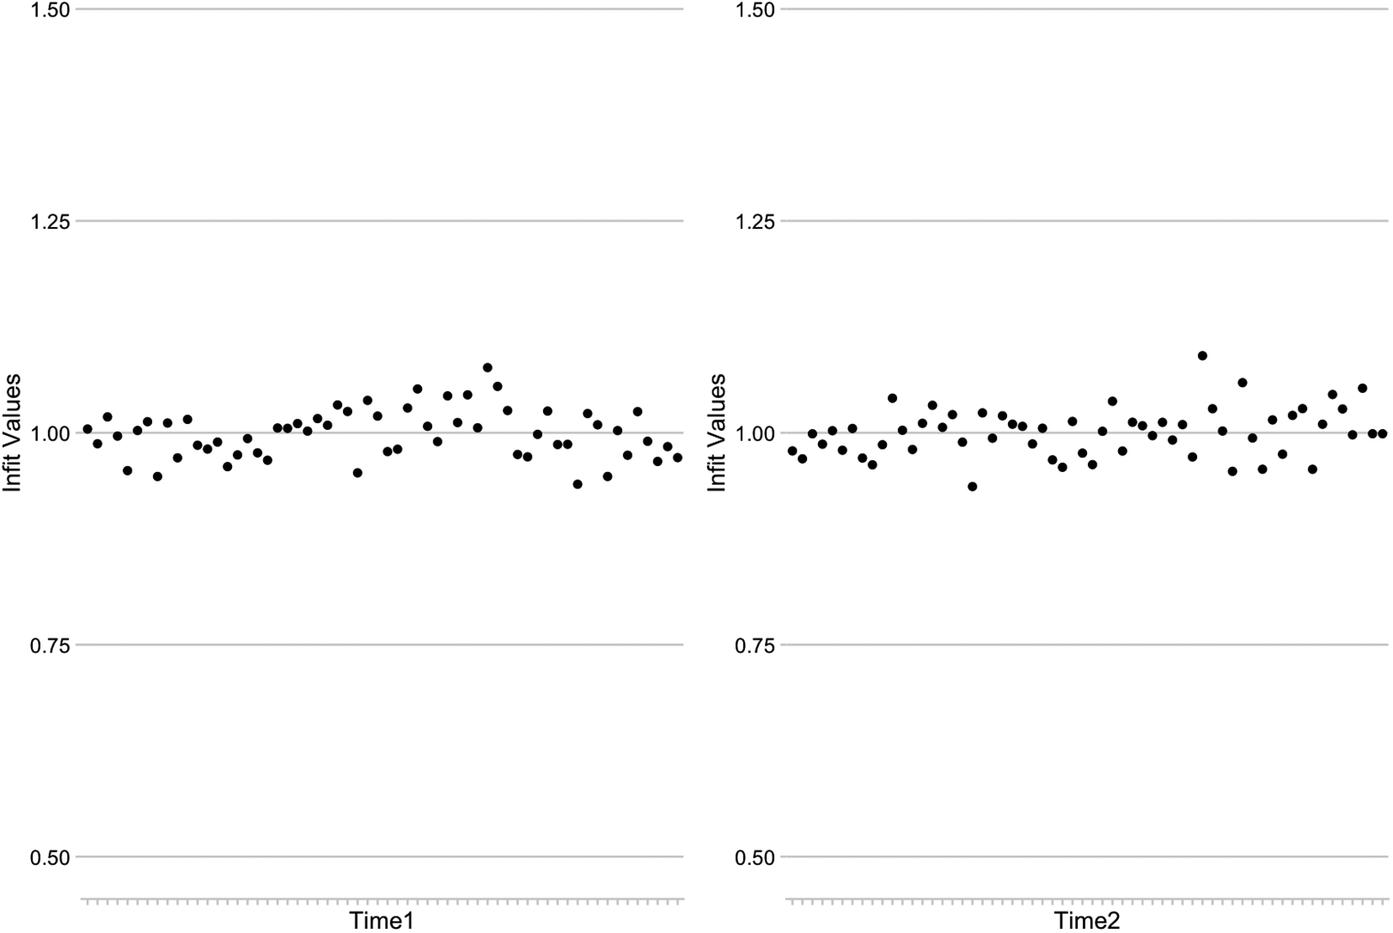
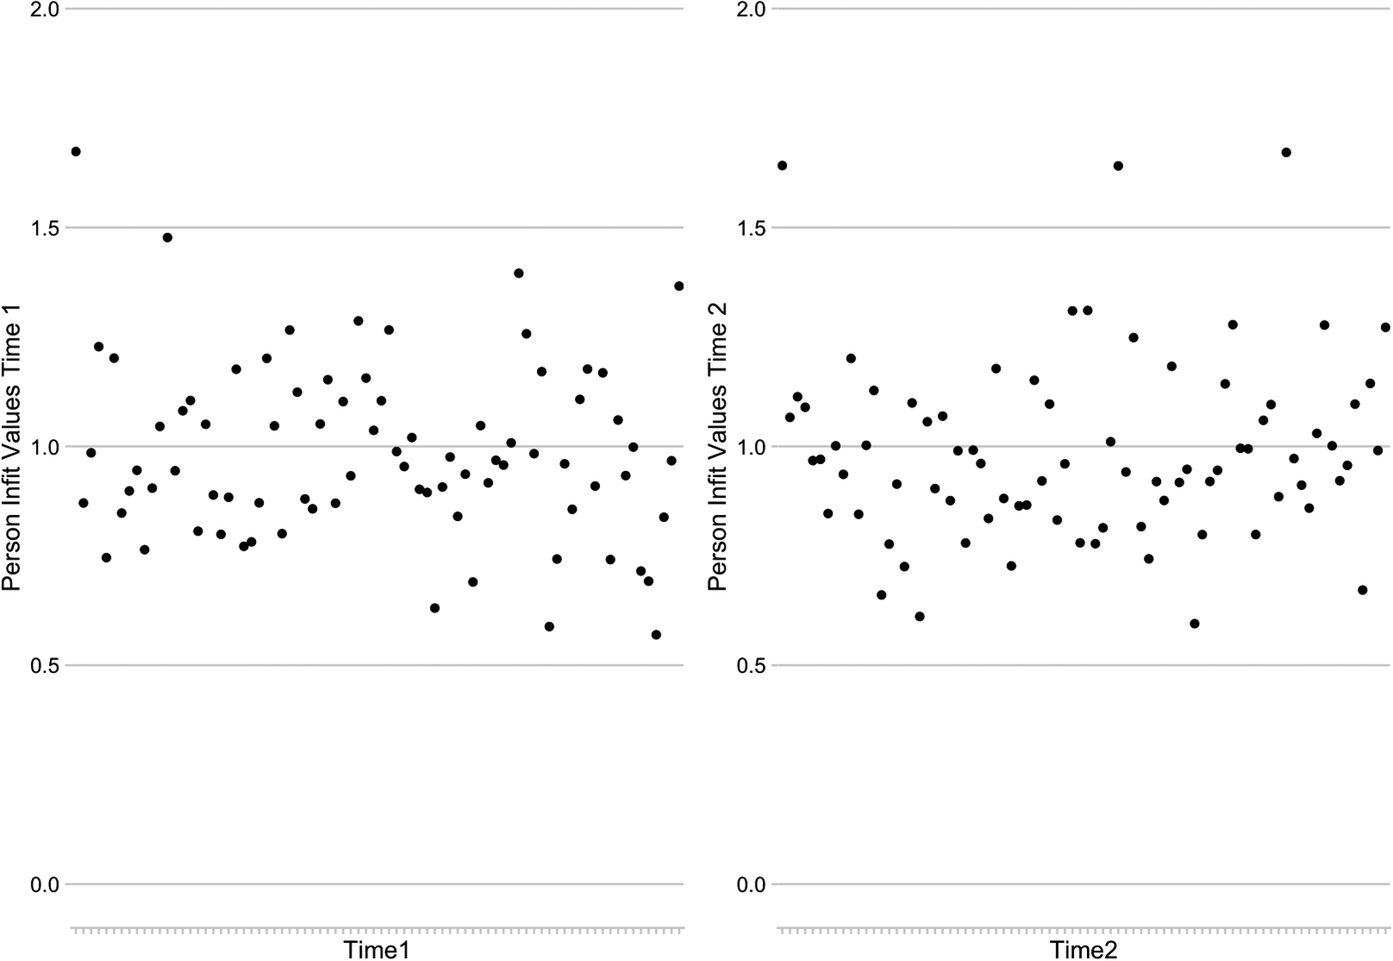

 Open access

