




Introduction
A usage-based constructionist approach suggests that language learning is similar to other forms of human learning in that frequency of use plays an important role in learning process (Bybee, Reference Bybee2006; Ellis, Reference Ellis2006a, Reference Ellisb; Langacker, Reference Langacker1987; Tomasello, Reference Tomasello2005). Frequently encountered linguistic constructions tend to be learned and produced earlier and become more deeply entrenched in second language (L2) learners’ minds (Ellis et al., Reference Ellis, Römer and O’Donnell2016).Footnote 1 Research on these frequency effects initially focused on word-level constructions through corpus-based word frequency measures but has since extended to both fixed and schematic phrase-level constructions, such as contiguous n-grams of varying lengths (Bestgen & Granger, Reference Bestgen and Granger2014; Eguchi & Kyle, Reference Eguchi and Kyle2020) and dependency bigrams (Kyle & Eguchi, Reference Kyle and Eguchi2023; Paquot, Reference Paquot2018; Rubin et al., Reference Rubin, Housen and Paquot2021). At the clausal level, research has focused on verbs and their argument constructions (VACs), exploring both the frequency of specific constructions (e.g., subject-VERB-direct object) and the strength of association between verbs (e.g., “have”) and these constructions (e.g., the verb “have” and subject-VERB-direct object; Kyle & Crossley, Reference Kyle and Crossley2017).
While previous studies on VACs have identified some patterns related to the interplay between verbs and the clausal-level constructions—such as more advanced L2 writers using less frequent yet more strongly associated verb-construction combinations—there remains room for methodological improvement. More recent studies benefitted from analyzing larger datasets with automatic dependency parsers (Hwang & Kim, Reference Hwang and Kim2023; Kim & Ro, Reference Kim and Ro2023; Kyle & Crossley, Reference Kyle and Crossley2017) compared to earlier, labor-intensive manual analyses. However, these parsers still lack the semantic nuance needed to reliably identify or disambiguate certain construction types. For example, because dependency parsers focus more on forms than the meanings of the arguments, they cannot closely differentiate arguments related to certain semantics (e.g., “ran [to the river] goal” versus “ran [around the mountain] location”; to a dependency parser, both are treated as adverbial prepositional phrases), which results in failure to disambiguate some of the argument structure constructions (ASCs)Footnote 2 that have been emphasized in studies on language learning (Kyle & Sung, Reference Kyle, Sung, Bonial and Madabushi2023).
In this study, we leverage the gold-annotated ASC treebank (Sung & Kyle, Reference Sung, Kyle, Henning and Stede2024a) and RoBERTa-based tagger (Sung & Kyle, Reference Sung, Kyle, Al‑Onaizan, Bansal and Chen2024b) to automatically identify ASCs from both target and reference corpora. Drawing on their validated model (n = 22,069 ASC tokens; F1 = .928 on L2 spoken, .915 on L2 written, .912 on first language [L1] data), we process the extracted ASCs through an NLP pipeline to compute four index types—diversity, proportion, frequency, and strength of association—that together capture multiple dimensions of ASC use. Extending these methodological advances, we investigate the role of these indices in relation to L2 oral proficiency. Although recent studies have examined lexicogrammatical predictors of L2 oral proficiency (Eguchi & Kyle, Reference Eguchi and Kyle2020; Kyle & Eguchi, Reference Kyle and Eguchi2023; Kyle et al., Reference Kyle, Sung, Eguchi and Zenker2024), clausal-level constructions—despite their relevance for structuring spoken discourse—have received limited attention in this domain, with most research focusing on writing. Yet oral language differs from writing in several key aspects—real-time processing demands and interactive turn-taking reliance on formulaic frames for fluency—which may make clausal-level constructions important for structuring spoken discourse. This gap highlights the need for a more comprehensive understanding of how these constructions operate in L2 speech, in which they play a critical role in supporting effective communication. Accordingly, we evaluate the predictive power of the ASC-based indices in two complementary ways: first, by assessing their ability to explain holistic scores of L2 oral proficiency assigned by human raters, and second, by examining their complementary contribution when integrated with established lexicogrammatical measures to capture a multivariate profile of L2 oral proficiency.
Background
Usage-based constructionist approach and measuring L2 proficiency
The usage-based constructionist approach suggests that language learning is driven by exposure to linguistic structures, both passively (as a listener or reader) and actively (as a speaker or writer) (Fillmore et al., Reference Fillmore, Kay and O’Connor1988; Langacker, Reference Langacker1987). These inputs and outputs enable learners to form constructions—specific form-meaning pairings that become entrenched through repeated use within a language community (Goldberg, Reference Goldberg1995). Constructions are not isolated or static units; they are interwoven with memories of language use, making each individual’s linguistic competence unique and dynamically shaped by communicative experiences (Bybee, Reference Bybee2010; Diessel, Reference Diessel2015; Ellis, Reference Ellis2012).
Within this framework, a body of research has focused on ASCs, a particular subset of clausal-level constructions (Ellis & Ferreira-Junior, Reference Ellis and Ferreira-Junior2009, Goldberg, Reference Goldberg2013a, Reference Goldberg and MacWhinneyb). ASCs are defined as “a special subclass of constructions that provides the basic means of clausal expression in a language” (Goldberg, Reference Goldberg1995, p. 3). These constructions are important for expressing core human experience and are extended in more diverse and sophisticated ways as learners develop their languages. Rooted in frame semantics (Fillmore, Reference Fillmore1976), this approach views that the meanings of clausal constructions as structured around common experiential frames, such as movement (e.g., theme-VERB-goal), causation (e.g., agent-VERB-theme-result), and transfer (e.g., agent-VERB-recipient-theme).
While ASCs are not the only linguistic constructions that can be used to investigate grammatical proficiency, they have been widely studied due to their interplay with verbs, which significantly contributes to grammatical productivity and fluency (Barðdal, Reference Barðdal, Antić, Chang, Cibelli, Hong, Houser, Sandy, Toosarvandani and Yao2006; Ellis et al., Reference Ellis, O’Donnell and Römer2014; Goldberg, Reference Goldberg2019). Early research emphasized how frequent exposure to prototypical verbs helps learners acquire corresponding ASCs, with such verbs serving as schemata for early construction learning (Goldberg et al., Reference Goldberg, Casenhiser and Sethuraman2004; Ninio, Reference Ninio1999). For example, Ellis and Ferreira-Junior (Reference Ellis and Ferreira-Junior2009) demonstrated that prototypical verbs such as “go,” “put,” and “give,” associated with intransitive motion, caused-motion, and ditransitive ASCs, respectively, facilitate learners’ production of these ASCs and enable richer verb selection as their proficiency increases.
Drawing on these observations, subsequent empirical studies have used the characteristics of ASCs to measure L2 lexicogrammatical proficiency, yielding several key insights. First, grammatical proficiency has often been gauged by the expanding inventories of verbs and ASCs (or, more broadly, VACs) produced by L2 learners (Choi & Sung, Reference Choi and Sung2020; Hwang & Kim, Reference Hwang and Kim2023; Kim & Ro, Reference Kim and Ro2023; Liu & Lu, Reference Liu and Lu2024). For example, Kim and Ro (Reference Kim and Ro2023) found that advanced L2 speakers used a wider variety of ASC types and a more diverse verb inventory, which suggests that proficient speakers move beyond prototypical verbs to employ less common and more varied verbs and constructions. Similarly, Liu and Lu (Reference Liu and Lu2024), in their focused study on the “VERB about NOUN” construction, supported the findings of Römer and Berger (Reference Römer and Berger2019), indicating that advanced learners tend to use more varied verb-VAC combinations.
Constructional development has also been captured by examining the proportion of complex ASCs in learner output. Hwang and Kim (Reference Hwang and Kim2023), for example, observed that more proficient L2 writers produced a higher proportion of “complex” ASCs—those that involve additional arguments to convey nuanced meanings, such as transfer, motion, or voice distinctions (e.g., ditransitive, caused-motion, passive constructions). Meanwhile, Choi and Sung (Reference Choi and Sung2020) found that Korean middle school learners with different levels of L2 fluency showed substantial differences in how frequently they produced sentence-level utterances. They further demonstrated that this variation was largely driven by the use of simple transitive constructions. Although word-level productions had little effect, clausal-level utterances, characterized by key ASC types, significantly differentiated learner fluency.
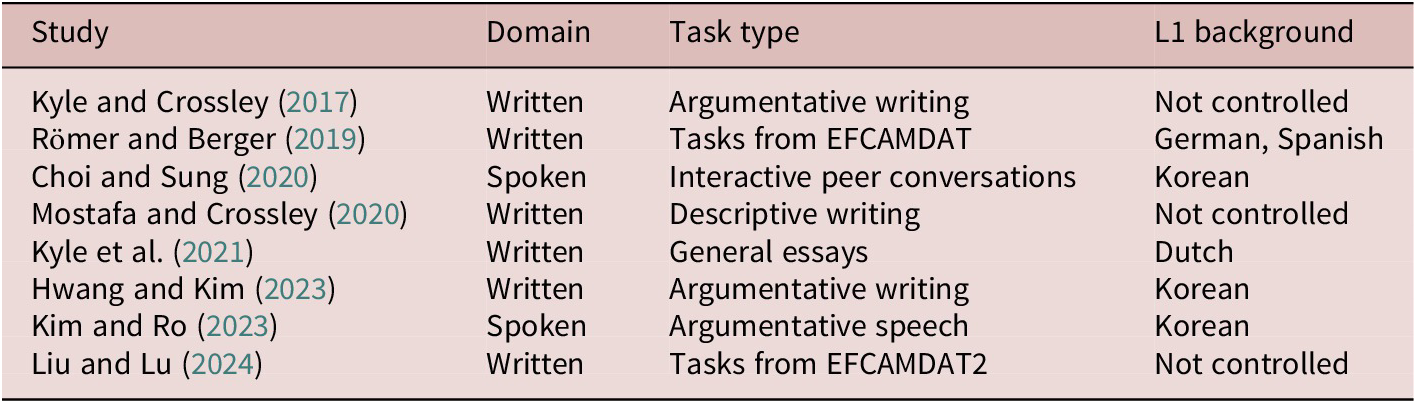
Some researchers have also operationalized frequency and strength of association (SOA) measures to evaluate lexicogrammatical productivity by comparing learner output against advance-speaker norms derived from reference corpora (Kyle & Crossley, Reference Kyle and Crossley2017; Kyle et al., Reference Kyle, Crossley and Verspoor2021; Liu & Lu, Reference Liu and Lu2024; Mostafa & Crossley, Reference Mostafa and Crossley2020; Römer & Berger, Reference Römer and Berger2019). To be specific, frequency measures the commonality of the ASCs or ASC-verb combinations, and SOA quantifies how strongly verbs and ASCs are associated. For example, Kyle and Crossley (Reference Kyle and Crossley2017) found that L2 essay quality, as judged by human raters, was negatively correlated with the relative frequency of verb-VAC combinations and positively correlated with their SOA. The study suggested that more proficient L2 writers tended to use less frequent yet more strongly associated verb-VAC combinations. Similarly, Römer and Berger (Reference Römer and Berger2019) showed that as German and Spanish L2 learners’ proficiency increased, their use of VACs, as measured by frequency and SOA, more closely approximated that of advanced speakers. Table 1 summarizes these key studies, highlighting their domains, task types, and L1 backgrounds.
Overview of previous studies on ASC/VAC production in L2 corpora

Multivariate analysis on measuring lexicogrammatical proficiency
Recent studies have enhanced multivariate models with innovative indices, offering a multi-faceted analysis of L2 productive lexicogrammatical proficiency. For instance, at the phrasal level, recent research has included n-gram collocations (Bestgen & Granger, Reference Bestgen and Granger2014; Eguchi & Kyle, Reference Eguchi and Kyle2020; Garner et al., Reference Garner, Crossley and Kyle2019; Kim et al., Reference Kim, Crossley and Kyle2018) along with established lexicogrammatical measures. Eguchi and Kyle (Reference Eguchi and Kyle2020), for example, investigated the relationship between the use of n-grams and L2 oral proficiency scores. They found that more proficient L2 speakers tended to use n-grams that were more strongly associated. Similarly, Kyle et al. (Reference Kyle, Crossley and Berger2018) included the proportion of frequent n-grams in L2 free writing tasks, along with SOA metrics, and found that higher lexical proficiency scores were linked to more frequent n-gram use. Kyle and Eguchi (Reference Kyle and Eguchi2023) built on this work by examining dependency bigrams (e.g., noun-adjective, VERB-adverb, VERB-direct object, and VERB-subject) and found small to moderate correlations with oral proficiency. More proficient L2 speakers tended to use noun-adjective and VERB-subject combinations with stronger associations. These findings align with those from L2 writing studies (Paquot, Reference Paquot2018; Rubin et al., Reference Rubin, Housen and Paquot2021).
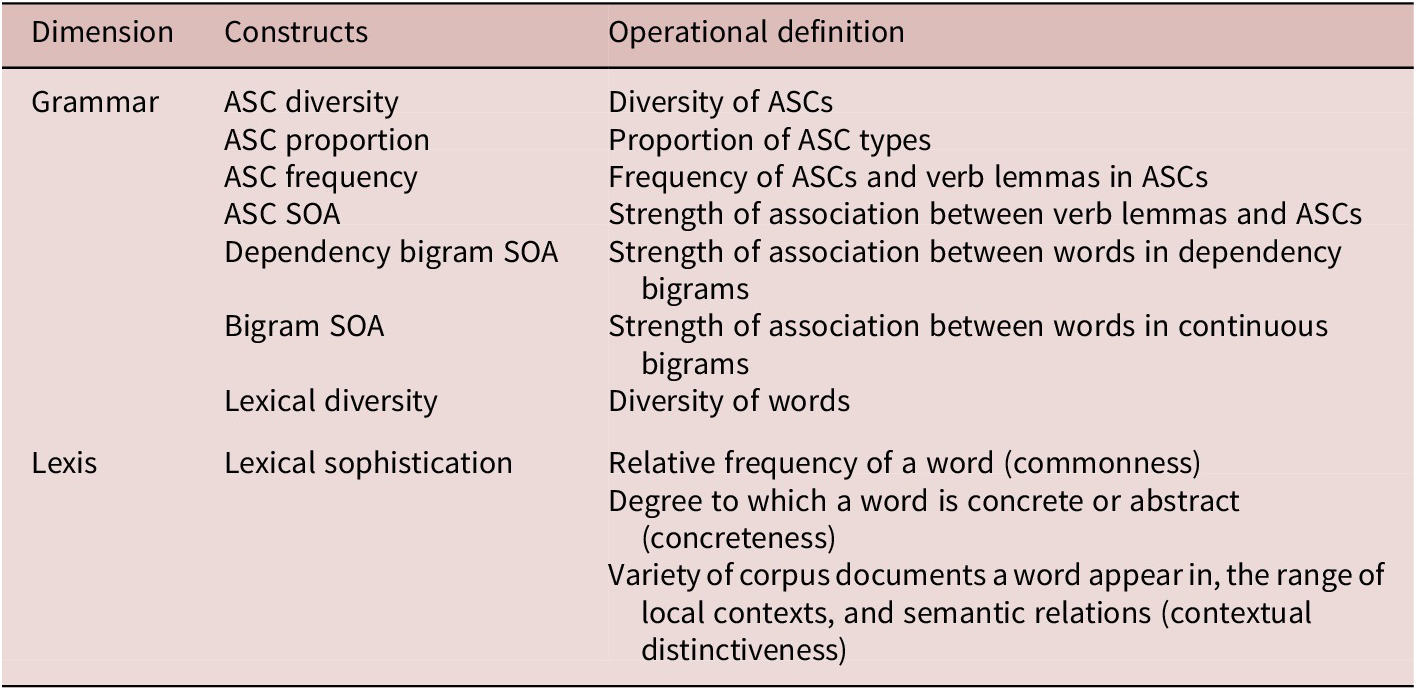
At the word level, productive lexical proficiency has been often conceptualized through two main sub-constructs: lexical diversity and sophistication (Kyle, Reference Kyle2019). Lexical diversity refers to the range of distinct words used by a learner and is often measured by the moving-average type-token ratio (MATTR), which has demonstrated strong reliability in L2 oral proficiency contexts (Kyle et al., Reference Kyle, Sung, Eguchi and Zenker2024). In contrast, lexical sophistication focuses on word depth, measured by the proportion of advanced vocabulary used (e.g., Eguchi & Kyle, Reference Eguchi and Kyle2020; Kim et al., Reference Kim, Crossley and Kyle2018; Kyle & Crossley, Reference Kyle and Crossley2015; Laufer & Nation, Reference Laufer and Nation1995; Read, Reference Read2000). Based on previous findings, this study includes three types of lexical sophistication measures deemed relevant to L2 oral proficiency. First, frequency-based measure evaluates how common a word is by comparing its frequency in a reference corpus (Kyle & Crossley, Reference Kyle and Crossley2015; Laufer & Nation, Reference Laufer and Nation1995; Meara & Bell, Reference Meara and Bell2001). In the context of L2 oral proficiency, previous studies demonstrated that less proficient L2 speakers rely on less common vocabulary in spoken genres, while more proficient speakers use more common, domain-appropriate vocabulary (Crossley et al., Reference Crossley, Skalicky, Kyle and Monteiro2019; Eguchi & Kyle, Reference Eguchi and Kyle2020). Second, concreteness index assesses the extent to which a word refers to some concrete versus an abstract concept (Brysbaert et al., Reference Brysbaert, Warriner and Kuperman2014), with a previous study showing that more proficient L2 speakers tend to use less concrete words (Eguchi & Kyle, Reference Eguchi and Kyle2020). Third, contextual distinctiveness index encompasses the variety of corpus documents a word appears in (Kyle & Crossley, Reference Kyle and Crossley2015), the range of local contexts it occurs in (McDonald & Shillcock, Reference McDonald and Shillcock2001), and the number of semantically related words (Kiss et al., Reference Kiss, Armstrong, Milroy and Piper1973; Nelson et al., Reference Nelson, McEvoy and Schreiber2004). Research has found that more proficient L2 speakers tended to use words with higher contextual distinctiveness, reflecting more context-specific language use (Eguchi & Kyle, Reference Eguchi and Kyle2020). Table 2 summarizes the lexicogrammatical constructs examined in both grammatical and lexical domains, accompanied by concise descriptions of their operationalizations, thereby offering a multivariate perspective on L2 oral proficiency assessment.
Summary of investigated constructs for measuring L2 oral proficiency

Current study
Several studies over the past decade (Bulté & Roothooft, Reference Bulté and Roothooft2020; Eguchi & Kyle, Reference Eguchi and Kyle2020; Kyle & Eguchi, Reference Kyle and Eguchi2023; Saito, Reference Saito2020; Yoon et al., Reference Yoon, Lu, Zechner, Evanini, Wang and Loukina2019) have explored the relationship between lexicogrammatical features and L2 oral proficiency. Extending these works, this study aims to investigate two key areas: (1) how ASC-based indices account for difference in L2 oral proficiency scores, and (2) how a combined set of lexicogramamatical measures explains variation in those same scores. Our research is guided by the following research questions (RQs):
RQ1. What is the relationship between L2 oral proficiency scores and indices related to ASC use?
RQ2. To what extent are indices related to ASC use predictive of L2 oral proficiency scores?
RQ3. To what extent are indices related to ASC use predictive of L2 oral proficiency scores when combined with other lexicogrammatical indices?
Method
Datasets
Learner corpus
This study utilized the National Institute of Information and Communications Technology Japanese Learner English (JLE) corpus, which includes 1,281 oral proficiency interview transcripts from Japanese learners of English (Izumi et al., Reference Izumi, Uchimoto and Isahara2004). The interviews were conducted through the Standard Speaking Test, a 10- to 15-min assessment modeled on the American Council on the Teaching of Foreign Languages (ACTFL) Oral Proficiency Interview and ACTFL adapted for Japanese learners of English (ACTFL-ALC Press, 1996; Koizumi & Hirai, Reference Koizumi and Hirai2012, pp. 41–42). The Standard Speaking Test comprises five sections: a self-introduction, a description of a picture, a role-play, a narration based on a series of images, and a concluding section with reflective questions. Each response was evaluated by at least two qualified raters, with a third rater resolving any score discrepancies (Kobayashi & Abe, Reference Kobayashi and Abe2016, p. 59). Test-takers received a holistic score ranging from 1 to 9, along with feedback on various criteria, including task completion, interaction quality, text type, grammatical accuracy, pronunciation, and interviewers’ comments. The comprehensive scoring rubric is available in the online supplementary material.Footnote 3
The original dataset includes tags for various aspects of the production, such as the interview structure (e.g., different stages of the interview), metadata (e.g., age, occupation, proficiency level), speaker turns (which indicates whether utterances were made by interviewers or interviewees), discourse phenomena (e.g., repetition, self-correction), and grammatical errors (e.g., verb tense errors). Based on the tagged information, additional filtering was necessary to exclude linguistic features irrelevant to the analysis, such as fillers, repetitions, Japanese words/utterances, and paralinguistic cues. To accomplish this, we replicated the approach taken by Kyle et al. (Reference Kyle, Sung, Eguchi and Zenker2024, p. 7), using publicly available Python code from the study to extract a clean text version from interview stages from 2 to 5: single-picture description, role-play, and sequential picture storytelling.Footnote 4
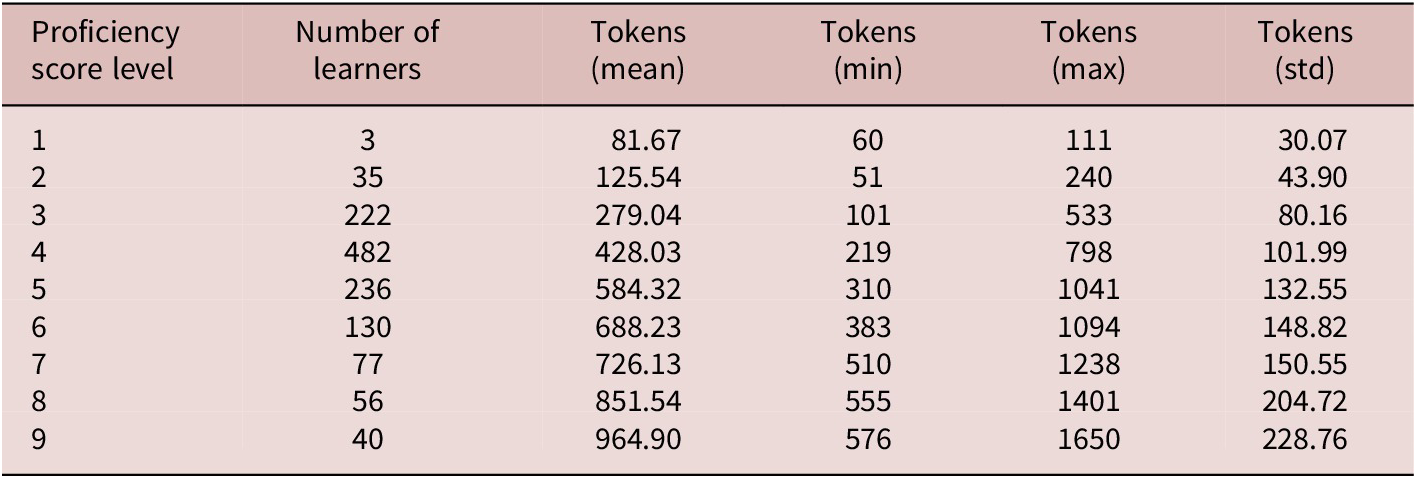
Table 3 details the distribution of learners and tokens across different proficiency score levels. The score levels ranged from 1 to 9, and the mean level is 4.664, with a standard deviation of 1.574. The median level is 4, and the standard error (SE) is 0044.
Number of learners and tokens across proficiency score levels

Reference corpus
The US English subtitle corpus (SUBTLEX-US) was used as a reference to calculate frequency and association strength, determining how common or rare verb lemmas, ASCs, and their associations are within the learner corpus compared to those of advanced English speakers. It was compiled from the subtitles of films and television programs, totaling 8,388 subtitle files (Brysbaert & New, Reference Brysbaert and New2009; Brysbaert et al., Reference Brysbaert, New and Keuleers2012), and contains 76,965,430 word tokens; 164,686 word types; 5,128,462 sentences; and 5,665,251 tagged ASCs. Although subtitles are scripted and edited for readability, they still capture many features of spontaneous speech in various narrative contexts and have been used as a benchmark in L2 oral studies (cf. Berger et al., Reference Berger, Crossley and Skalicky2019, p. 919, “derived from a corpus of American film and television subtitles approximating spoken language but excluding highly formal or academic written registers”).
Identification of ASCs
The identification of ASCs has progressed from labor-intensive manual annotation to highly accurate, fully automated methods. Early work relied on hand-coded analyses, which offered high control over the data but were time consuming and not scalable (Choi & Sung, Reference Choi and Sung2020; Ellis & Ferreira-Junior, Reference Ellis and Ferreira-Junior2009). The release of large, publicly available treebanks with syntactic-dependency annotations and the advent of robust dependency parsers (Chen & Manning, Reference Chen, Manning, Moschitti, Pang and Daelemans2014; de Marneffe & Manning, Reference de Marneffe and Manning2008) enabled the first automated ASC analyses (O’Donnell & Ellis, Reference O’Donnell, Ellis, Sahlgren and Knutsson2010; Römer et al., Reference Römer, O’Donnell and Ellis2014). More recently, neural network-based parsers have boosted parsing accuracy and renewed interest in automated ASC tagging (Hwang & Kim, Reference Hwang and Kim2023; Kim & Ro, Reference Kim and Ro2023; Kyle & Crossley, Reference Kyle and Crossley2017). Despite these advancements, purely syntactic representations may lack the semantic detail needed to distinguish certain ASC types (Kyle & Sung, Reference Kyle, Sung, Bonial and Madabushi2023; Sung & Kyle, Reference Sung, Kyle, Henning and Stede2024a).
To address this issue, Kyle and Sung (Reference Kyle, Sung, Bonial and Madabushi2023) proposed integrating semantic-role annotations—from resources such as PropBank (Palmer et al., Reference Palmer, Gildea and Kingsbury2005), the Universal Propositions treebank (Akbik et al., Reference Akbik, Chiticariu, Danilevsky, Li, Vaithyanathan, Zhu, Zong and Strube2015), VerbNet (Schuler, Reference Schuler2005), and FrameNet (Fillmore et al., Reference Fillmore, Johnson and Petruck2003—into a semi-automatic pipeline. Their method yielded a silver-standard ASC treebank (version 1) and, when paired with a RoBERTa-based classifier (Liu et al., Reference Liu, Ott, Goyal, Du, Joshi, Chen, Levy, Lewis, Zettlemoyer and Stoyanov2019), achieved F1 = .918. Building on that foundation, Sung and Kyle (Reference Sung, Kyle, Henning and Stede2024a) released a gold-standardFootnote 5 ASC treebank (version 2), comprising 10,204 sentences (22,069 ASC tokens) drawn from L1 written (English Web Treebank [EWT]; Silveira et al., Reference Silveira, Dozat, de Marneffe, Bowman, Connor, Bauer, Manning, Calzolari, Choukri, Goggi, Declerck, Mariani, Maegaard, Moreno, Odijk, Mazo, Piperidis and Loftsson2014), L2 written (English as a Second Language [ESL]-WR; Berzak et al., Reference Berzak, Kenney, Spadine, Wang, Lam, Mori, Garza, Katz, Erk and Smith2016), and L2 spoken (ESL-SP; Kyle et al., Reference Kyle, Eguchi, Miller, Sither, Kochmar, Burstein, Horbach, Laarmann-Quante, Madnani, Tack, Yaneva, Yuan and Zesch2022) corpora.
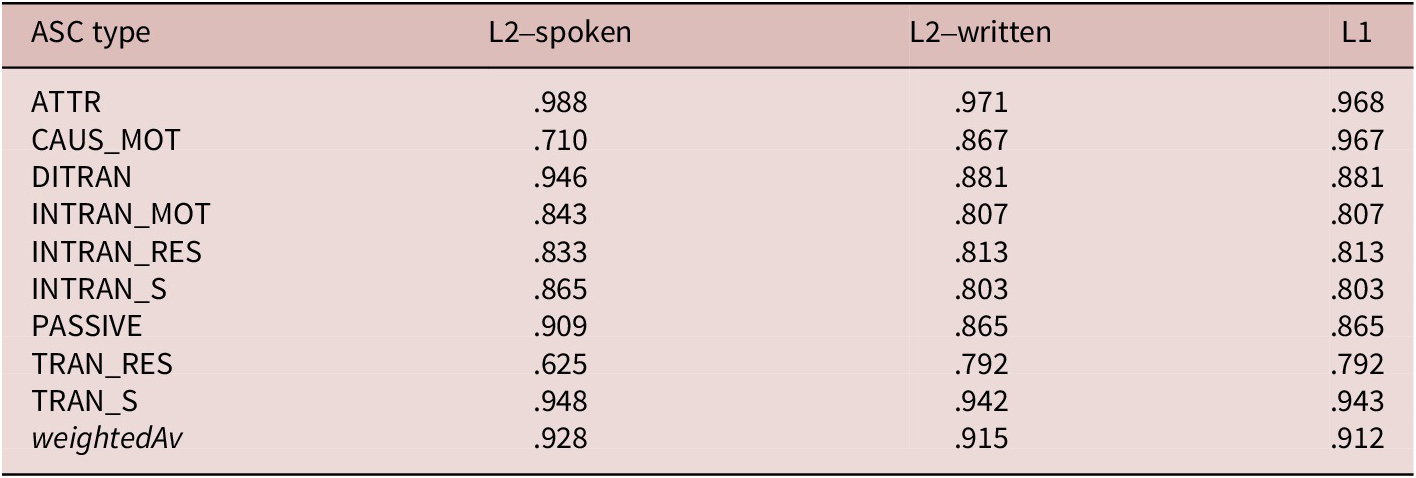
In the present study, we apply our previously validated RoBERTa model to the ASC treebank (version 2). The model attains consistently high F1 scores across contexts—.928 on L2 spoken, .915 on L2 written, and .912 on L1 data—demonstrating its robustness and suitability for L2 ASC identification (Sung & Kyle, Reference Sung, Kyle, Al‑Onaizan, Bansal and Chen2024b). Table 4 summarizes the model’s performance by ASC type across L1 and L2 test sets.
F1 scores by ASC type and tested dataset

Notes: weightedAv represents the weighted-average F1 score, which provides a summary of the average performance across all ASC types within each dataset, taking into account the frequency of each type. More frequent ASC types have a greater influence on the weighted score.
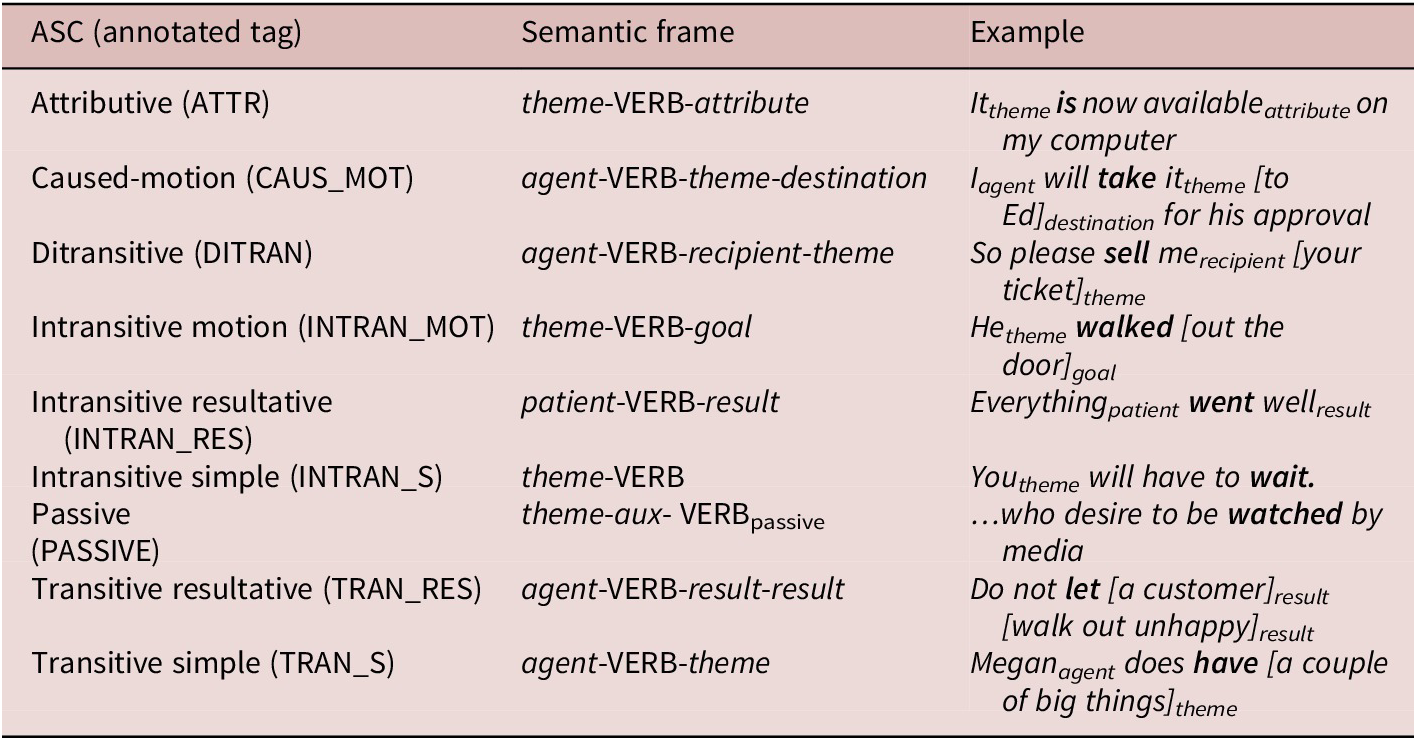
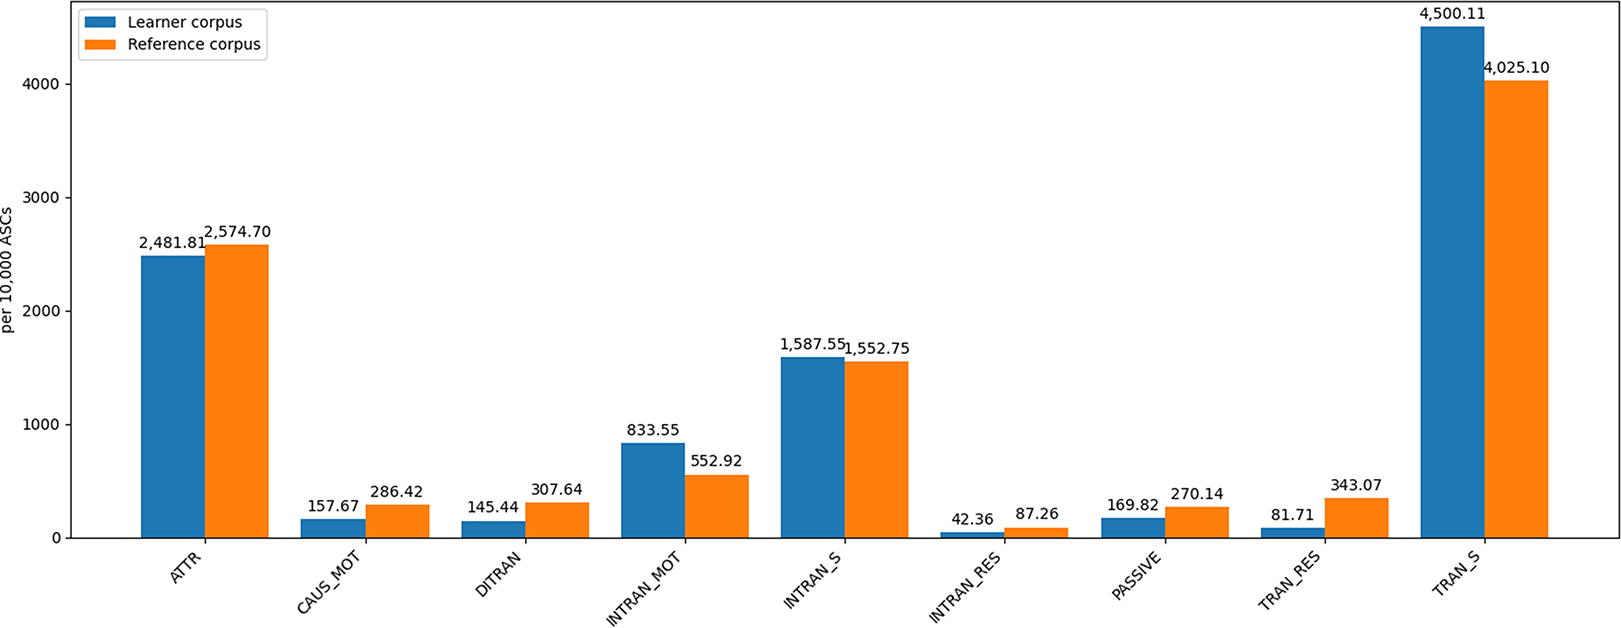
Table 5 illustrates the nine ASC types analyzed in this study, along with their prototypical semantic-frame representations (sourced from frame databases) and example sentences drawn from the learner corpus (see Sung & Kyle, Reference Sung, Kyle, Henning and Stede2024a, for details). Figure 1 outlines the ASCs identified in the learner and reference corpora.
ASC representations and examples

Distribution of ASCs in the JLE (learner) and SUBTLEX-US (reference) corpora (normalized by occurrences per 10,000 ASCs).

Linguistics analysis
ASC-based indices
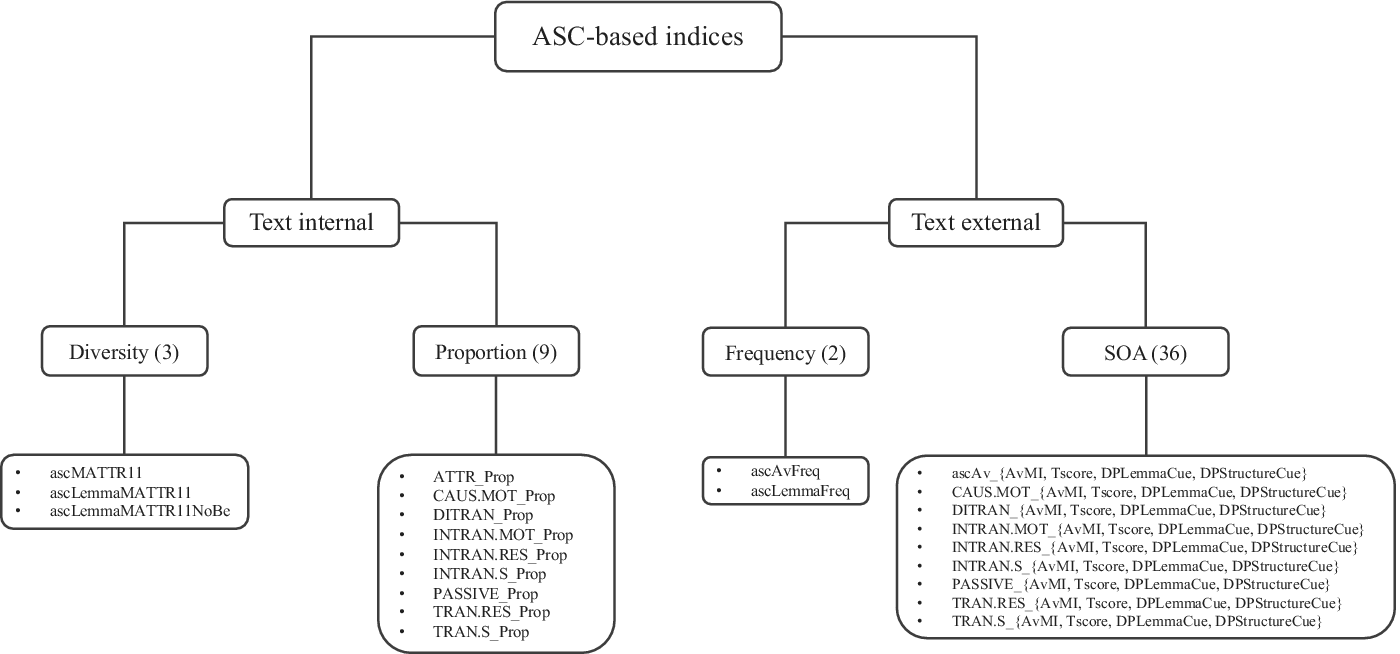
We computed four types of ASC-based indices (diversity, proportion, frequency, and SOA) to quantify ASC use in the learner corpus (Figure 2). Diversity and proportion measures are categorized as text-internal indices, which means they measure ASC usages solely within the learner corpus. These indices help us understand how ASCs are used diversely and proportionally within each text produced by an L2 learner. In contrast, frequency and SOA measures are classified as text-external indices, as they rely on a reference corpus to establish normative frequency and SOA benchmarks for advanced spoken language use.
Categorizations of ASC-based indices.

The threshold for inclusion from the reference corpus was set at five occurrences to exclude rare constructions that could skew the results while focusing on patterns that are statistically reliable. A description of each index is provided below.
Diversity
-
• ascMATTR11 measures the moving average type-token ratio over an optimized window of 11 ASCs, assessing the ASC diversity within the text.
-
• ascLemmaMATTR11 measures moving average type-token ratio over an optimized window of 11 ASCs, assessing the ASC-verb lemma combination diversity within the text.
-
• ascLemmaMATTR11NoBe excludes forms of the verb “be” from the ascLemmaMATTR11 diversity calculation. Since “be” appears frequently in corpora but contains less semantic information compared to other verbs, this index provides a picture of the diversity of more semantically rich verbs and content words.
Proportion
This set of indices measures the proportion of various syntactic constructions within a text. For example, ATTR_Prop focuses on the proportion of the attributive construction. The sum of the proportion indices equals 1 in a single text.
Frequency
-
• ascAvFreq measures the frequency of ASCs in the text, based on the averaged frequency calculated from the reference corpus data.
-
• ascLemmaFreq measures the frequency of ASCs-verb lemmas in the text, based on the averaged frequency calculated from the reference corpus data.
Strength of association (SOA)
We calculated the SOA of ASCs and verb lemma based on the database built from the reference corpus. We analyzed four different pointwise indices:
-
• Averaged mutual information (AvMI):
 $ {\mathit{\log}}_2\left(\frac{observed}{expected}\right) $
AvMI measures, on average, how much more often ASC-verb lemma pairs occur together than would be expected by chance. First, for each ASC and verb lemma, we count how often they co-occur in the reference corpus (observed frequency). Next, we estimate how often they would co-occur if their occurrences were independent (expected frequency). We then convert the ratio of observed to expected frequency into bits of information by using a base-2 logarithm. Finally, we average these bit-values across all ASC-verb lemma pairs in the learner text to produce the score.
-
• T-score (Tscore):
$ \frac{observed- expected}{\sqrt{observed}} $
Tscore is computed in a manner analogous to AvMI, using both observed and expected co-occurrence frequencies. For each ASC-verb lemma pair, we take its actual count in the reference corpus and subtract the count predicted under statistical independence. We then divide this difference by the square root of the observed frequency. This normalization down-weights low-frequency pairs and yields a standardized association score: Higher T-scores indicate that the ASC-verb combination co-occurs more frequently than chance would predict.
-
• Delta P evaluates the directional predictability of one element by another, given then the 2 × 2 table to describe the equation:
-
○ Delta P Lemma Cue (DeltaPLemmaCue; DPLemmaCue):
$ \frac{a}{a+b}-\frac{c}{c+d\;} $
DeltaPLemmaCue measures the change in the probability of the target ASC occurring when the target lemma is present, compared to the probability of the target ASC occurring when the lemma is absent.
-
○ Delta P Structure Cue (DeltaPstructureCue; DPStructureCue):
$ \frac{a}{a+c}-\frac{b}{b+d} $
DeltaPstructureCue measures the change in the probability of the target lemma occurring when the target ASC is present, compared to the probability of the target lemma occurring when the ASC is absent.
-


This set of indices measures the average scores of various SOA metrics (AvMI, Tscore, DPLemmaCue, DPStructureCue) for different ASCs, including caused-motion (e.g., CAUS.MOT_AvMI), ditransitive, intransitive motion, intransitive resultative, intransitive, passive, transitive resultative, and transitive ASCs, with each score calculated per ASC-verb lemma combination and then macro-averaged (e.g., ascAv_DPStructureCue).
Other lexicogrammatical indices
In addition to the ASC-based indices, we calculated several lexicogrammatical indices that have been shown to be effective in modeling L2 proficiency (Eguchi & Kyle, Reference Eguchi and Kyle2020; Kyle & Eguchi, Reference Kyle and Eguchi2023; Kyle et al., Reference Kyle, Sung, Eguchi and Zenker2024; see Table 2). These indices related to bigram SOA (e.g., lemma_bg_T, lemma_bg_MI), dependency bigram SOA (e.g., v_nsubj_T, v_dobj_MI), lexical sophistication (e.g., amod_freq_log, b_concreteness), and lexical diversity (MATTR 11). Full calculation details for each index are provided in the online supplementary materials.
Statistical analyses
To address RQ1, which examines the relationship between each ASC-based index and L2 oral proficiency scores, we first inspected the distribution of each metric’s values using histograms and scatterplots, excluding any with pronounced floor or ceiling effects. We then calculated Pearson correlations between the remaining indices and the proficiency scores. All analyses were performed using R (corrtable package; van der Laken & Lambert, Reference van der Laken and Lambert2023).
To address RQ2 and RQ3, which examine the predictive power of ASC-based indices (RQ2) and a combination of ASC-based and other lexicogrammatical indices (RQ3) for L2 oral proficiency scores, we conducted linear regression analyses. We first filtered out predictors with |r| ≤ .10. Within each SOA family, we kept only the index most strongly correlated with the proficiency. We then removed pairs of predictors with intercorrelations > .90 (retaining the stronger correlate) and any variable with VIF > 5 (James et al., Reference James, Witten, Hastie and Tibshirani2017; Menard, Reference Menard2001) to address multicollinearity issues. Using R’s lm function, we fitted preliminary models and then performed model selection via AIC, retaining models with ΔAIC < 4 (Akaike, Reference Akaike1974; Tan & Biswas, Reference Tan and Biswas2012) using the dredge function (MuMIn; Barton, Reference Barton2023) and choosing the lowest-AIC solution.
Results
RQ 1
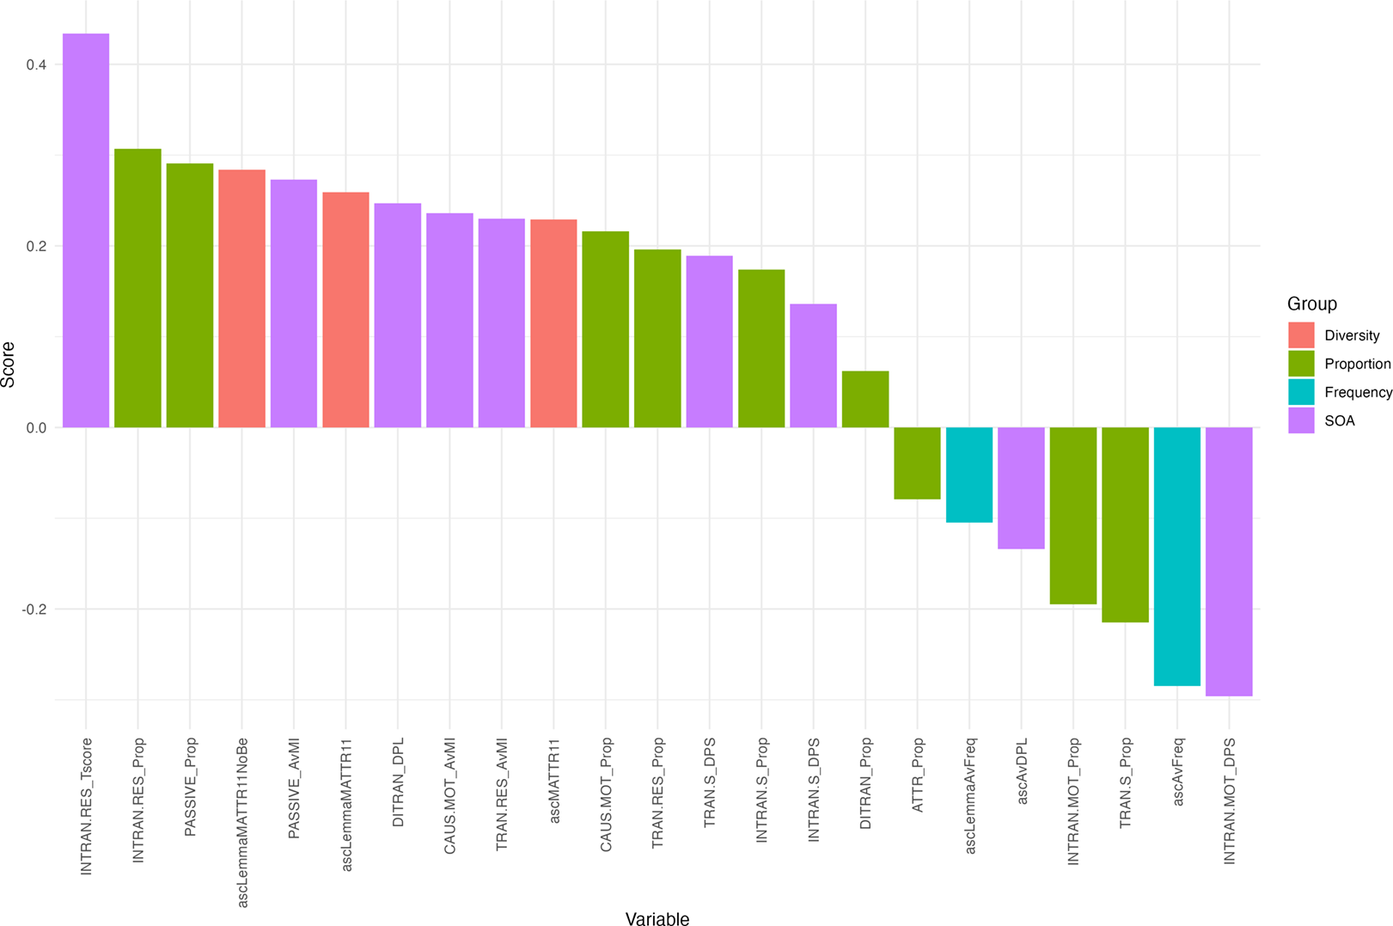
To address RQ1, descriptive statistics and correlations between proficiency scores and each index are presented. We first summarized the key results for each index group: diversity, proportion, frequency, and SOA in Figure 3, with detailed results for each index type following below.
Correlations between L2 oral proficiency scores and select indices of ASC use.

Diversity
The descriptive statistics for the diversity indices are provided in Table 6. The results of the correlation analysis between the diversity indices and proficiency scores are reported in Table 7. The result indicates that all investigated indices have significant correlations with oral proficiency, but these correlations are generally small (Cohen, Reference Cohen1988). The correlation matrix shows that ascLemmaMATTR11 and ascLemmaMATTRT11NoBe are collinear.
Descriptive statistics: Diversity indices

Correlations between proficiency scores and diversity indices

Proportion
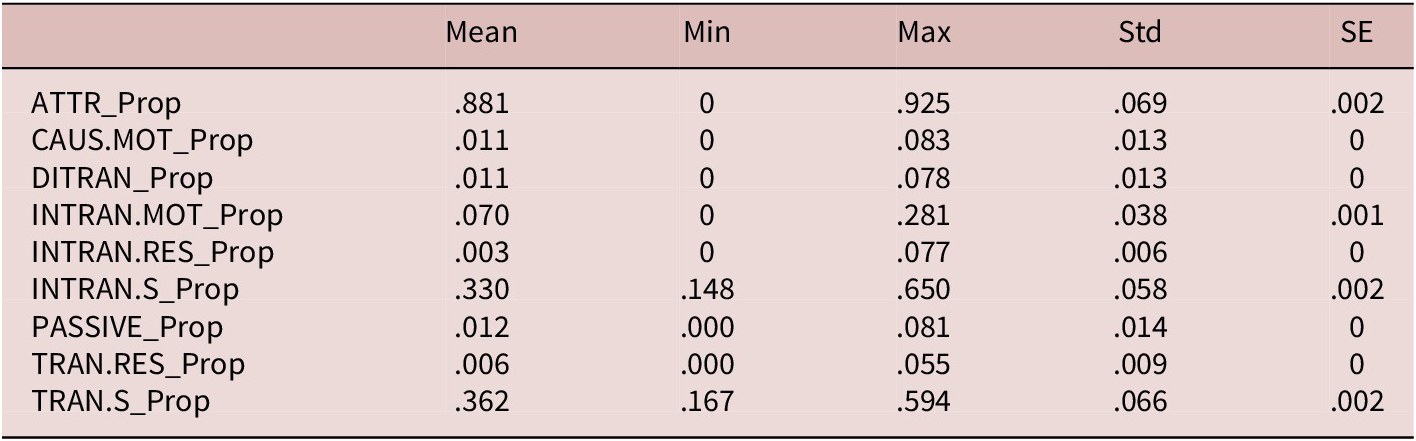
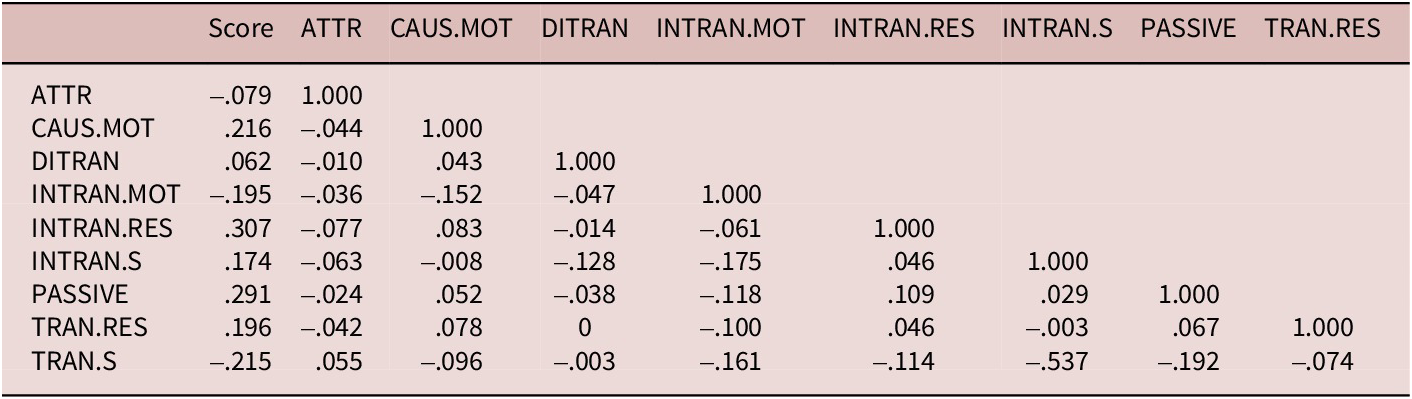
The descriptive statistics for the proportion indices are presented in Table 8. The results of the correlation analysis between each type of proportions and proficiency scores are detailed in Table 9. The result indicates all investigated indices have significant correlations with oral proficiency and these correlations are generally small to medium. In terms of direction, attribute, intransitive motion, and transitive simple ASCs correlated negatively; all others correlated positively.
Descriptive statistics: Proportion indices

Notes: Prop = proportion.
Correlations between proficiency scores and proportion indices

Frequency
The description statistics for the frequency indices are provided in Table 10. The results of the correlation analysis between each type of frequency index and proficiency score are detailed in Table 11. The result indicates that all indices correlated significantly with oral proficiency, though the effects were generally small and negative.
Descriptive statistics: Frequency indices

Correlations between proficiency scores and frequency indices

SOA
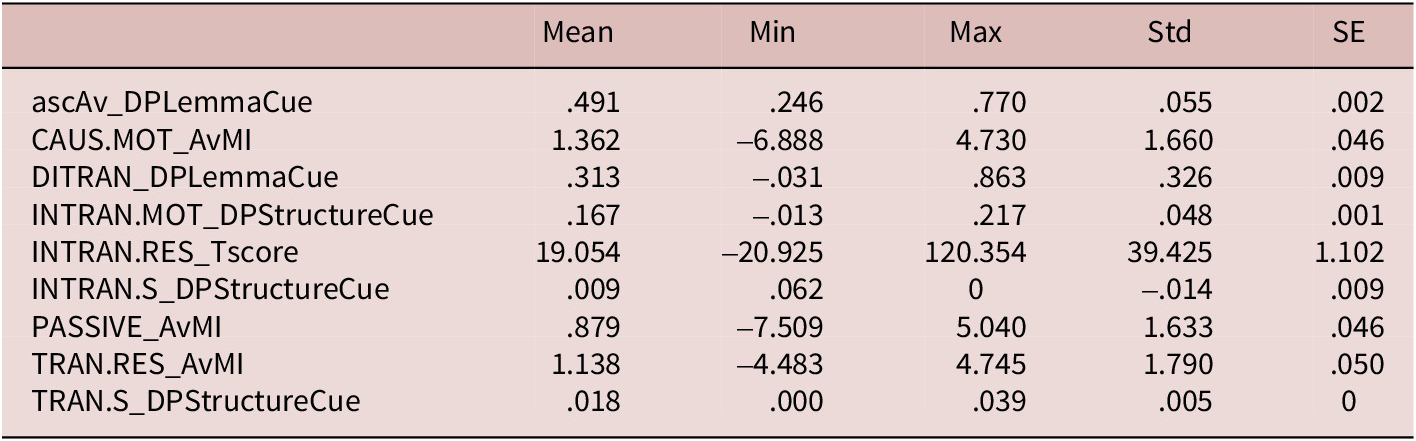
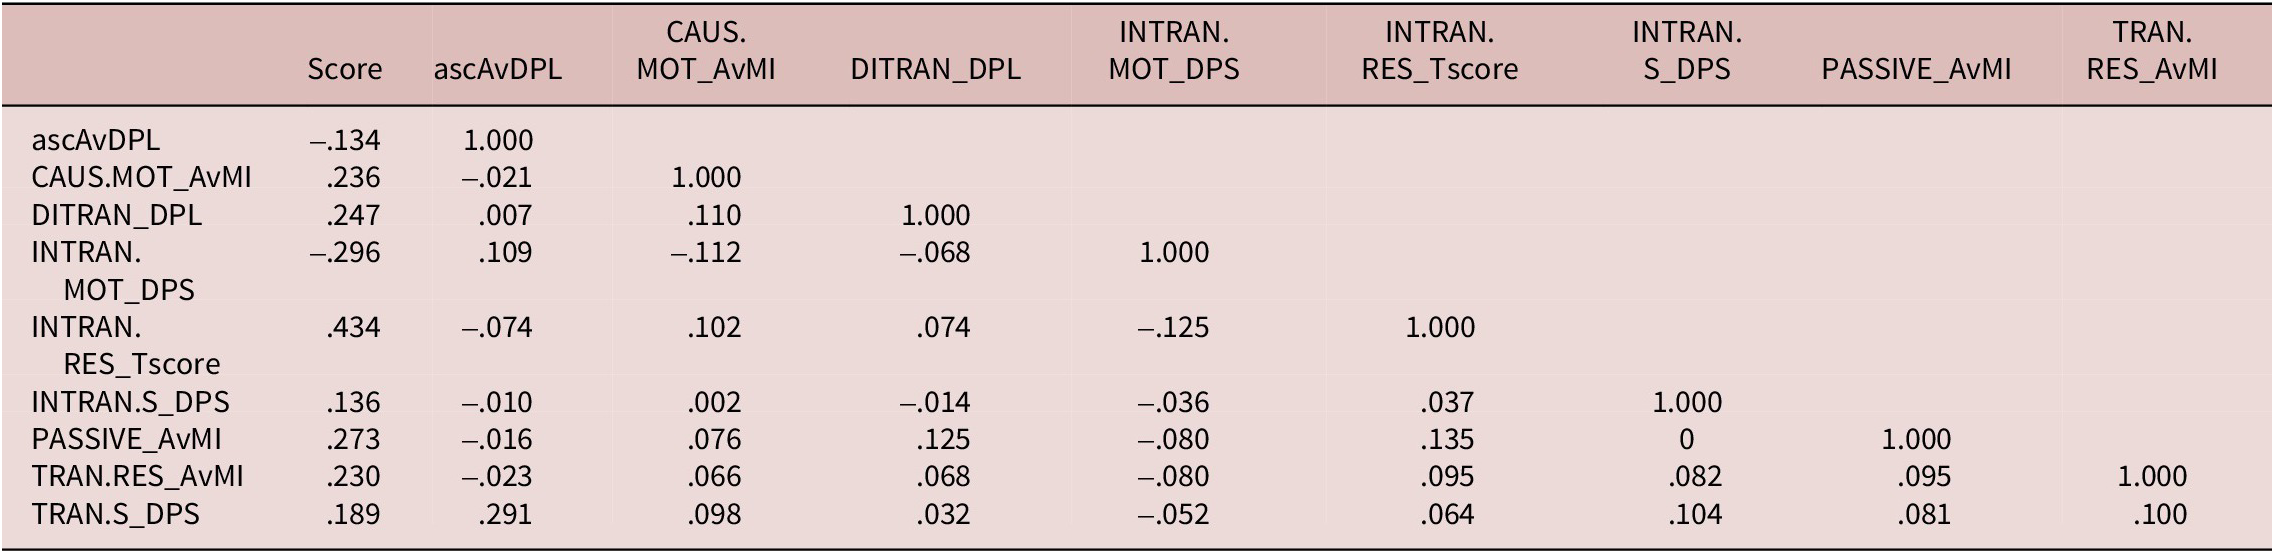
For brevity, only indices with meaningful correlations (|r| > .1) and the strongest correlations within each of the four SOA sub-types of indices (i.e., AvMI, Tscore, DPLemmaCue, DPStructureCue) are presented (and included for the subsequent analyses in RQ2 and RQ3).Footnote 6 The description statistics for SOA indices are provided in Table 12, and correlation results are detailed in Table 13. The result showed that five ASC types (intransitive resultative, passive, caused-motion, transitive resultative, transitive simple and intransitive simple) showed moderate to small positive correlations. Conversely, intransitive motion constructions showed a moderate negative correlation.
Descriptive statistics: SOA indices

Correlations between proficiency scores and SOA indices

Notes: DPL = DPLemmaCue; DPS = DPStructureCue.
RQ2
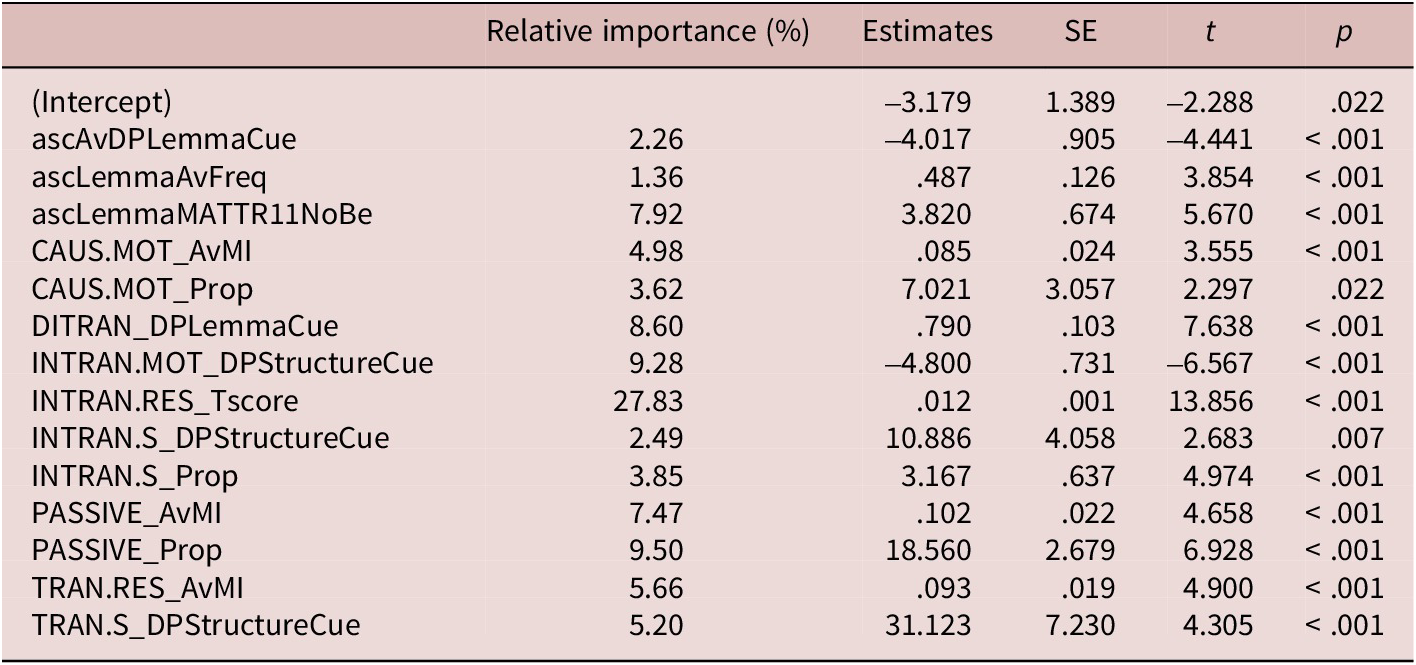
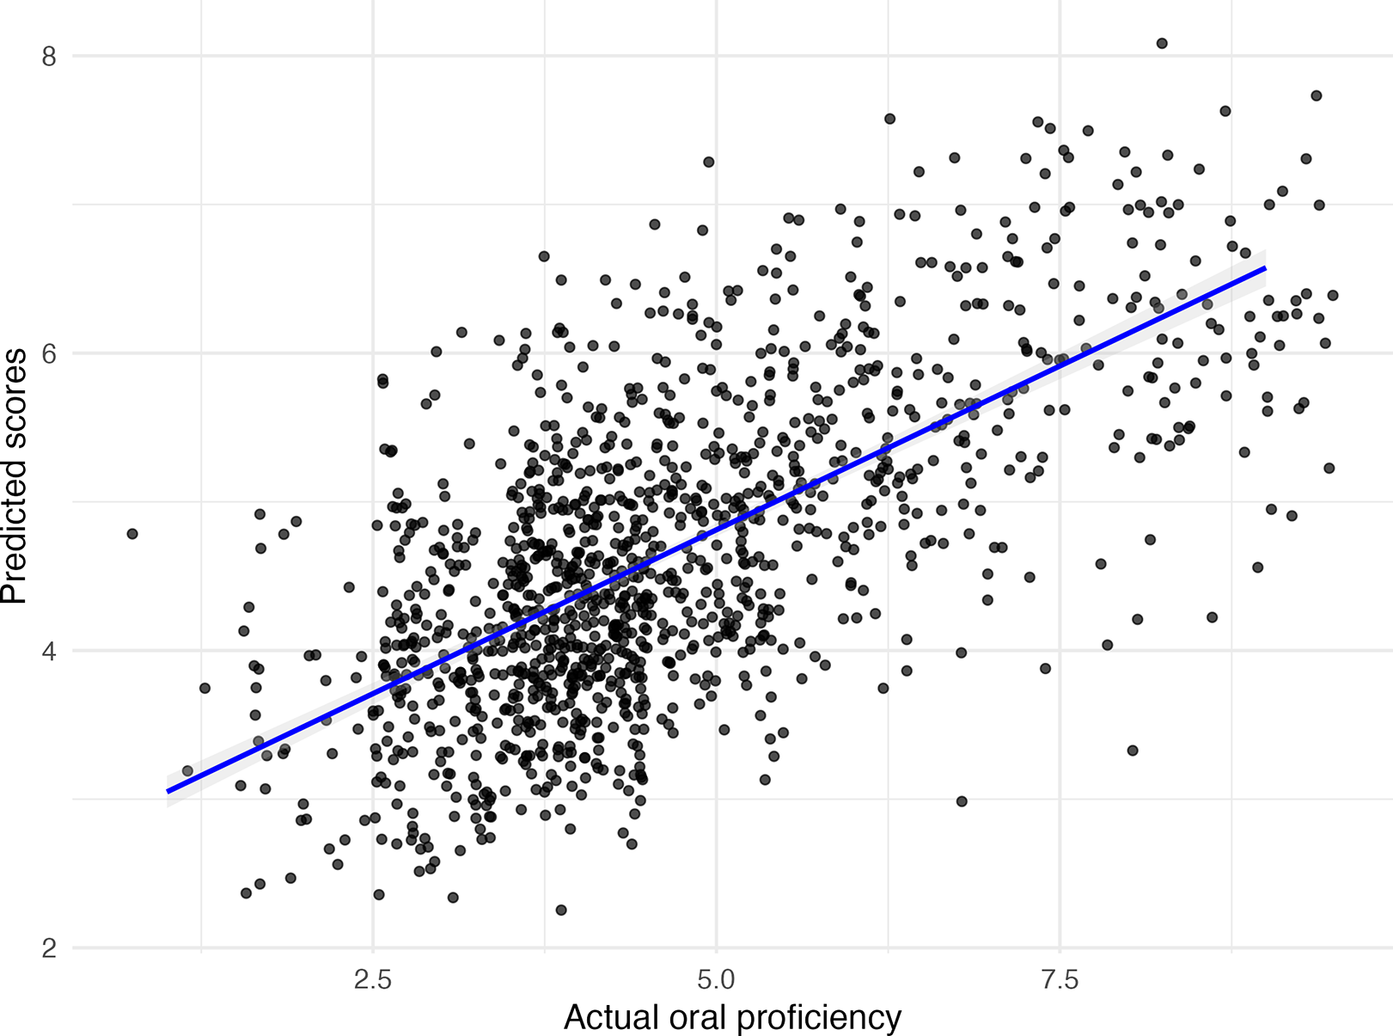
For RQ2, after filtering and multicollinearity checks, 18 indices entered the subset regression. Residuals appeared normally distributed (Q-Q plot). AIC-guided selection yielded a final model with 14 predictors (Table 14). Figure 4 plots predicted against actual proficiency scores.
Linear model predicting L2 oral proficiency scores using ASC-based indices

Actual L2 oral proficiency scores versus scores predicted by the best model (using 14 selected ASC-based indices).

The model’s residual SE is 1.183, with an R 2 value of .441 (adjusted R 2 = .435), indicating that approximately 44% of the variability in L2 oral proficiency scores is explained by the model. The F-statistic is 71.27 on 14 and 1,266 degrees of freedom, with a p value of < .001, indicating that the model is statistically significant. The correlation between the predicted scores and the actual scores, calculated as the square root of the R 2 value, is
 $ r=\sqrt{0.441}\approx 0.664 $
(strong positive correlation; Cohen, Reference Cohen1988).
RQ3
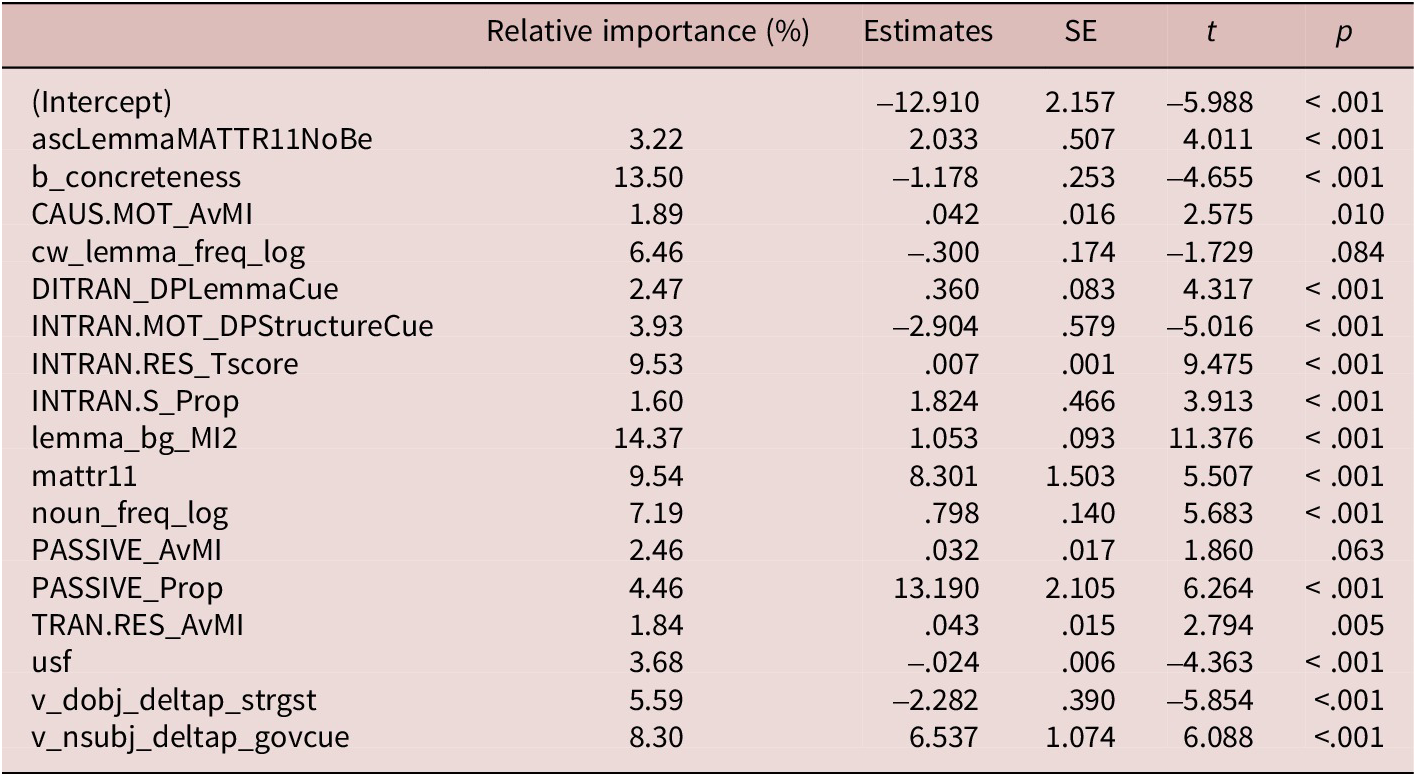
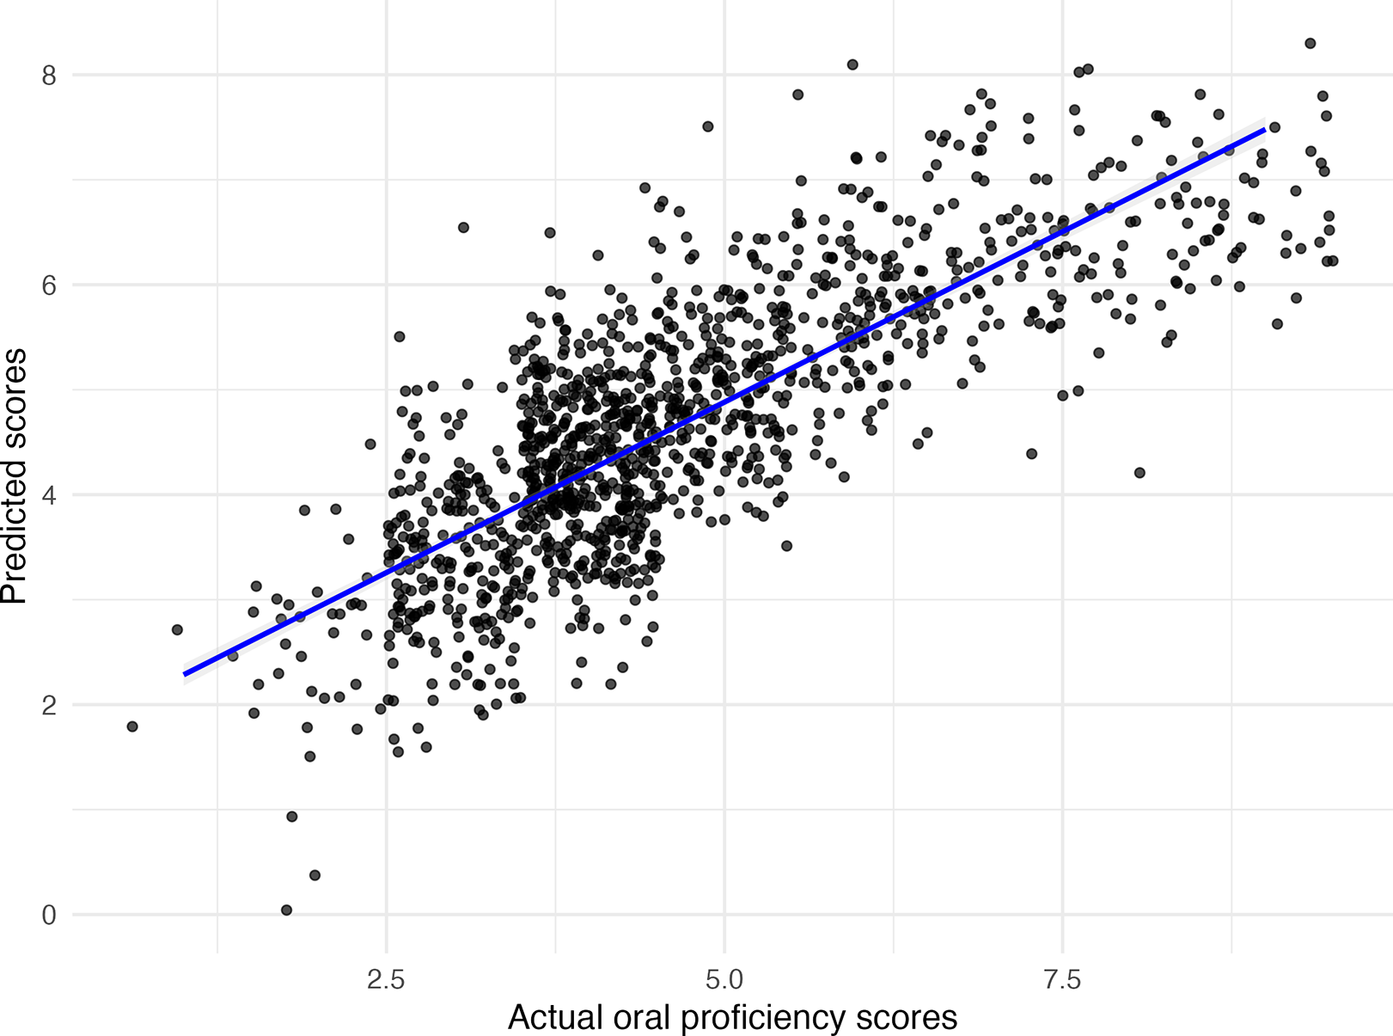
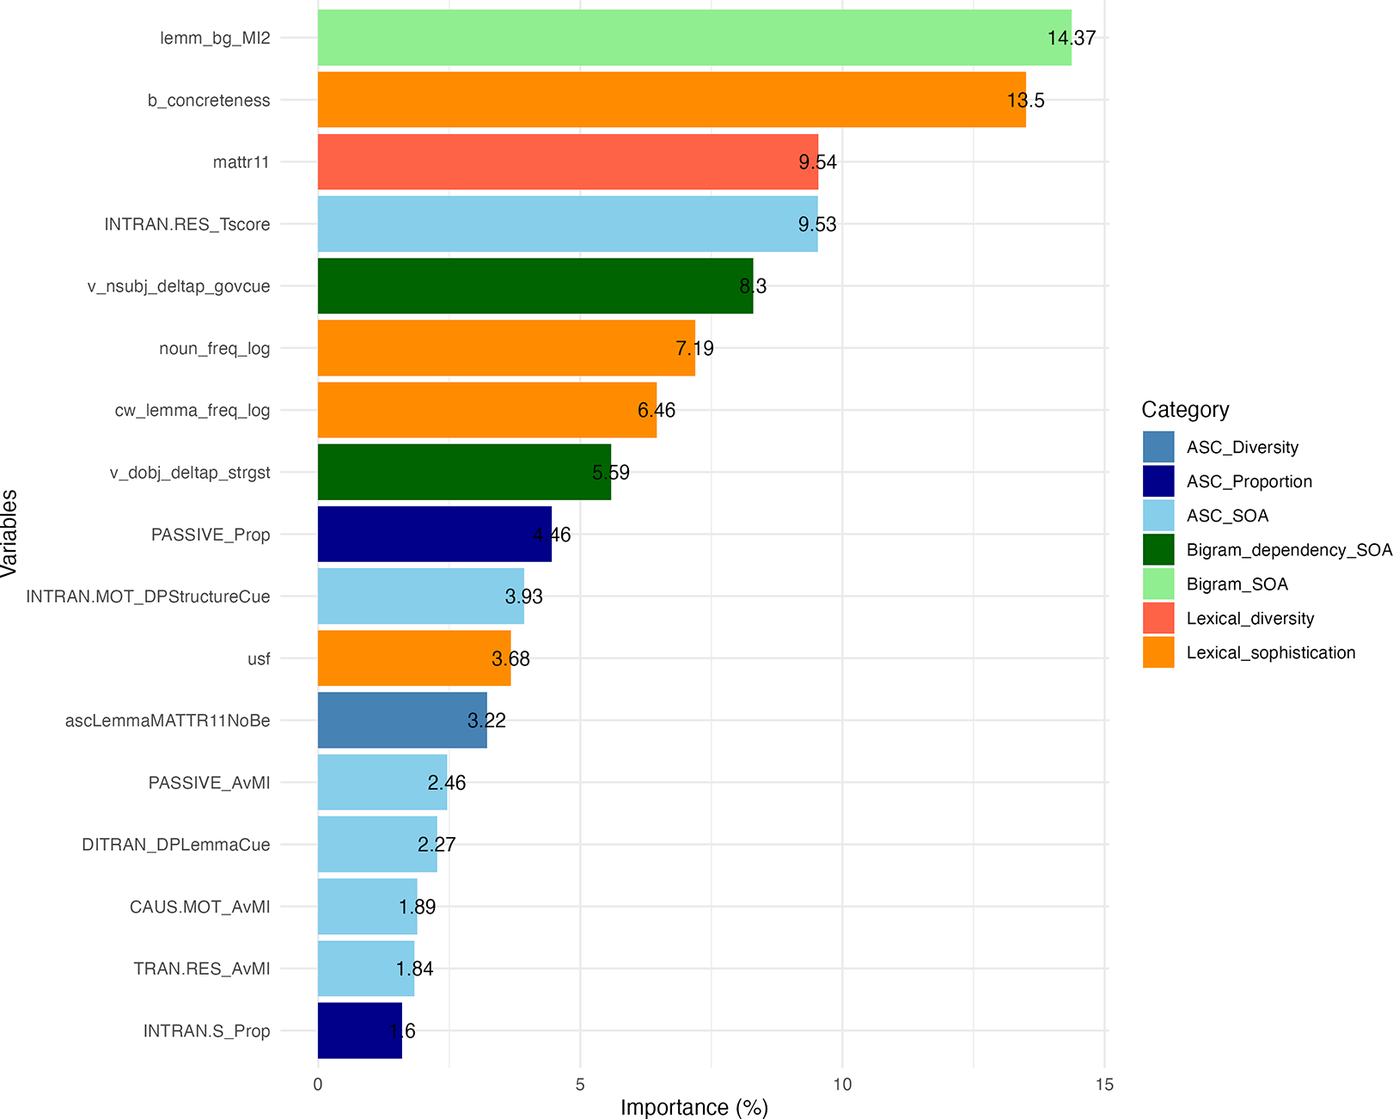
To address RQ3, we again built a subset linear regression incorporating both ASC-based and lexicogrammatical indices selected via statistical filtering. A Q–Q plot confirmed that the residuals met linearity assumptions. AIC-guided selection yielded a final model with 17 predictors (Table 15). Figure 5 plots predicted against actual proficiency scores, demonstrating close alignment, and Figure 6 displays each predictor’s relative importance by category.
Linear model predicting L2 oral proficiency scores using ASC-based + lexicogrammatical indices

Actual L2 oral proficiency scores versus scores predicted by the best model (using 17 selected ASC-based + lexicogrammatical indices).

Summary of the relative importance of each predictor (categorized by construct).

The model has a residual SE of .938 and an R 2 value of .650 (adjusted R 2 = .645), explaining approximately 65% of the variability in L2 oral proficiency scores. The F-statistic is 137.7 on 17 and 1,263 degrees of freedom (p < .001). The correlation between the predicted scores and the actual scores is
 $ r\approx .806 $
, which indicates a strong positive correlation (Cohen, Reference Cohen1988).
Discussion
RQ1
The overall results indicated that indices from each category exhibited small to moderate correlations with the proficiency scores. Detailed discussions for each type of index are provided below.
Diversity
The results indicated that more proficient speakers tended to use a wider variety of ASCs and ASC-verb lemma combinations, consistent with Kim and Ro’s (Reference Kim and Ro2023) findings on advanced L2 speakers in a 1-min opinion speaking task. While Kim and Ro measured diversity using log-transformed type frequency, which could have been influenced by text length (Kyle et al., Reference Kyle, Sung, Eguchi and Zenker2024), this study used the optimized MATTR to control for the text-length effect. Nonetheless, the same result was observed. Furthermore, ASC-verb lemma combinations excluding the verb “be” (ascLemmaMATTR11NoBe) showed the strongest correlation with proficiency scores, which suggests that the verb “be,” mostly used with attributive constructions, may not provide important information for modeling L2 proficiency, as it is often considerd a basic and frequent verb in language use (Housen, Reference Housen2008).
Proportion
The proportion indices support the finding that more proficient speakers tended to use a wider variety of constructions. Among these, intransitive resultative constructions (INTRAN.RES_Prop; e.g., “the wind got so strong”) showed the strongest positive correlation (r = .307), followed by passive (PASSIVE_Prop; e.g., “I was born in January”) and caused-motion constructions (CAUS.MOT_Prop; e.g., “I dropped my bag on the rail”), which also showed positive correlations (r = .291 and r = .216, respectively). These results echo Hwang and Kim’s (Reference Hwang and Kim2023) observation that higher L2 writing proficiency is associated with a greater use of complex constructions, even though this study’s focus is on a spoken domain. Notably, whereas Hwang and Kim identified the there-expletive construction as the strongest predictor of L2 writing proficiency, the use of intransitive resultative constructions is highlighted in this study. This discrepancy may stem from variations in genre, task type, or learner characteristics; however, the spoken domain might also be a critical factor, as it tends to favor succinct constructions like intransitive resultatives that support dynamic, interactive communication (Choi & Sung, Reference Choi and Sung2020).
Meanwhile, the proportion of transitive simple constructions (TRAN.S_Prop; e.g., “They explained what happened there”) exhibited the strongest negative correlation with proficiency (r = –.215), suggesting that reliance on more frequent, thus predictable, forms may indicate limited linguistic range. Other common structures, such as attributive (ATTR_Prop; e.g., “this is a kind of party”) and intransitive simple constructions (INTRAN.S_Prop; e.g., “what happened there”), showed negligible or weak correlations with proficiency (r = –.079 and r = .174, respectively).
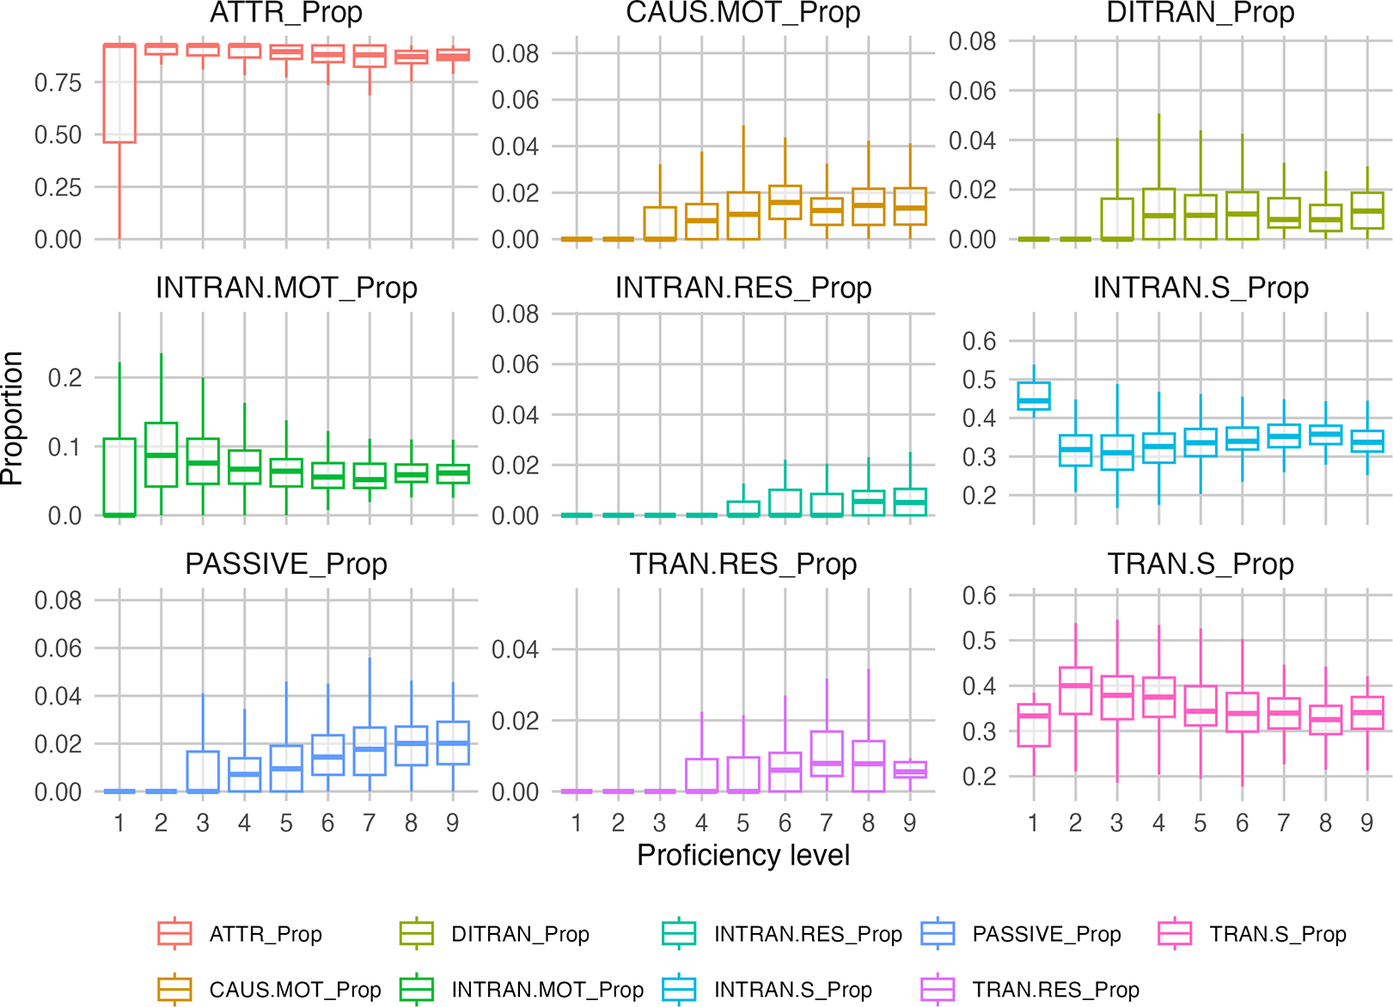
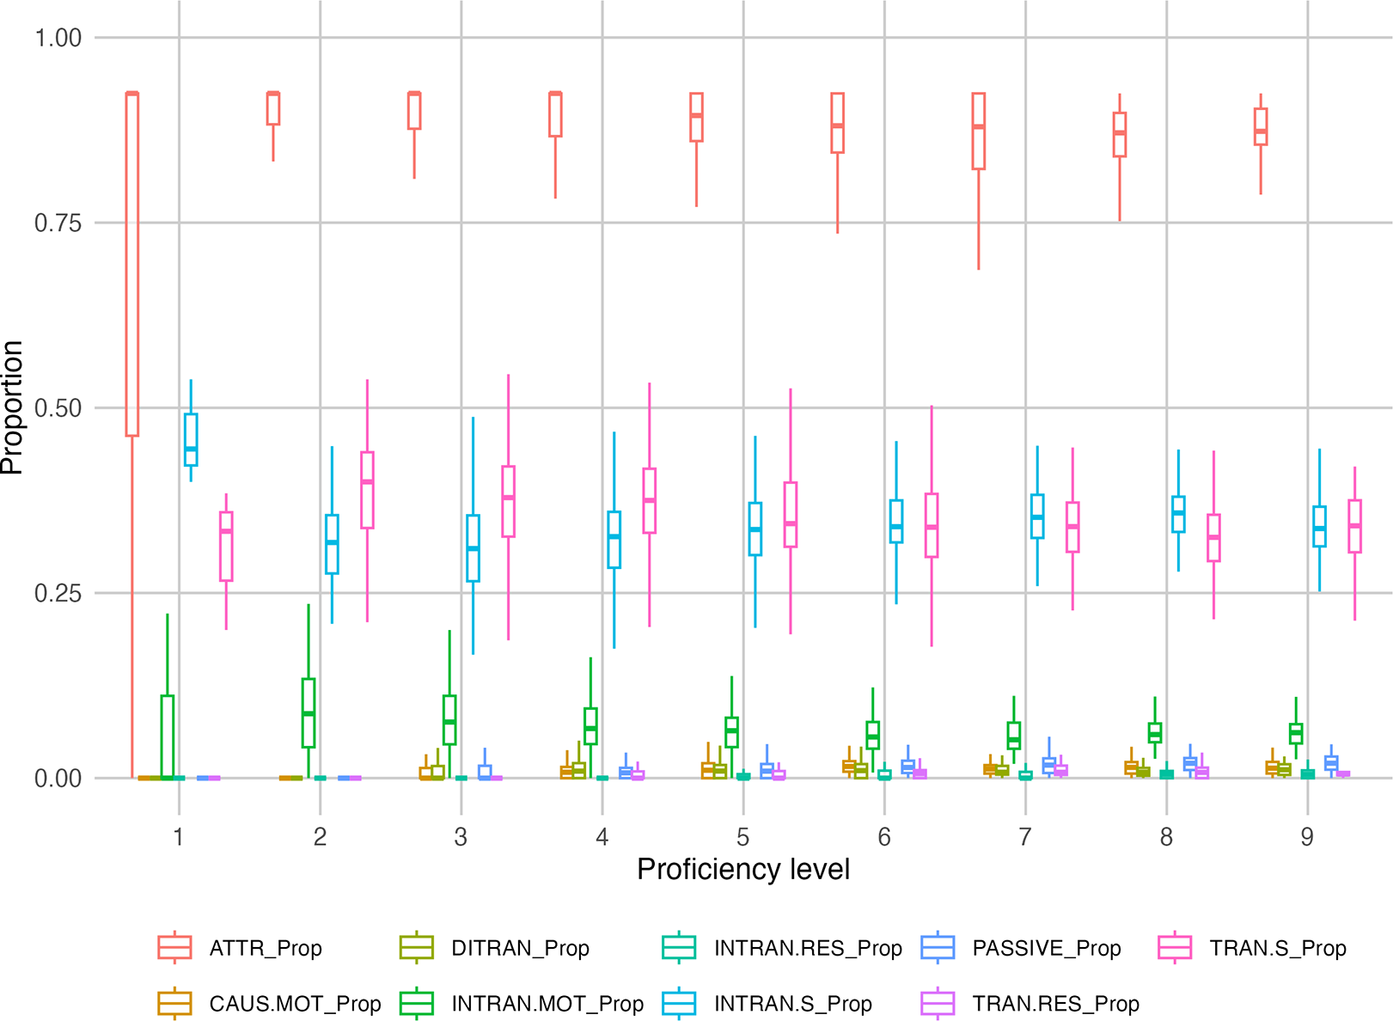
Additionally, the L2 speakers were divided into proficiency levels, and for each level we plotted the distribution of proportion indices using both variable y-axis scales (Figure 7) and a common scale (Figure 8) to compare ASC production. These figures show that, although more proficient speakers tended to employ a wider array of constructions and favor relatively “complex” ones, their speech remains dominated by attributive, simple transitive, and simple intransitive constructions. In other words, “simple” constructions are central across all proficiency levels, with only a subtle increase in the use of “complex” constructions among advanced speakers.
Distribution of proportion indices across proficiency levels (x-axis) with individual y-axis scales for each index.

Unified scale comparison of proportion indices across proficiency levels.

Frequency
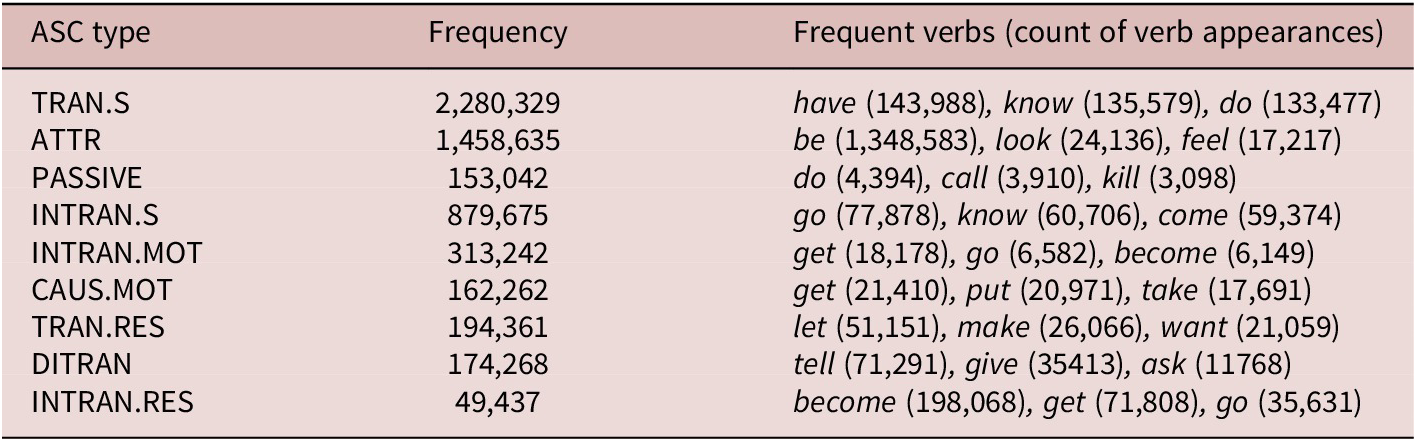
The results indicated that more proficient speakers tended to use less frequent ASCs (ascAvFreq, r = –.285) and, to a lesser extent, less frequent ASC-verb lemma combinations (ascLemmaAvFreq; r = –.105). In particular, they favored less common ASCs, such as intransitive, ditransitive, transitive resultative, and caused-motion constructions (Table 16), which aligns with the findings from the diversity and proportion indices.
Frequency data of ASC and ASC-verb combinations from the reference corpus

Usage-based approaches (Ellis, Reference Ellis2002; Tomasello, Reference Tomasello2005) propose that less proficient speakers rely on verbs that inherently encode the meaning of the ASC (e.g., “become” in intransitive resultatives; “give” in ditransitives) or on high-frequency light verbs, such as “have,” “do,” and “get.” Previous L2 writing studies (Kyle & Crossley, Reference Kyle and Crossley2017; Kyle et al., Reference Kyle, Crossley and Verspoor2021) found that advanced writers produced less frequent verb-construction combinations; however, this effect may be attenuated in spoken language, since even advanced speakers often use light verbs (Gilquin, Reference Gilquin2019; Kim & Rah, Reference Kim and Rah2019). For example, when describing a similar situation, an advanced speaker (Level 9) said, “When I first went INTRAN.MOT to America, I had TRAN.S a problem understandingTRAN.S the different sizes,” whereas a beginner speaker (Level 2) responded, “We went INTRAN.MOT to movie theater. We buyTRAN.S popcorn and coke at movie theater.” Moreover, advanced speakers sometimes embed ASCs within dependent or non-finite clauses headed by light verbs, an approach that does not necessarily increase the rarity of ASC-verb pairings. For example, with the verb “get,” an advanced speaker (Level 8) produced, “I got INTRAN.MOT on the train from that station [which nobody’s workingINTRAN.S there],” whereas a beginner (Level 2) produced simpler constructions such as, “which train I get INTRAN.MOT ,” in a similar context.
SOA
The results indicated that more proficient speakers tended to use verbs that were more strongly associated with specific ASC types, with small to medium positive correlations. This finding aligns with previous studies on VACs in L2 written production (Kyle & Crossley, Reference Kyle and Crossley2017; Liu & Lu, Reference Liu and Lu2024) and dependency bigrams in L2 spoken production (Kyle & Eguchi, Reference Kyle and Eguchi2023; Paquot, Reference Paquot2018; Rubin et al., Reference Rubin, Housen and Paquot2021). This trend was evident across most ASC types, except for the intransitive motion, where the association strength decreased with proficiency.
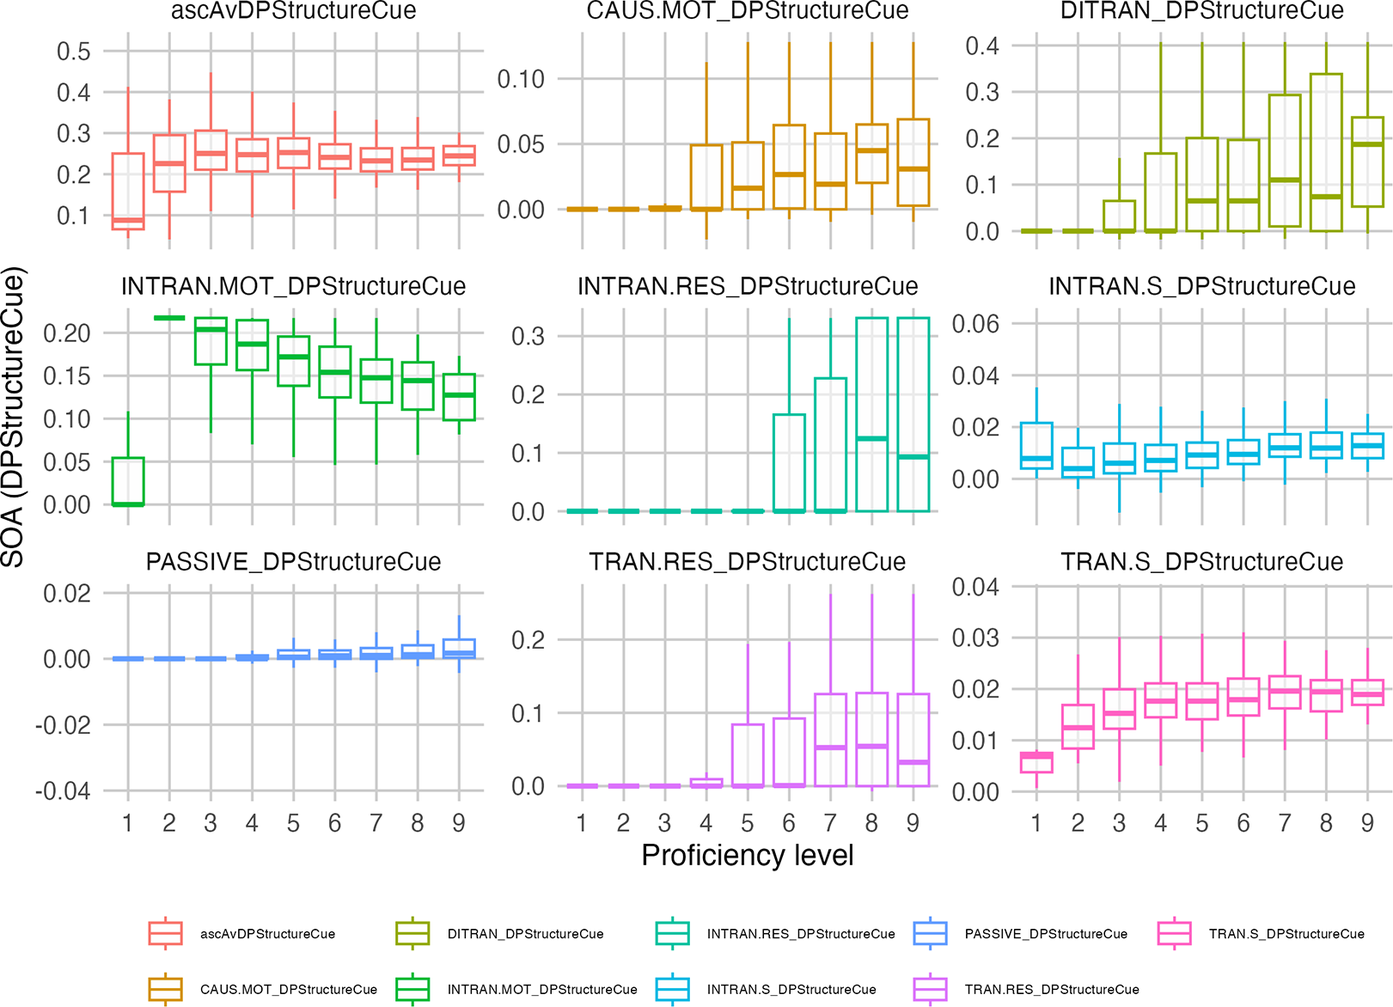
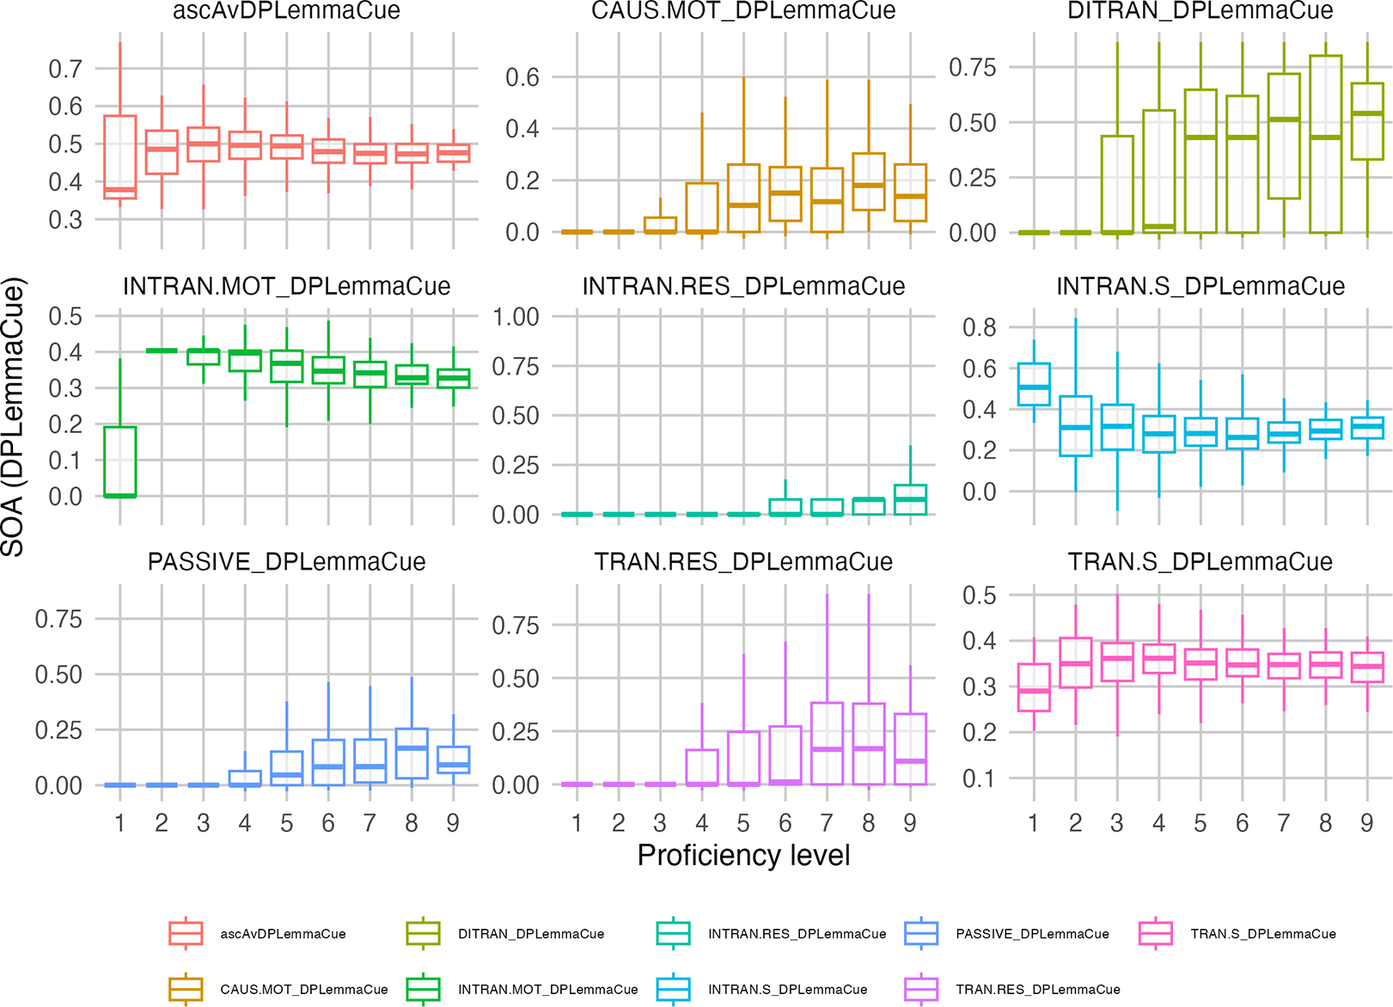
To further analyze the SOA indices, we plotted two DeltaP indices (i.e., DeltaPStructureCue, DeltaPLemmaCue) for each proficiency level (Figures 9, 10). Overall, more proficiency speakers tended to use verbs that were more strongly associated with the listed ASC types, while the opposite pattern was consistently found for the intransitive motion construction. One possible explanation is that the verb “go,” typically associated with intransitive motion, is increasingly replaced by less conventional verbs with metaphorical uses (but categorized as INTRAN.MOT; e.g., “talk to” or “explain to”), particularly among higher-proficiency speakers. These metaphorical uses, in which movement verbs express abstract concepts, may reflect higher language proficiency (Boas, Reference Boas2010; Talmy, Reference Talmy1985), although further investigation is warranted.
Distribution of SOA indices (DeltaPStructureCue) across proficiency levels (x-axis) with individual y-axis scales for each index.

Distribution of SOA indices (DeltaPLemmaCue) across proficiency levels (x-axis) with individual y-axis scales for each index.

RQ 2
The RQ2 explored how ASC-based indices explained the variance in L2 oral proficiency scores. Utilizing a multivariate linear regression model, we selected 14 indices, grouped into categories of ASC diversity, proportion, frequency and SOA, collectively accounting for 44% of the variability in these scores. Of these, SOA indices dominated (73.8% of total importance), underscoring the critical role of how ASCs and verbs integrate to realize meaning in the spoken domain. Proportion indices accounted for 13.1% and diversity indices for 7.9%, confirming that both the balance among construction types and their variety contribute meaningfully to proficiency. In contrast, frequency of individual ASC or ASC-verb lemma combinations mattered least (1.4%), suggesting that using less frequent ASCs or ASC-verb lemma combination offers little predictive power compared to how ASCs and verbs function together (SOA), how ASCs are distributed (proportion), and how varied they are (diversity).
Overall, this finding supports the validity of using ASC-based indices as measures of L2 oral proficiency (Choi & Sung, Reference Choi and Sung2020; Hwang & Kim, Reference Hwang and Kim2023; Kyle, 2016; Kyle & Crossley, Reference Kyle and Crossley2017; Kyle et al., Reference Kyle, Crossley and Verspoor2021; Kim et al., Reference Kim, Crossley and Kyle2018; Kim & Ro, Reference Kim and Ro2023; Li & Yu, Reference Liu and Lu2024)—a domain that has received relatively little attention with respect to ASC usage. Consistent with the usage-based approach to L2 acquisition, which holds that language learning emerges from usage patterns and frequency-based exposure, our results show that learners’ growing capacity to produce a diverse range of verbs and ASCs mirrors their developing grammatical proficiency. Moreover, by demonstrating that SOA measures explain a substantial portion of variance in oral proficiency, this study provides new insights into how constructions and verbs dynamically integrate in spontaneous speech.
RQ 3
The RQ3 examined how much variance in L2 oral proficiency could be explained by the comprehensive lexicogrammatical indices. These indices accounted for 65% of the variance —7 percentage points more than Kyle and Eguchi (Reference Kyle and Eguchi2023), who reported 58% explained by word- and bigram-level measures. However, 35% of the variance remains unexplained, echoing their recommendation to incorporate additional predictors (e.g., accuracy) to bolster explanatory power.
Overall, ASC-based indices not only capture learners’ use of clausal-level constructions but also improve explanatory power beyond established lexicogrammatical measures, enriching multivariate models of L2 oral proficiency and underscoring its multifaceted nature (Bulté & Roothooft, Reference Bulté and Roothooft2020; Eguchi & Kyle, Reference Eguchi and Kyle2020; Kim et al., Reference Kim, Crossley and Kyle2018; Kyle & Eguchi, Reference Kyle and Eguchi2023; Saito, Reference Saito2020; Yoon et al., Reference Yoon, Lu, Zechner, Evanini, Wang and Loukina2019).
Conclusion and limitations
This study leveraged a fine-tuned RoBERTa model to automate the extraction of ASCs and compute 50 ASC-based indices, each aiming to capture a different dimension of ASC use.
When applied to ACTFL-style oral interviews with Japanese learners of English, these ASC-based measures alone accounted for 44% of variance in human-rated speaking scores, validating their utility as reliable indicators of L2 oral proficiency. Adding them to established lexicogrammatical predictors boosted explanatory power by an additional 7 percentage points (up to 65%), underscoring the benefit of integrating clausal-level metrics into multivariate models of L2 speaking performance.
Despite these advances, several limitations warrant consideration. First, focusing solely on lexicogrammatical features excludes other critical facets of oral proficiency (e.g., fluency, pronunciation) that likely influence holistic ratings. Second, incorporating additional syntactic complexity measures, such as varied dependent-clause types or phrase-structure diversity, could capture a broader range of grammatical variation. Third, relying on automated ASC identification renders the methodology vulnerable to biases and errors in the underlying language model’s training data. Future work should refine the ASC-extraction pipeline and evaluate its robustness across diverse learner populations to ensure broader generalizability.
Acknowledgments
This research was supported by the Harold Gulliksen Psychometric Research Fellowship (2024–2025) at ETS.
Data availability statement
The experiment in this article earned Open Data and Open Materials badges for transparent practices. The materials and data are available at: https://osf.io/euqa9/