


%20--%3e%3c!DOCTYPE%20svg%20PUBLIC%20'-//W3C//DTD%20SVG%201.0//EN'%20'http://www.w3.org/TR/2001/REC-SVG-20010904/DTD/svg10.dtd'%3e%3csvg%20version='1.0'%20id='Layer_1'%20xmlns='http://www.w3.org/2000/svg'%20xmlns:xlink='http://www.w3.org/1999/xlink'%20x='0px'%20y='0px'%20width='64px'%20height='64px'%20viewBox='5.5%20-3.5%2064%2064'%20enable-background='new%205.5%20-3.5%2064%2064'%20xml:space='preserve'%3e%3cg%3e%3ccircle%20fill='%23FFFFFF'%20fill-opacity='0'%20cx='37.785'%20cy='28.501'%20r='28.836'/%3e%3cpath%20fill='%23595959'%20d='M37.441-3.5c8.951,0,16.572,3.125,22.857,9.372c3.008,3.009,5.295,6.448,6.857,10.314%20c1.561,3.867,2.344,7.971,2.344,12.314c0,4.381-0.773,8.486-2.314,12.313c-1.543,3.828-3.82,7.21-6.828,10.143%20c-3.123,3.085-6.666,5.448-10.629,7.086c-3.961,1.638-8.057,2.457-12.285,2.457s-8.276-0.808-12.143-2.429%20c-3.866-1.618-7.333-3.961-10.4-7.027c-3.067-3.066-5.4-6.524-7-10.372S5.5,32.767,5.5,28.5c0-4.229,0.809-8.295,2.428-12.2%20c1.619-3.905,3.972-7.4,7.057-10.486C21.08-0.394,28.565-3.5,37.441-3.5z%20M37.557,2.272c-7.314,0-13.467,2.553-18.458,7.657%20c-2.515,2.553-4.448,5.419-5.8,8.6c-1.354,3.181-2.029,6.505-2.029,9.972c0,3.429,0.675,6.734,2.029,9.913%20c1.353,3.183,3.285,6.021,5.8,8.516c2.514,2.496,5.351,4.399,8.515,5.715c3.161,1.314,6.476,1.971,9.943,1.971%20c3.428,0,6.75-0.665,9.973-1.999c3.219-1.335,6.121-3.257,8.713-5.771c4.99-4.876,7.484-10.99,7.484-18.344%20c0-3.543-0.648-6.895-1.943-10.057c-1.293-3.162-3.18-5.98-5.654-8.458C50.984,4.844,44.795,2.272,37.557,2.272z%20M37.156,23.187%20l-4.287,2.229c-0.458-0.951-1.019-1.619-1.685-2c-0.667-0.38-1.286-0.571-1.858-0.571c-2.856,0-4.286,1.885-4.286,5.657%20c0,1.714,0.362,3.084,1.085,4.113c0.724,1.029,1.791,1.544,3.201,1.544c1.867,0,3.181-0.915,3.944-2.743l3.942,2%20c-0.838,1.563-2,2.791-3.486,3.686c-1.484,0.896-3.123,1.343-4.914,1.343c-2.857,0-5.163-0.875-6.915-2.629%20c-1.752-1.752-2.628-4.19-2.628-7.313c0-3.048,0.886-5.466,2.657-7.257c1.771-1.79,4.009-2.686,6.715-2.686%20C32.604,18.558,35.441,20.101,37.156,23.187z%20M55.613,23.187l-4.229,2.229c-0.457-0.951-1.02-1.619-1.686-2%20c-0.668-0.38-1.307-0.571-1.914-0.571c-2.857,0-4.287,1.885-4.287,5.657c0,1.714,0.363,3.084,1.086,4.113%20c0.723,1.029,1.789,1.544,3.201,1.544c1.865,0,3.18-0.915,3.941-2.743l4,2c-0.875,1.563-2.057,2.791-3.541,3.686%20c-1.486,0.896-3.105,1.343-4.857,1.343c-2.896,0-5.209-0.875-6.941-2.629c-1.736-1.752-2.602-4.19-2.602-7.313%20c0-3.048,0.885-5.466,2.658-7.257c1.77-1.79,4.008-2.686,6.713-2.686C51.117,18.558,53.938,20.101,55.613,23.187z'/%3e%3c/g%3e%3c/svg%3e)
%20--%3e%3c!DOCTYPE%20svg%20PUBLIC%20'-//W3C//DTD%20SVG%201.0//EN'%20'http://www.w3.org/TR/2001/REC-SVG-20010904/DTD/svg10.dtd'%3e%3csvg%20version='1.0'%20id='Layer_1'%20xmlns='http://www.w3.org/2000/svg'%20xmlns:xlink='http://www.w3.org/1999/xlink'%20x='0px'%20y='0px'%20width='64px'%20height='64px'%20viewBox='5.5%20-3.5%2064%2064'%20enable-background='new%205.5%20-3.5%2064%2064'%20xml:space='preserve'%3e%3cg%3e%3ccircle%20fill='%23FFFFFF'%20fill-opacity='0'%20cx='37.637'%20cy='28.806'%20r='28.276'/%3e%3cg%3e%3cpath%20fill='%23595959'%20d='M37.443-3.5c8.988,0,16.57,3.085,22.742,9.257C66.393,11.967,69.5,19.548,69.5,28.5c0,8.991-3.049,16.476-9.145,22.456%20C53.879,57.319,46.242,60.5,37.443,60.5c-8.649,0-16.153-3.144-22.514-9.43C8.644,44.784,5.5,37.262,5.5,28.5%20c0-8.761,3.144-16.342,9.429-22.742C21.101-0.415,28.604-3.5,37.443-3.5z%20M37.557,2.272c-7.276,0-13.428,2.553-18.457,7.657%20c-5.22,5.334-7.829,11.525-7.829,18.572c0,7.086,2.59,13.22,7.77,18.398c5.181,5.182,11.352,7.771,18.514,7.771%20c7.123,0,13.334-2.607,18.629-7.828c5.029-4.838,7.543-10.952,7.543-18.343c0-7.276-2.553-13.465-7.656-18.571%20C50.967,4.824,44.795,2.272,37.557,2.272z%20M46.129,20.557v13.085h-3.656v15.542h-9.944V33.643h-3.656V20.557%20c0-0.572,0.2-1.057,0.599-1.457c0.401-0.399,0.887-0.6,1.457-0.6h13.144c0.533,0,1.01,0.2,1.428,0.6%20C45.918,19.5,46.129,19.986,46.129,20.557z%20M33.042,12.329c0-3.008,1.485-4.514,4.458-4.514s4.457,1.504,4.457,4.514%20c0,2.971-1.486,4.457-4.457,4.457S33.042,15.3,33.042,12.329z'/%3e%3c/g%3e%3c/g%3e%3c/svg%3e)
Strong geographical variations have been observed in the twinning rate (TWR). The TWR is high among people of African origin, intermediate among Europeans, and low among most Asiatic populations (Eriksson, Reference Eriksson1973). In Europe, there tends to be a progressive increase in the TWR from south to north, with a minimum around the Basque provinces on the border between Spain and France. The highest TWRs in Europe have been noted among the Nordic populations (Bulmer, Reference Bulmer1970; Eriksson, Reference Eriksson1964, Reference Eriksson1973; James Reference James1985). Furthermore, within larger populations some small isolated subpopulations have been identified to have extreme, mainly high, TWRs.
Fellman and Eriksson (Reference Fellman and Eriksson1990) examined the regional variation in the TWR in Finland for 1974–1983. Eriksson et al. (Reference Eriksson, Abbott, Kostense, Fellman, Iregren and Liljekvist1993) presented a detailed study of the secular changes in the Nordic countries of Denmark, Finland, and Sweden. In our studies of the regional variation of the TWR in Sweden, we have analyzed TWRs for the different counties (Eriksson & Fellman, Reference Eriksson and Fellman2004; Fellman & Eriksson, Reference Fellman and Eriksson2003, Reference Fellman and Eriksson2004, Reference Fellman and Eriksson2005a, Reference Fellman and Eriksson2009). In Fellman (Reference Fellman2016), the temporal variation in the Norwegian TWR was compared with corresponding trends in the neighboring Nordic countries of Iceland and Denmark.
Material and Methods
Materials
To evaluate the temporal variations in the TWR in Norway, we consider TWRs for 1900–2014 (Table 1). A deep trough can be found in 1960–1989. After 1990, a marked increase in the TWR is noted that cannot be explained by the slight increase in mean maternal age. The main cause of the recovery of the TWR is noted to be the influence of assisted reproductive technologies (ART) and particularly the use of fertility-enhancing drugs on the commonly noted dependence between maternal age and TWR (Fellman & Eriksson, Reference Fellman and Eriksson2005a). Therefore, model building of normal TWRs should be based on data obtained before 1960.
Temporal Variation in the Twinning Rate in Norway (1900–2014)

The study of the spatial variation in the TWR is based on data grouped according to the Norwegian counties for 1916–1926. The available data are presented in Table 2. We have considered a period for which the normal TWR rates are maximal. One may expect that the environmental and genetic differences have later disappeared and that the regional TWRs have converged towards a common low level. This may have influenced the TWR for 1960–1988.
Regional Twinning Rates in Norway (1916–1926) Grouped According to the Norwegian Counties (or Fylkes)

The latitudes and longitudes are the coordinates of the residences of the counties. The TWR is the observed TWR of the county, and TWR is the estimated TWR of the county according to model (5). For details, see the text.
Methods
We applied different spatial regression models to the regional TWRs. The map of Norway and its counties is presented in Figure 1. Following Fellman and Eriksson (Reference Fellman and Eriksson2009), the location of the counties is defined as the geographic coordinates of the corresponding residences. The coordinates for Norway are eastern longitude and northern latitude. The coordinates of the counties (residences) in Norway are also given in Table 2.
Map of Norway including the counties.

Multicollinearity
We analyzed the spatial variation in the TWR with alternative regression models. The regressand is the TWR in the different counties and the presumptive regressors are the longitude (meridian) M, and the latitude L, and the regressors of second order, M 2, L 2, and LM. The regressors M and L are defined as deviations from their national cluster means, and consequently, the intercepts obtained are the estimated TWRs in the center of the cluster.
The elongated or drawn-out format of Norway and the inclusion of the whole set of regressors, M, M 2, L, L 2, and LM, indicate that attention must be paid to the multicollinearity between the regressors. Concerning regional studies of Swedish twins, this was also observed by Fellman and Eriksson (Reference Fellman and Eriksson2009). The multicollinearity pattern can show marked variations. Therefore, different measures based on the eigenvalues of the correlation matrix have been proposed in the literature. In the review of the literature, Fellman (Reference Fellman1981) and Fellman and Eriksson (Reference Fellman and Eriksson2009) have given detailed presentations and analyses of different measures of multicollinearity. In the following, a short presentation is given.
Consider a set of variables (regressors) u 1, u 2, . . ., un and their correlation matrix
 $$\begin{equation}
{\bm{C}} = \left[ {\begin{array}{*{20}{c@{\quad}}} 1&{{c_{12}}}&{...}&{{c_{1j}}}&{...}&{{c_{1n}}}\\ {{c_{21}}}&1&{...}&{{c_{2j}}}&{...}&{{c_{2n}}}\\ .&.&.&.&.&.\\ {{c_{i1}}}&{{c_{i2}}}&{...}&{{c_{ij}}}&{...}&{{c_{in}}}\\ .&.&.&.&.&.\\ {{c_{n1}}}&{{c_{n2}}}&{...}&{{c_{nj}}}&{...}&1 \end{array}}\!\!\!\! \right],
\end{equation}$$
where cij = cor(ui, uj ). If the variables are mutually uncorrelated the correlation matrix equals the identity matrix
 $$\begin{equation}
{\bm{I}} = \left[ {\begin{array}{*{20}{c@{\quad}}} 1&0&{...}&0&{...}&0\\ 0&1&{...}&0&{...}&0\\ .&.&.&.&.&.\\ 0&0&{...}&1&{...}&0\\ .&.&.&.&.&.\\ 0&0&{...}&0&{...}&1 \end{array}}\!\!\!\! \right].
\end{equation}$$
The eigenvalues are obtained in the following way: Solve the equation
 $$\begin{eqnarray}
{\rm{det}}({\bm{C}} - {\bm{\lambda I}}) &=& {\rm{det}}\left[ {\begin{array}{*{20}{c@{\;\;}}} {1 - \lambda }&{{c_{12}}}&{...}&{{c_{1j}}}&{...}&{{c_{1n}}}\\ {{c_{21}}}&{1 - \lambda }&{...}&{{c_{2j}}}&{...}&{{c_{2n}}}\\ .&.&.&.&.&.\\ {{c_{i1}}}&{{c_{i2}}}&{...}&{{c_{ij}}}&{...}&{{c_{in}}}\\ .&.&.&.&.&.\\ {{c_{n1}}}&{{c_{n2}}}&{...}&{{c_{nj}}}&{...}&{1 - \lambda } \end{array}} \!\!\!\!\right]\nonumber\\
& =& 0.
\end{eqnarray}$$
This equation is an algebraic equation of degree n. Consequently, it has n roots λ1, λ2, . . ., λ n , which are the eigenvalues of the matrix C . For every correlation matrix, the roots are real and non-negative and ∑ n i = 1λ i = n. We number the roots such that 0 ⩽ λ1 ⩽ λ2 ⩽ . . . ⩽ λ n . If the variables are uncorrelated, the correlation matrix is a unit matrix and all the eigenvalues equal one. If there are marked correlations between the variables, one speaks about multicollinearity and there are small eigenvalues. The multicollinearity causes reduced accuracy in the estimates. If λ1 = 0, then at least one exact linear relation between the regressors can be found and the correlation matrix is singular and not all parameters are estimable.
Fellman (Reference Fellman1981) discussed the pros and cons of the different multicollinearity measures. He stated that a good measure should satisfy the following conditions: (a) the measure defines a critical level above (or below) which the corresponding correlation matrix should be considered strongly multicollinear; (b) the measure can be used for comparisons between different correlation matrices.
These properties imply that the measure must be (at least in a loose sense) ‘monotonic’ and the effect of the dimension of the matrix on the measure should not be too great. The measures of multicollinearity were also discussed in Fellman and Eriksson (Reference Fellman and Eriksson2009).
In Table 3, we present some commonly used measures of collinearity and their basic properties. The simplest measure is the inverse of the minimum eigenvalue m 1 = λ−1 1. In the uncorrelated case, m 1 = 1, but with increasing multicollinearity λ1 → 0 and m 1 increases towards infinity.
Definitions of Some Measures of Multicollinearity

The measures m3, m 4 and m 8 were chosen for this study. For details, see the text.
The next measure, proposed by Wichern and Churchill (Reference Wichern and Churchill1978) and Casella (Reference Casella1980), is
 ${m_2} = \frac{{{\lambda _n}}}{{{\lambda _1}}}$
. This is defined as the condition number of the matrix. In the uncorrelated case, m
2 = 1 and with increasing multicollinearity m
2 increases towards infinity.
The determinant of the correlation matrix,
 ${m_3} = \det (C) = {\lambda _1}\lambda {}_2 \cdot \cdot \cdot {\lambda _n}$
, has also been used as a measure of multicollinearity. In the uncorrelated case, m
3 = 1, but with increasing multicollinearity m
3
decreases towards zero.
Mahajan et al. (Reference Mahajan, Jain and Bergier1977) and Lawless (Reference Lawless1978) considered the sum
 ${m_4} = \sum {\frac{1}{{{\lambda _i}}}} $
. For uncorrelated variables, its value is n. With increasing multicollinearity, it increases towards infinity.
Thisted (Reference Thisted1980) suggested two measures,
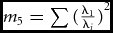 ${m_5} = \sum {{{( {\frac{{{\lambda _1}}}{{{\lambda _i}}}} )}^2}} $
and
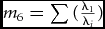 ${m_6} = \sum {( {\frac{{{\lambda _1}}}{{{\lambda _i}}}} )} $
. These measures satisfy the inequalities 1 < m
5 ⩽ m
6 ⩽ n. The equality signs hold only in the orthogonal case. For uncorrelated variables, these measures obtain the value n, and when the multicollinearity increases they converge towards one.
The measure
 ${m_7} = {\sum {( {\frac{n}{{{\lambda _i}{m_4}}} - 1} )} ^2}$
was introduced by Vinod (Reference Vinod1976). It is zero for complete orthogonal systems, but according to Vinod the components in the sum will be large for non-orthogonal data. However, the value of m
7 depends greatly on the relative proportions between the eigenvalues and does not satisfy the assumption of a monotone function.
The measure
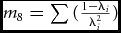 ${m_8} = \sum {( {\frac{{1 - {\lambda _i}}}{{\lambda _i^2}}} )} $
was introduced by Fellman (Reference Fellman1981), who presented arguments for its suitability as a multicollinearity measure and proved that m
8 ⩾ 0, with equality in the orthogonal case, and that
 $\mathop {lim}_{{\lambda _1} \to 0} {m_8} = \infty $
.
The measures m 1 and m 2 are simple to handle, but their weakness is that they are mainly based on the smallest eigenvalue. Hence, any other small eigenvalues are almost ignored. The measure m 3 depends strongly on the dimension of the matrix and is suitable only for matrices with low dimension. The advantage of m 4 over m 1 and m 2 is that it takes into account the effect of several small eigenvalues. In addition, one can show that mathematically it has an evident connection with the estimation problem. Thisted (Reference Thisted1980) recommended m 5 in estimation and m 6 in prediction situations. The main criticism against these measures is that they can be used if there is one extremely small eigenvalue, but if there are several small eigenvalues the measure is rather worthless. The measure m 7 is useful only if we are dealing with a correlation matrix with only one small eigenvalue.
When we consider the variables M, M 2, L, L 2, and LM, the dimension is low and several small eigenvalues may exist. Consequently, m 3, m 4, and m 8 could be recommended and used in this study.
Results
Temporal Trends
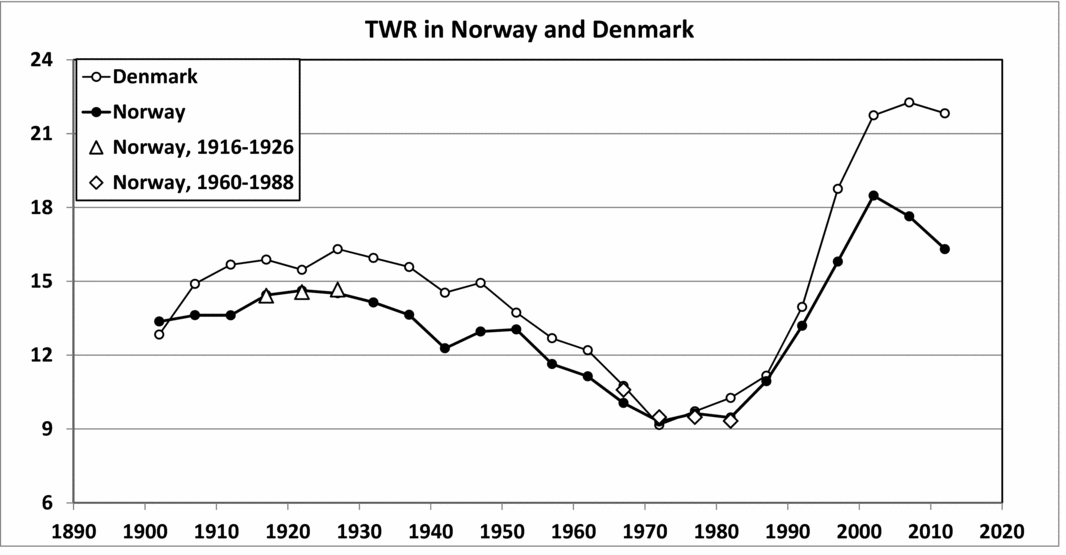
The temporal variation in the TWR in Norway (1900–2014) is presented in Figure 2. The TWR shows strong fluctuations. One observes that the TWR is rather constant until the 1950s, but there is a maximum in the 1910s and 1920s. There is a marked trough in the 1970s. After that, there is an increase up to the maximum 18.05 per 1,000 in 2000–2009. The main cause of this recovery of the TWR seems to be the influence of ART (Fellman & Eriksson, Reference Fellman and Eriksson2005a). A slight decrease in the TWR can be observed after 2009. Such recaptures can also be observed in other studies and are explained by improved treatment techniques in order to avoid multiple maternities. For sake of comparison, the TWR for Denmark is included in Figure 2. The temporal trends for the TWRs in both countries are similar. The temporal trend of the seasonality in the TWR in Norway is discussed in Fellman and Eriksson (Reference Fellman and Eriksson1999). More detailed studies of the TWR and general demographic studies of Denmark can be found in Eriksson and Fellman (Reference Eriksson and Fellman1999); Fellman and Eriksson (Reference Fellman and Eriksson2005a); and Fellman (Reference Fellman2015).
Temporal variation in the twinning rate in Norway (1900–2014). Note: The ∆ symbol indicates data analyzed in the regional study. The ◇ symbol indicates late regional data. For comparison sake, the TWR for Denmark is included in the figure. The temporal trends for the TWRs in both countries are similar.
Regional Variation
The data during the periods 1916–1926 and 1960–1988 were used in the study of the regional heterogeneity, and these data are indicated in Figure 2. In Table 2, we have presented the TWR distributed over the Norwegian counties for 1916–1926. When we applied a χ2 test of the regional variation for the period 1916–1926, we obtained χ2 = 56.8 with 17 degrees of freedom and p < .001, indicating statistically significant variations. Below, we follow Fellman and Eriksson (Reference Fellman and Eriksson2009) and build spatial models of the regional variations.
We controlled as a check the regional TWRs for 1960–1988 (Table 4) and for this period found no significant regional variations (χ2 = 21.59 with 18 degrees of freedom, p > .05). Our results indicate that for these two periods spatial models can only be applied in the data set for 1916–1926. These findings can be compared with the results obtained by Fellman and Eriksson (Reference Fellman and Eriksson2005b) that the regional TWRs for Sweden converged from 1750 to 1960 towards a common low level.
Regional Data in Norway for the Period 1960–1988.

The elongated/drawn-out format of Norway suggests that we consider the multicollinearity in the regional models for Norway. We calculated the correlation coefficients between the TWR and the regressors M, M 2, L, L 2, and LM. The correlation matrix is given in Table 5. For the correlation matrix of the regressors, we obtain λ1 = 0.00175, λ2 = 0.11089, λ3 = 0.15308, λ4 = 0.44883, and λ5 = 4.28945. One eigenvalue is extremely small and at least two can be considered rather small.
Correlation Coefficients Between TWR and Regressors for the Norwegian Data

A strong multicollinearity can be identified among the regressors.
The multicollinearity measures for our Norwegian data are presented in Table 6 and a strong multicollinearity is obvious. Below, we define the optimal model consisted of the regressors M and M2 that we accept as optimal. For the regressors in this model, the multicollinearity is markedly reduced. Now, the two eigenvalues are λ1 = 0.168015 and λ2 = 1.831985. The corresponding multicollinearity measures for this reduced model are also included in Table 6. A comparison of the values of m 3, m 4, and m 8 shows how much stronger the multicollinearity is for the larger model. Moving from the large model to the small, m 3 increases from 0.0000566 to 0.307801, and m 4 and m 8 decrease from 590.4 to 6.50 and from 327166 to 29.2, respectively. Table 6 includes the Swedish data given by Fellman and Eriksson (Reference Fellman and Eriksson2009). One observes that the multicollinearity in the Norwegian data is markedly stronger than in the Swedish data.
Multicollinearity Measures m3, m4 and m8 for Our Norwegian Data

One can observe that the multicollinearity for the optimal model is markedly reduced and can be ignored. As a comparison, we include Swedish data presented in Fellman and Eriksson (Reference Fellman and Eriksson2009). The Norwegian data show markedly stronger multicollinearity.
Regression Models
First we build the linear regression model for the total set of regressors. The obtained model is:
 $$\begin{eqnarray}
{\rm{TWR}} &=& 15.007 + 0.15197\,M + 0.00975\,L + 0.00090\,{M^2}\nonumber\\
&& +\; 0.03401\,{L^2} - 0.04957\,LM.
\end{eqnarray}$$
The goodness of fit of the model, measured with the adjusted coefficient of determination, is
 ${\bar{R}^2} = 0.080$
, indicating a bad fit. This is supported by the low model test value F = 1.298. None of the parameter estimates is statistically significant.
When we tried to improve the regional variation with different combinations of north and south trends, no model gave a good fit, but all abridged models reduced the multicollinearity. The best model obtained was a linear and a quadratic west-east model that contains the regressors Mand M 2. The estimated model is:
 $$\begin{equation}
{\rm{TWR}} = 15.12362 + 0.15482\,M - 0.01461\,{M^2}.
\end{equation}$$
The M2
parameter is significant and the M parameter is almost significant. The standard errors are
 $S{E_{\hat{\alpha }}} = 0.280353,$
 $S{E_{{{\hat{\beta }}_M}}} = 0.076354,$
and
 $S{E_{{{\hat{\beta }}_{{M^2}}}}} = 0.005334$
. The adjusted coefficient of determination is
 ${\bar{R}^2} = 0.251$
and the test statistics F = 3.855. Hence, the model is markedly better than Equation (4), but the goodness of fit for Equation (5) is only slight. However, this model having a west-east trend has to be accepted as the optimal model. This model indicates the tendency of a central maximum for M = 5.298, and the value decreases in both western and eastern directions (cf. Figure 3). In fact, attempts to improve the model by including M-terms of higher degree were quite fruitless.
Associations between regional TWRs (1916–1926) and the optimal model. Note: A slight east-western effect of second degree can be found. This model indicates the tendency of a central maximum and decreases in both western and eastern directions. The TWRs for the central counties show values divergent from the model. This finding explains the slight goodness of fit. Attempts to improve the model by including M-terms of higher degree were quite fruitless. Two level curves are included in the figure.

We have explained the TWR with the geographical coordinates, and consequently, the pattern of the level curves is simple. If we assume that model (5) holds, we can then obtain parabolic level curves for the TWR. Let TWR 0 = R be a constant value, then the equation of the corresponding level curve is β M M + β M 2 M 2 + α − R = 0, indicating a parabola with a vertical axis and the opening to the south. Furthermore, the axis obtained for the longitude is independent of the chosen TWR level. According to the parameter estimates, the axis corresponds to the longitude = 16.45° E. Summing up, we consider Equation (5) as the best model, and the TWR estimates obtained are included in Table 2 and presented in Figure 4. For R = 0 the level curve generates model (5).
Observed and estimated regional TWRs. Note: The counties are ordered according to increasing observed TWRs. The estimated TWRs are based on model (5). The low goodness of fit discussed in the text can be observed in this figure.

Discussion
The analyses of the spatial models for Norway indicate that horizontal trends have to be considered. Counties with low TWR values can be found in the western counties of Hordaland and Rogaland and in the north-eastern county of Troms. The central counties show higher TWR levels, but also strong discrepancies from the model (cf. Figure 3). Therefore, our findings corroborate the weak results observed in the spatial modeling.
The low regional variation of the TWRs for 1960–1988 supports the finding that the regional TWRs for Sweden converged during the period from 1750 to 1960 towards a common low level (Fellman & Eriksson, Reference Fellman and Eriksson2005b).
Comparisons of the multicollinearity in this Norwegian study and in the study of Sweden presented in Fellman and Eriksson (Reference Fellman and Eriksson2009) show that the multicollinearity is markedly stronger in Norway than in Sweden. This is obviously a result of the fact that the two countries are almost of the same length, but Norway is much slimmer than Sweden. Furthermore, the spatial study of the TWR in Sweden yielded more successful spatial models than this study of the regional TWRs in Norway.
James (Reference James1985) observed a positive correlation coefficient (Spearman's) between the age-standardized TWR and latitude. He wondered whether this association of photoperiodicity with latitude is relevant. As alternative factors, he suggested diet (milk consumption) and birth weight. Bulmer (Reference Bulmer1970) has speculated that geographical variation in dizygotic TWRs in Europe may have some genetic basis. However, James (Reference James1985) stated that there is no reason to suppose that genetic clines in the Old World have been duplicated in the New World and the fact that the latitudinal variation in DZ twinning and birth weight are similar in Europe and the United States suggests an environmental rather than a genetic cause.
Acknowledgments
This work was supported by grants from The Finnish Society of Sciences and Letters and the Magnus Ehrnrooth Foundation.


 Open access

