

Introduction
As more research in broiler nutrition progresses, we gain more understanding regarding the different factors that influence growth performances. Much of the research uses univariate optimisation, wherein the researcher holds all nutrients at or above published requirements, except for the nutrient being studied. A potential problem with this is that varying one factor can also affect other factors. For example, studies in lysine (Lys) requirements would generally hold other amino acids at or above NRC (1994) recommended levels while varying the level of Lys. As Lys levels in the diet is increased, other variables, such as feed intake, can change, thus changing the intake of other nutrients confounding the estimate being made (Sklan and Noy, Reference SKLAN and NOY2004, Sterling et al., Reference STERLING, PESTI and BAKALLI2003). Another issue is that as the level of Lys increases, antagonism with another amino acid ensues. This could inadvertently affect the estimate for Lys requirement. This is evident in the variation in estimates for amino acid requirements, even for the same age group.
An alternative experimental design to circumvent these hurdles involves multivariate optimization, where multiple nutrients are studied simultaneously. Multivariate studies open new avenues for the exploration of potential interaction effects and information from such studies can be used to create response surfaces which graphically show how these nutrients interact. This review will focus on the relative efficiency of multivariate designs, such as the Box-Behnken Design (BBD), compared to a Full Factorial Design and how BBD can be applied in amino acid requirement study in broilers.
Relative efficiency of multivariate designs
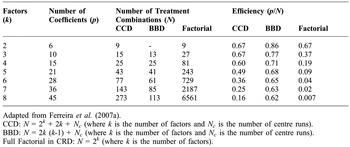
Ferreira et al. (Reference FERREIRA, BURNS, FERREIRA, MATOS, DAVID, BRANDÃO, DA SILVA, PORTUGAL, DOS REIS, SOUZA and DOS SANTOS2007a) compared the relative efficiency of Box-Behnken Design (BBD), Central Composite Design (CCD) and Doehlert Design. He did this by dividing the number of coefficient in the second order model with the number of treatment combination needed per number of factors being tested. Table 1 shows a modified table done by Ferreira et al. (Reference FERREIRA, BURNS, FERREIRA, MATOS, DAVID, BRANDÃO, DA SILVA, PORTUGAL, DOS REIS, SOUZA and DOS SANTOS2007a) including a Full Factorial Design.
Comparison of Efficiency of BBD, CCD and Full Factorial Design in CRD

Adapted from Ferreira et al. (Reference FERREIRA, BURNS, FERREIRA, MATOS, DAVID, BRANDÃO, DA SILVA, PORTUGAL, DOS REIS, SOUZA and DOS SANTOS2007a).
CCD: N = 2k + 2k + N c(where k is the number of factors and Nc is the number of centre runs).
BBD: N = 2k (k-1) + Nc (where k is the number of factors and Nc is the number of centre runs).
Full Factorial in CRD: N = 2k (where k is the number of factors).
Table 1 shows that, as the number of factors increase, the number of treatment combinations increases. The increase is exponential for the full factorial design. Relative efficiency is highest for the Box-Behnken design and least for the full factorial design. This demonstrates that there is a big drop in efficiency in Full Factorial Designs as the number of factors being studied increases (Ferreira et al., Reference FERREIRA, BURNS, FERREIRA, MATOS, DAVID, BRANDÃO, DA SILVA, PORTUGAL, DOS REIS, SOUZA and DOS SANTOS2007a).
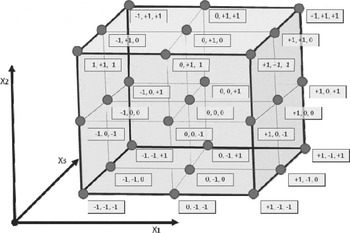
Sakkas et al. (Reference SAKKAS, ISLAM, STALIKAS and ALBANIS2010) and Ferreira et al. (2007b) specified that the first step in multivariate analysis is choosing the appropriate design of the experiment (DOE). They mentioned four possible DOE that can be employed: Full Factorial Design, Central Composite Design, Box-Behnken Design and a Doehlert design. FFD are good in preliminary identification of important factors but as shown in Table 1, as the number of factors being studied increases so will the number of treatment combinations in an exponential manner. Many of the treatment points in a factorial design are exploring an area that is already contained by the highest and lowest level of the treatment combinations. For example, a full factorial design with three factors with three equally spaced levels will result in 27 treatment combinations or design points. Graphically, these 27 design points can be illustrated as shown in Figure 1. We see that the 27 treatment combinations designated as blue points in the figure form a cubic structure. The space bounded by the treatment combinations is the area where the response is being measured and it is assumed that within that space or region of exploration lies the desired response, whether it be a minimum or maximum point, this is under the assumption that the levels chosen for the minimum and maximum levels of the factor is known to produce the maximum or minimum desired response.
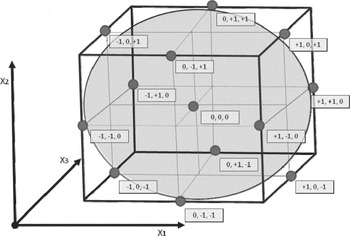
Full factorial designs are the backbone of the BBD. In BBD they simply take out specific design points from a Full Factorial Design that are not necessary for optimisation. For example, Figure 2 shows a graphical representation of a BBD. In this figure, we are also exploring the same space as in Figure 1 but the design points at the edge of the cube are taken out in the design. The reason being is that, at the edge of the region of experimental exploration, the factor levels are either too high or too low and because of this we expect that the optimum response may not be contained within that region.
Three dimensional space created by the 33 Factorial Arrangement of Treatments in a Completely Randomized Design. The desired response can be estimated within this space, that is assuming that the combination of the levels chosen for the 3 factors being studied contain the desired response.

The obvious advantage of the BBD is that it uses less treatment combinations but this is not useful if the researcher is interested in exploring extreme responses to factors. Factorial designs are very useful for preliminary studies to identify important factors affecting a desired response (Sakkas et al., Reference SAKKAS, ISLAM, STALIKAS and ALBANIS2010; Sereshti et al., Reference SERESHTI, KARIMI and SAMADI2009 and Ferreira et al., Reference FERREIRA, BURNS, FERREIRA, MATOS, DAVID, BRANDÃO, DA SILVA, PORTUGAL, DOS REIS, SOUZA and DOS SANTOS2007a). It could also be used as a tool to estimate treatment levels or combinations that would produce a desired response. Subsequently, BBD could be used to optimise the factors.
Box-Behnken Design (BBD)
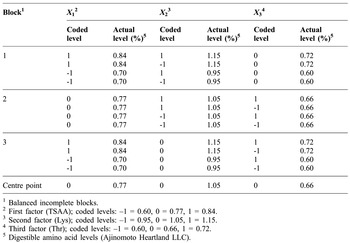
This design requires at least three factors used at three different levels. Though it can be used to explore more than three factors, it is simpler to use when it is used to test three factors. The design matrix involves the forming of a balanced incomplete block design, where two factors are paired in a 2 × 2 factorial manner while the third factor is held at the centre point (Table 1). The centre point of the design is the estimated level of a factor (based on previous research) that would yield the optimum response for a particular response variable being measured. Three balanced incomplete blocks are formed. These three incomplete blocks would generate 12 unique design points. A 13th design point is then added. This 13th design point is the treatment where all the three factors are held at the centre point. This is called the centre run. This centre point is usually replicated three to five times because it would determine the degrees of freedom of the model (Myers and Montgomery, Reference MYERS and MONTGOMERY1995). It would act as the reference point in the experimental region. The stability of the whole design resides on the stability of the centre run. The design is spherical (Figure 2). It is spherical because the levels of the factors are evenly spaced from the centre point.
Three dimensional space explored by a 3 factor, 3 level BBD. It is based on a 33 Factorial Arrangement of Treatments in a Completely Randomized Design, the only difference is that all the points at the corner of the factorial design are taken out because it is assumed that the desired response is not in that region.

Application of the BBD for amino acid requirement optimisation for broilers
In a study, De Leon et al. (Reference DE LEON, CORZO, ROUSH and and KIDD2006) estimated Lys, total sulphur amino acids (TSAA) and threonine (Thr) requirements for 15 to 35 d old broilers using a BBD. Nine hundred and thirty-five Ross × Ross 308 broiler males were allotted to 85 floor pens at d 1. Birds were fed common diets to d 15. At d 15, the digestible amino acids used in the experiment ranged from 0.95, 1.05 and 1.15 % for Lys; 0.70, 0.77and 0.84 % for TSAA; 0.60, 0.66, and 0.72 % for Thr (Table 2). Centre point levels chosen were 1.05% Lys, 0.77% for TSAA and 0.66 % for Thr. The thirteen treatment combinations were replicated five times. A common corn and soybean meal diet was used. Analyzed amino acid levels of corn and soybean meal were utilized for linear programming formulation. Diets contained 3,175 kcal ME/kg and were adequate or surplus in nutrients except Lys, TSAA and Thr (NRC, 1994). At d 30, the dependent variables taken were weight gain (Y 1), feed intake (Y 2), feed:gain (Y 3), carcass weight (Y 4), carcass yield (Y 5), front half weight (Y 6), front half yield (Y 7), back half weight (Y 8), back half yield (Y 9), abdominal fat weight (Y 10), abdominal fat percentage (Y 11) and mortality (Y 12).
Design matrix for Experiment 1, displaying the different levels of digestible Lys, TSAA, and Thr fed to broilers from 15 to 35 d of age.

1 Balanced incomplete blocks.
2 First factor (TSAA); coded levels: –1 = 0.60, 0 = 0.77, 1 = 0.84.
3 Second factor (Lys); coded levels: –1 = 0.95, 0 = 1.05, 1 = 1.15.
4 Third factor (Thr); coded levels: –1 = 0.60, 0 = 0.66, 1 = 0.72.
5 Digestible amino acid levels (Ajinomoto Heartland LLC).
Quadratic (Y 2, Y 3, Y 5, Y 7, Y 10 and Y 11) and cross product (Y 6 and Y 9) differences (P<0.05) were detected. Response surface methodology (RSM) predicted maximal response (%) levels of dietary amino acids (Lys, TSAA, Thr) for: Y 2, 1.13, 0.93 and 0.83, respectively; Y 3, 1.07, 0.77 and 0.65, respectively; Y 5, 1.01, 0.78 and 0.68, respectively; Y 7, 1.00, 0.78 and 0.67, respectively; Y 10, 1.08, 0.79 and 0.66, respectively; and Y 11, 1.06, 0.81 and 0.70, respectively. Cross-product digestible amino acid interactions for Y 6 and Y 9 resulted in TSAA and Thr to Lys ratios of 0.72 and 0.67, and 0.75 and 0.66, respectively.
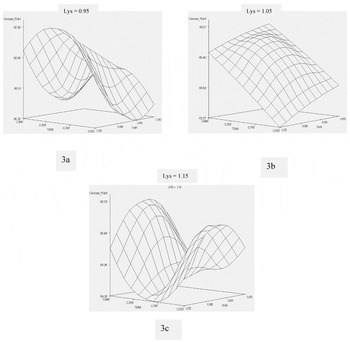
De Leon et al. (Reference DE LEON, CORZO, ROUSH and and KIDD2006) used RSM to show that increasing digestible Lys levels in the diet increased the requirement for digestible TSAA and Thr to maximize carcass yield (Figure 3a, 3b and 3c).
Surface plot of carcass yield, from broilers fed varying levels of Lys, TSAA, and Thr from 15 to 35 d of age.

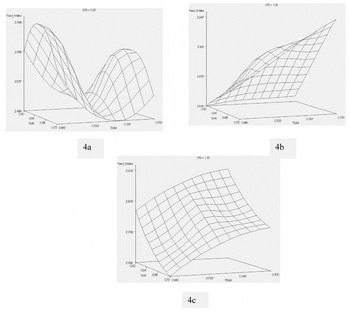
This increase in requirement for TSAA and Thr are reflected in the increase in feed intake as Lys levels are increased (Figure 4a, 4b and 4c). RSM was also used to predict recommended levels for digestible Lys, TSAA and Thr for an optimised performance. Predicted recommended levels for digestible Lys, TSAA and Thr were 1.08, 0.75 and 0.67, % respectively.
Surface plot of Feed Intake, from broilers fed varying levels of Lys, TSAA and Thr from 15 to 35 d of age.

Conclusions
Box-Behnken Design is a good alternative to the standard Full Factorial Designs in broiler nutrition research because it uses less treatment combinations, thus making it more efficient and allows the experimenter to optimise processes and explore interrelationships between variables in a process.