Success in the social world hinges upon our ability to decipher and infer the hidden beliefs, emotions, and intentions of others; a process commonly known as ‘theory of mind’. Indeed, a large body of research has demonstrated that our ability to understand others’ mental states is associated with a variety of positive social outcomes including increased popularity (Slaughter et al., Reference Slaughter, Imuta, Peterson and Henry2015), improved interpersonal rapport (Blatt et al., Reference Blatt, LeLacheur, Galinsky, Simmens and Greenberg2010; Todd et al., Reference Todd, Bodenhausen, Richeson and Galinsky2011), prosocial behavior (Imuta et al., Reference Imuta, Henry, Slaughter, Selcuk and Ruffman2016), positive evaluations of the perspective-taker (Goldstein et al., Reference Goldstein, Vezich and Shapiro2014), and the well-being of perspective-taking recipients (Dodell-Feder et al., Reference Dodell-Feder, Felix, Yung and Hooker2016), among many other outcomes (Todd and Galinsky, Reference Todd and Galinsky2014). In contrast, difficulty with mental state understanding and disruption to its neural bases is associated with a variety of negative outcomes, including friendlessness (Fink et al., Reference Fink, Begeer, Peterson, Slaughter and de Rosnay2015), social amotivation and isolation (Dodell-Feder et al., Reference Dodell-Feder, DeLisi and Hooker2014a, Reference Dodell-Feder, Tully, Lincoln and Hooker2014b), and risk for severe psychiatric illness, such as schizophrenia-spectrum disorders (Kim et al., Reference Kim, Shin, Jang, Kim, Shim, Park, Hong and Kwon2011). These findings are even more sobering when considering the robust relationships among social isolation, psychiatric illness, and mortality (Holt-Lunstad et al., Reference Holt-Lunstad, Smith, Baker, Harris and Stephenson2015; Walker et al., Reference Walker, McGee and Druss2015). Thus, the health consequences of MSU are not to be ignored.
For these reasons, the importance of valid and reliable assessments of MSU cannot be overstated. Failure to detect MSU impairments could lead researchers and clinicians to overlook etiological factors, fail to identify someone at risk leading them on a path toward mental and physical health decline, or incorrectly conclude that a treatment is efficacious when it is not. On the other hand, detecting impairments when they do not exist could lead researchers and clinicians on a wayward path of research to elucidate a specious causal pathway, misidentify someone as being at-risk for psychopathology leading to stigma and unnecessary and costly interventions, or incorrectly conclude that a treatment is not efficacious when it is. Said simply, inaccurate MSU assessment may carry deleterious consequences for every area of clinical research, including the study of etiology, risk, and treatment.
Do we have valid and reliable assessments of MSU? In light of the assessment issues highlighted above and their potential consequences, this question has appropriately been taken up by several initiatives at the National Institute of Mental Health (NIMH; National Advisory Mental Health Council Workgroup on Tasks and Measures for RDoC, 2016; Pinkham et al., Reference Pinkham, Harvey and Penn2018) who define MSU as ‘The ability to make judgments and/or attributions about the mental state (intentions, beliefs, desires, emotions) of other animate entities that allows one to predict or interpret their behaviors’ (National Advisory Mental Health Council Workgroup on Tasks and Measures for RDoC, 2016), placing it at the nexus of theory of mind, social perception (i.e. decoding and interpreting social information), and emotion processing (i.e. perceiving emotions) (Pinkham et al., Reference Pinkham, Penn, Green, Buck, Healey and Harvey2014). The answer to this question, as per the NIMH (National Advisory Mental Health Council Workgroup on Tasks and Measures for RDoC, 2016), is unclear. What is clear is that there are favorite measures among researchers assessing MSU. Likely the most widely used task to assess MSU is the Reading the Mind in the Eyes Task (RMET; Baron-Cohen et al., Reference Baron-Cohen, Wheelwright, Hill, Raste and Plumb2001a), which is also the current NIMH recommended task for assessing mental and emotional perspective-takingFootnote 1Footnote † as detailed in a 2016 report by the National Advisory Mental Health Council Workgroup on Tasks and Measures for Research Domain Criteria (RDoC; National Advisory Mental Health Council Workgroup on Tasks and Measures for RDoC, 2016). In the RMET, participants view 36 black-and-white photographs, originally selected from magazine articles, of solely the eyes of Caucasian female and male actresses/actors. Participants decide which of four adjectives (e.g. panicked, incredulous, despondent, interested) best describes the mental state being expressed in the eyes with the correct answer having been generated through consensus ratings. As of early 2018, the paper detailing the revised version of the test (Baron-Cohen et al., Reference Baron-Cohen, Wheelwright, Hill, Raste and Plumb2001a) has been cited close to 1900 times (Web of Science); the RMET has been translated into at least 24 different languages (https://www.autismresearchcentre.com/arc_tests), reflecting its widespread, international use; the RMET is used more than any other measure of MSU in the psychopathology literature (see the following meta-analyses on schizophrenia: Bora et al., Reference Bora, Yucel and Pantelis2009; Bora and Pantelis, Reference Bora and Pantelis2013; bipolar disorder: Bora et al., Reference Bora, Bartholomeusz and Pantelis2016; and autism: Chung et al., Reference Chung, Barch and Strube2014) as well as other fields of study (Dodell-Feder and Tamir, Reference Dodell-Feder and Tamir2018); the RMET is often used in neuroimaging studies of MSU (Molenberghs et al., Reference Molenberghs, Johnson, Henry and Mattingley2016); and the RMET has been used in clinical trials (Anagnostou et al., Reference Anagnostou, Soorya, Chaplin, Bartz, Halpern, Wasserman, Wang, Pepa, Tanel, Kushki and Hollander2012). Taken together, well over a decade of research on MSU has largely been based on findings from this task.
What explains the popularity of the RMET? In addition to being quick to administer and highly tolerable by participants (Pinkham et al., Reference Pinkham, Harvey and Penn2018), exhibiting sensitivity to clinical impairment, and having its neural bases well-studied, it is often considered to represent an ‘advanced test’ (Baron-Cohen et al., Reference Baron-Cohen, Wheelwright, Spong, Scahill and Lawson2001b, p. 241) of MSU as it requires participants to decode nuanced facial expressions and match them to a lexicon of nuanced intrapersonal states. As an ostensible consequence of the task's complexity, it has minimal ceiling effects (Olderbak et al., Reference Olderbak, Wilhelm, Olaru, Geiger, Brenneman and Roberts2015; although see Black, Reference Black2018), which often plague other MSU tasks (see Dodell-Feder et al., Reference Dodell-Feder, Lincoln, Coulson and Hooker2013 for a brief discussion). That said, inspection of the task reveals some potential issues. For example, task performance is moderately-to-strongly associated with vocabulary (Olderbak et al., Reference Olderbak, Wilhelm, Olaru, Geiger, Brenneman and Roberts2015), IQ (Baker et al., Reference Baker, Peterson, Pulos and Kirkland2014), and educational attainment (Warrier et al., Reference Warrier, Grasby, Uzefovsky, Toro, Smith, Chakrabarti, Khadake, Mawbey-Adamson, Litterman, Hottenga, Lubke, Boomsma, Martin, Hatemi, Medland, Hinds, Bourgeron and Baron-Cohen2018); perhaps unsurprising given the complex and uncommon vocabulary used as response options (e.g. aghast, tentative). Additionally, the mental states of the target are actually unknown, and consensus scoring leaves open the possibility that accuracy depends on sharing social norms and beliefs regarding how mental states may be expressed in eyes with the consensus raters (Johnston et al., Reference Johnston, Miles and McKinlay2008). In a similar vein, most of the female stimuli depict young women who are wearing cosmetic products, and revealing a limited number of gender normative mental statesFootnote 2 in a way that may be very different to how women are depicted in other cultures. These concerns are borne out in research revealing sociocultural differences in RMET performance (Adams et al., Reference Adams, Rule, Franklin, Wang, Stevenson, Yoshikawa, Nomura, Sato, Kveraga and Ambady2010; Prevost et al., Reference Prevost, Carrier, Chowne, Zelkowitz, Joseph and Gold2014). Of course, the RMET is not unique in these respects. Other MSU tasks suffer from many of the same issues (Corcoran et al., Reference Corcoran, Mercer and Frith1995; McDonald et al., Reference McDonald, Flanagan, Rollins and Kinch2003; Dodell-Feder et al., Reference Dodell-Feder, Lincoln, Coulson and Hooker2013) through reliance on verbal ability, the use of racially/ethnically homogenous stimuli, or the depiction of social scenarios in which participants may come to a very different understanding of the characters, not because of poor MSU ability, but because of cultural differences in how they understand the broader social context (see Kohler et al., Reference Kohler, Turner, Bilker, Brensinger, Siegel, Kanes, Gur and Gur2003 for an example in which the issue of stimulus race/ethnicity is appropriately dealt with; see Nisbett, Reference Nisbett2004 for a general discussion of cultural differences in cognition). That said, all of these issues are present in the RMET, and the available evidence suggests that performance on this task may be particularly affected by factors that are associated with social class (i.e. education, IQ) and culture (i.e. race, ethnicity).
Here, leveraging four massive web-based datasets of the RMET and other social and non-social cognitive tasks, totaling over 40 000 international, native- or primarily English-speaking participants, we evaluate whether and to what extent performance on social cognitive tasks, and the RMET in particular, is influenced by demographic and sociocultural factors, including age, gender, education, ethnicity, and race. Said otherwise, we ask whether performance on these tasks is contaminated by sociodemographic factors associated with class and culture, among other factors. In doing so, we hope to inform efforts aimed at identifying, creating, and disseminating valid and reliable measures for the assessment of constructs that may be used in future diagnostic systems.
Participants completed one of five measures: (1) the original RMET (RMET-36), (2) a shortened version of the RMET (RMET-16; described in the Methods), (3) a measure of emotion identification requiring participants to label the emotions of multiracial stimuli (henceforth, ‘multiracial emotion identification’), (4) a measure of emotion discrimination requiring participants to make same/different judgments regarding the emotions expressed in Caucasian faces, and (5) digit symbol matching, which is a non-social, non-verbal measure of processing speed tapping visual working memory and sensorimotor speed.
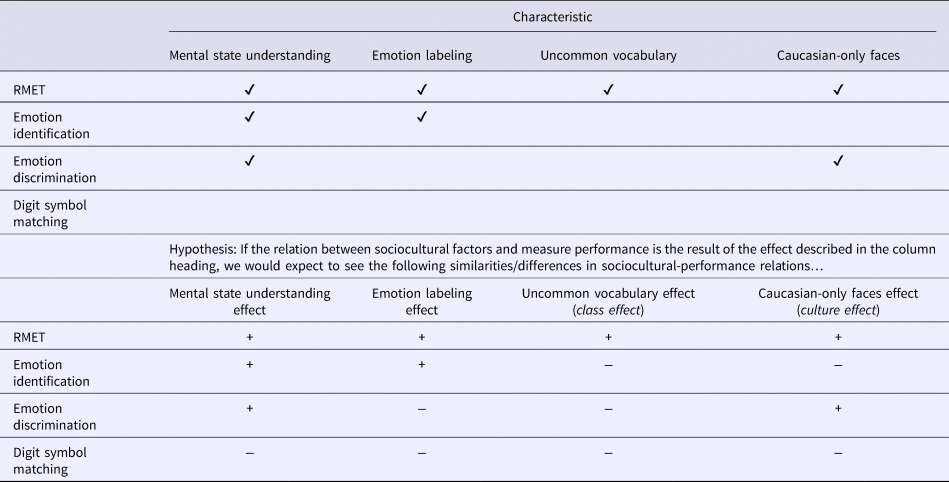
To understand how task characteristics might impact the relationship between sociocultural factors and MSU performance, we selected four tasks that differed in stimulus and task parameters, including racial diversity of faces and reliance on vocabulary. This allowed us to test several possibilities regarding the influence of sociocultural factors on MSU performance (Table 1); that is, whether the relations between sociocultural factors and measure performance is the result of the measure being (a) social (RMET, multiracial emotion identification, emotion discrimination) v. non-social (digit symbol matchingFootnote 3), (b) requiring emotion labeling (RMET, multiracial emotion identification) v. no emotion labeling (emotion discrimination, digit symbol matching), (c) using uncommon vocabulary (RMET) v. common vocabulary/no vocabulary (multiracial emotion identification, emotion discrimination, digit symbol matching)Footnote 4, and (d) using Caucasian-only (RMET, emotion discrimination) v. non-Caucasian-only or no face stimuli (multiracial emotion identification, digit symbol matching).
Measure characteristics and hypotheses

A check-mark indicates the presence of the column characteristic. Shared + /− symbols indicates that the relation between sociocultural factors and measure performance is expected to be similar if the column hypothesis is supported.
To evaluate the aforementioned possibilities, we compared effect size relationships between task performance and different demographic and sociocultural characteristics across tasks, including age, gender, education, ethnicity, and race.
Methods
Participants
Participants were an international sample of 40 248 native or primarily English-speaking Internet-users between the ages of 10 and 70 (M = 29.5, s.d. = 14.36; 57.3% female) who visited the non-profit research initiative website TestMyBrain.org between 2010 and 2017 (Table 1). Most participants were from countries in which the majority of the population is English-speaking and White/European (i.e. USA, Canada, Great Britain, Ireland, Australia, New Zealand, n = 31310, 77.8%; n = 6085, 15.1% were from non-predominantly White/English-speaking countries; no data were available for n = 2853, 7.1% of participants).
No explicit recruitment was performed. Instead, participants come to TestMyBrain.org through search engine results, social-networking websites, or by word of mouth. As such, the participants represent a non-random sample leaving open the possibility of self-selection effects. However, prior research using TestMyBrain.org has shown that the data are reliable and comparable in terms of quality to data collected in the laboratory (Germine et al., Reference Germine, Nakayama, Duchaine, Chabris, Chatterjee and Wilmer2012), and mirror findings from nationally representative, population-based samples (Hartshorne and Germine, Reference Hartshorne and Germine2015), suggesting that the potential impact of self-selection effects is likely to be minor.
Prior to completing one of the measures described below, participants provided informed consent/assent by electronically signing a form in a manner approved by the Harvard University Committee on the Use of Human Subjects in Research. Since the public nature of the research platform means that requirements of parental consent cannot be validated, and given concerns that any additional requirements related to age may lead to false self-reported age (e.g. giving an age that permits full participation or reduces participant burden; Boyd et al., Reference Boyd, Hargittai, Schultz and Palfrey2011), the protocol was designed such that participants giving an age <18 were directed to measures that were deemed to be minimal risk for minors and otherwise not required to obtain parental consent (e.g. the measures used in the current study). This consent procedure has been in place since 2009 with no adverse events reported. After completing one of the measures, participants voluntarily provided demographic and sociocultural information including age, gender, education, ethnicity, and race. No personal identifying information was collected in order to avoid social desirability responding. A subset of the participants included in the current study have been included in other published studies (Germine and Hooker, Reference Germine and Hooker2011; Hartshorne and Germine, Reference Hartshorne and Germine2015).
Measures
Reading the Mind in the Eyes Task
In the RMET (RMET-36), participants are presented with 36 pictures of solely the eye region from white actors and actresses taken from magazine photographs. Participants are instructed to select which of four adjectives best describes what the person in the picture is thinking or feeling. Each item is scored as correct or incorrect; thus, scores can range from 0 to 36. The RMET's psychometric properties have been well-studied. On reliability, internal consistency is typically poor, although test-retest reliability estimates are generally acceptable (Olderbak et al., Reference Olderbak, Wilhelm, Olaru, Geiger, Brenneman and Roberts2015). On validity, RMET scores tend to correlate with scores on other measures of social cognition (Olderbak et al., Reference Olderbak, Wilhelm, Olaru, Geiger, Brenneman and Roberts2015), differentiates clinical groups with well-documented social cognitive impairments (e.g. schizophrenia, autism) from healthy participants (Chung et al., Reference Chung, Barch and Strube2014), and is predictive of functioning in clinical samples (Pinkham et al., Reference Pinkham, Harvey and Penn2018).
One possibility is that prior findings relating RMET performance to sociocultural factors is the result of task heterogeneity; that is, while performance for most stimuli load onto a single MSU-related factor that is relatively unbiased, there may also exist low-quality items that tap more into education and sociocultural biases (e.g. items with complicated vocabulary words), which might also account for the relatively low internal reliability of the task. Based on analyses by Olderbak et al. (Reference Olderbak, Wilhelm, Olaru, Geiger, Brenneman and Roberts2015), we took a subset of 16 items from the RMET that load most strongly onto a single common factor which we might assume a priori indices MSU performance, and had part of our sample complete this 16-item version of the RMET (RMET-16), which represents a more homogeneous stimulus set.
Multiracial Emotion Identification Task
The multiracial emotion matching task is an emotion identification task where the participant has to indicate whether each of a set of 48 faces is happy, sad, angry, or fearful. Faces represent a broad range of adult ages and race/ethnicities, with approximately equal proportions of men and women.
All tasks have been used in other studies and are described elsewhere, except for the Multiracial Emotion Identification Task. To develop this task, we recruited actors from across a range of ages and races/ethnicities, from the Boston Company One theater, as part of the Act Out for Brain Health project. Boston Company One theater has a mission of engaging the city's diverse communities, with an emphasis on diverse actors. Images were taken from video clips of actors portraying different emotions. An initial set of 146 images were selected portraying anger, fear, happiness, sadness, and neutral facial expressions to create an item bank. Images were drawn from this item bank and data were collected from a development sample of N = 8309 participants who each saw a subset of 37–53 images. Ultimately, the neutral condition was dropped as these faces were judged with significantly (ps < 0.01) poorer reliability than anger, fear, sadness, and happiness (average correlation with rest of items for each emotion category: anger: r = 0.3; fear: r = 0.26; sadness: r = 0.2; happiness: r = 0.25; neutral: r = 0.06). The reliability of judgments of other emotions did not significantly differ from each other (ps > 0.1). The final test includes 48 images that were selected to capture (1) images with consistent judgments of a single emotion, (2) varying levels of difficulty for each emotion, and (3) items with high correlations with overall emotion recognition accuracy to maximize reliability, while preserving the diversity of actors and faces.
Emotion Discrimination Task
We assessed emotion discrimination using the same stimuli and procedure as in prior studies of emotion discrimination (Pitcher et al., Reference Pitcher, Garrido, Walsh and Duchaine2008; Garrido et al., Reference Garrido, Furl, Draganski, Weiskopf, Stevens, Tan, Driver, Dolan and Duchaine2009; Germine et al., Reference Germine, Garrido, Bruce and Hooker2011; Germine and Hooker, Reference Germine and Hooker2011). Briefly, stimuli consisted of grayscale and cropped pictures of six white female Ekman faces expressing either happiness, sadness, surprise, fear, anger, or disgust. Pairs of faces were presented sequentially for 500 ms per face with a 500 ms inter-stimulus interval. Participants were given up to 7 s to indicate whether the faces were expressing the same or a different emotion. There were an equal amount of face pairs depicting the same and different emotions. Prior work using variants of this task has demonstrated that performance on this task selectively taps emotion discrimination per se, and not more general aspects of face processing, such as identity discrimination (Pitcher et al., Reference Pitcher, Garrido, Walsh and Duchaine2008). Furthermore, behavioral and neural response to this task has been shown to track with psychosis vulnerability (Germine et al., Reference Germine, Garrido, Bruce and Hooker2011; Germine and Hooker, Reference Germine and Hooker2011).
Digit Symbol Matching
The Digit Symbol Matching Task is modeled on the Digit Symbol Coding/Substitution tests from the Wechsler Adult Intelligence Scales. In this task, participants are presented with a key where numbers are paired with symbols. The participant is then shown a single symbol and has to indicate which number goes with that symbol. Scores indicate the number of symbols a participant correctly matches in 90 s. This is a measure of processing speed that taps visual working memory and sensorimotor speed.
Data analysis
Data were analyzed in R (R Core Team, 2017). Participants who did not report relevant demographic/sociocultural information were excluded on an analysis-by-analysis basis. Extreme values were transformed using a 95% Winsorization and z-scored to facilitate cross-task comparisons. Findings were considered statistically significant at p < 0.05 (two-sided) with correction for multiple comparisons (i.e. post-hoc Tukey HSD for simple effects and Bonferroni-adjusted p values for omnibus ANOVAs and t tests). All analyses are accompanied by relevant effect sizes for group differences (Cohen's d and the Common Language Effect Size (CLES) which denotes the probability that a randomly selected score from one group will be larger than a randomly selected score from another group) and variance accounted for (adjusted R 2, η 2).
The relation between age and task performance was analyzed using segmented regression (Muggeo, Reference Muggeo2003, Reference Muggeo2008). In segmented regression, multiple linear segments are used to model non-linear changes between two variables. This analysis allows for an estimation of breakpoints (i.e. ages in which the relation between age and performance changes), and rates of change (i.e. the slope of the linear segments) before and after the breakpoint. Using AIC and BIC values to evaluate model fit, first, we confirmed that the relation between age and performance was non-linear (which was true for all measures) by comparing linear models to two segment models, and then iteratively tested models with an additional segment until model fit did not improve (i.e. AIC/BIC values did not decrease). In cases where the differences in AIC and BIC values between models were discrepant, we report the more conservative, parsimonious model with fewer segments. All other variables were categorical and group differences were assessed with Welch's t tests or ANOVAs and post-hoc Tukey HSD tests. Since we found that for some measures, the effect of gender and age were moderate-to-large, and education, race, and ethnicity in our dataset were non-independent, we conducted an additional set of analyses for each factor controlling for all other factors (including the non-linear effect of age). To simplify these simultaneous regression models, we dichotomized education into high (grad, college, some college) and low (high, middle) categories and race into European/White and non-European/non-White categories. To evaluate cross-task differences among the levels of each factor, we examined and reported effect sizes and their 95% CIs.
Data availability
The data analyzed during the current study are available on the Open Science Framework repository at https://osf.io/tn9vb/.
Results
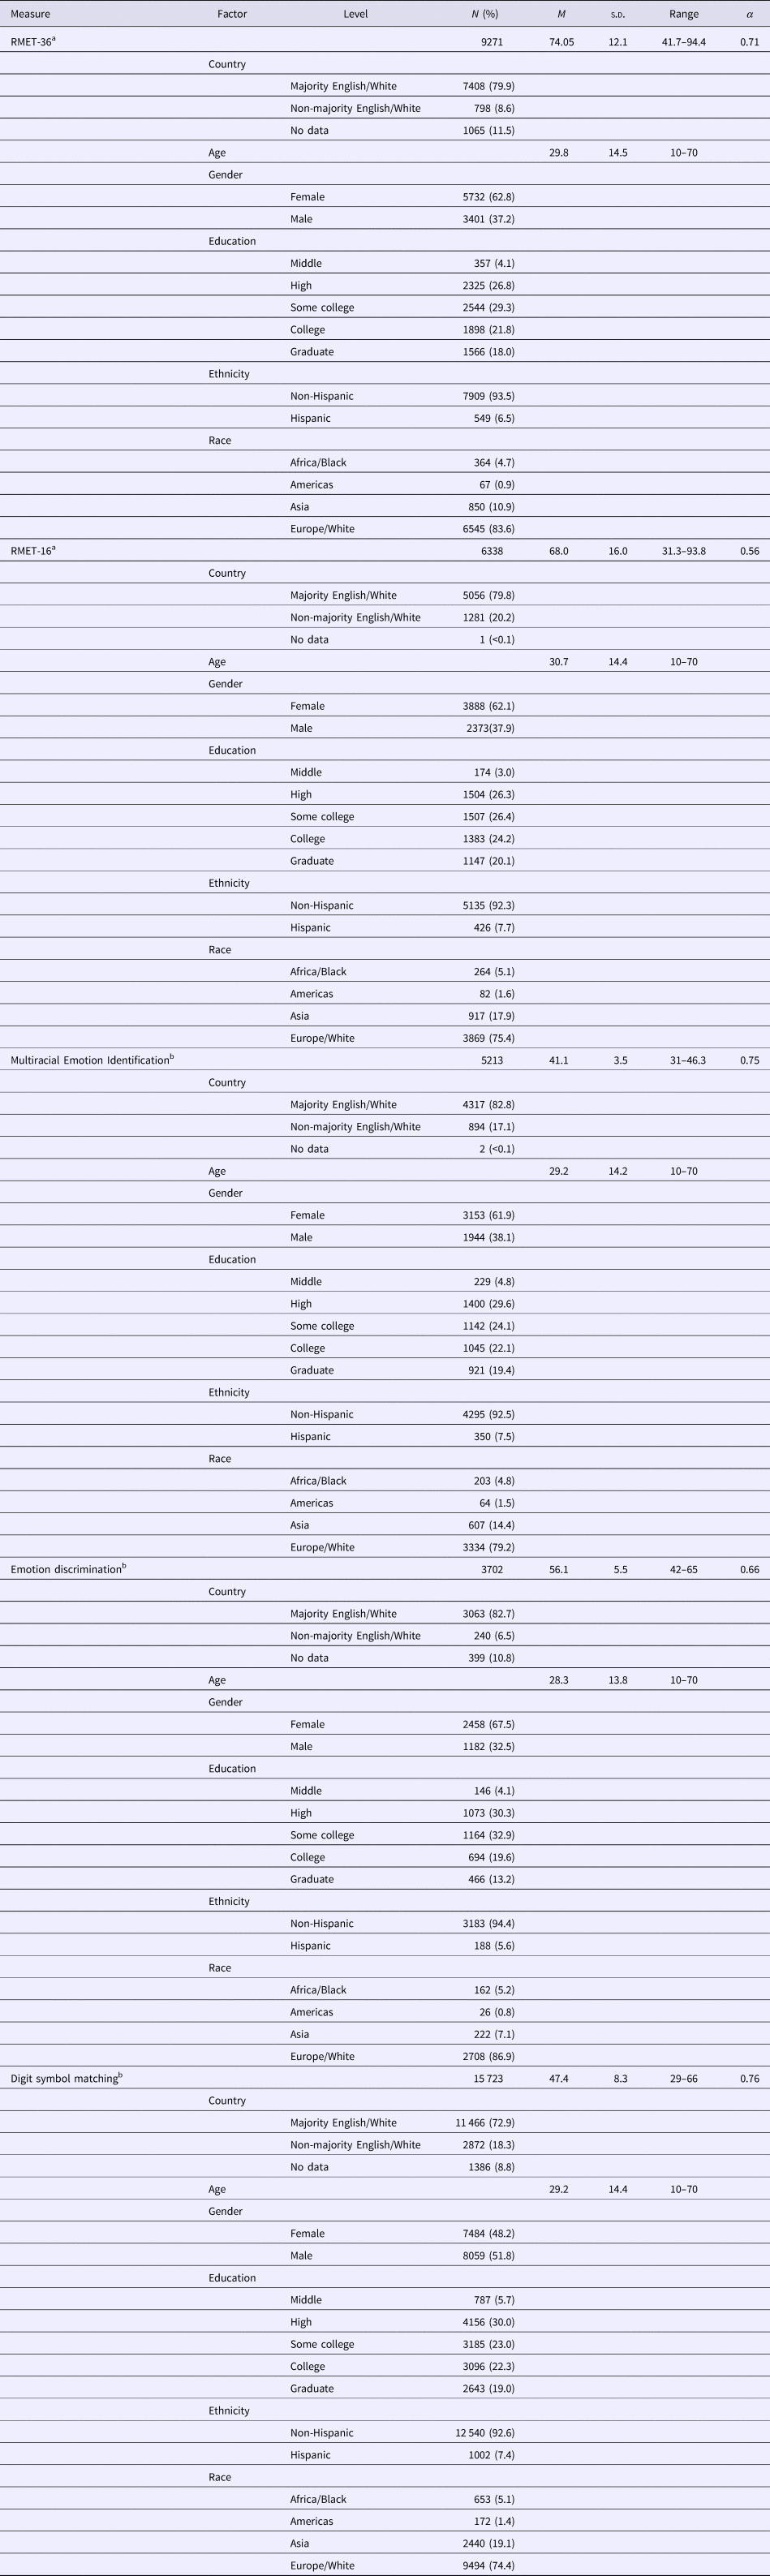
Participant characteristics and descriptive statistics from each task are presented in Table 2. Statistics are reported in full in the online Supplementary Materials.
Participant characteristics and task performance

a Values represent percentage correct.
b Values represent number of trials correct.
Age
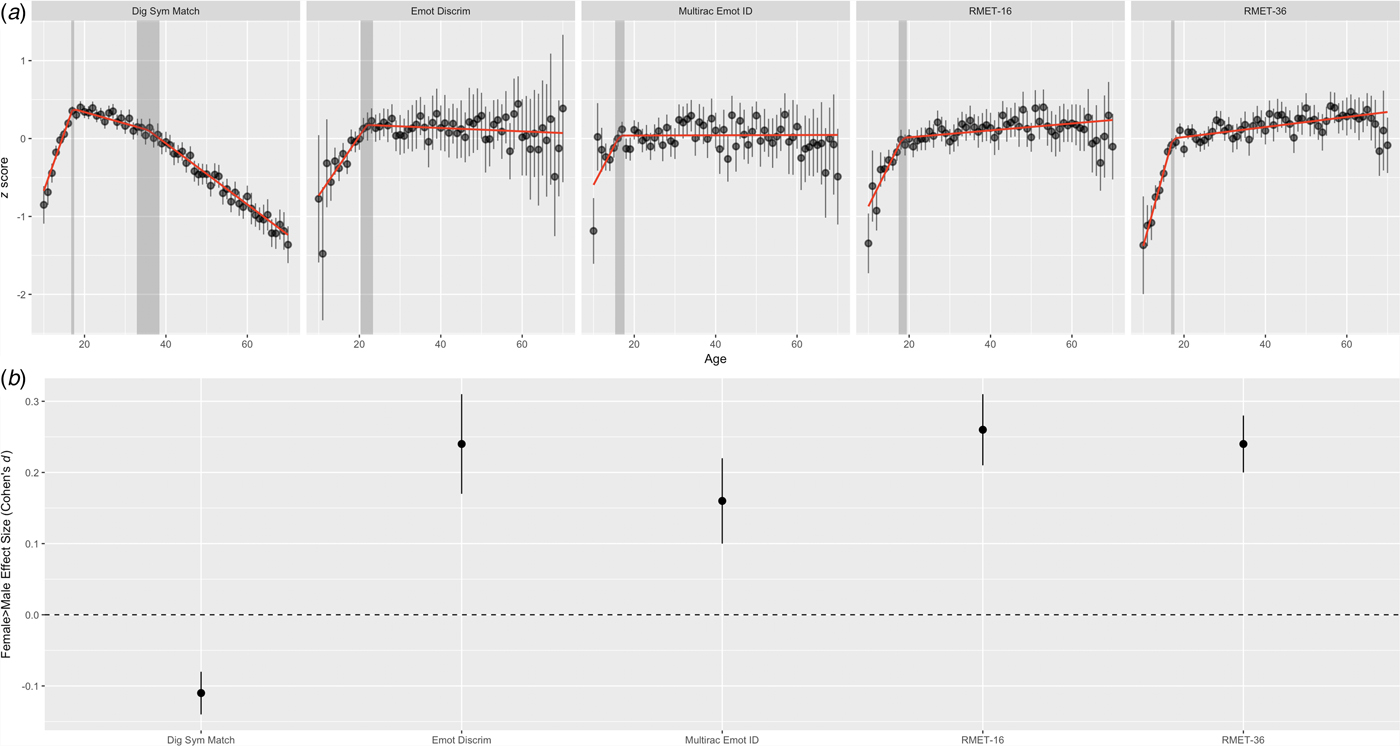
We used segmented regression to evaluate performance over the lifespan. This method allows for an estimation of breakpoints and their 95% CIs, which are ages at which the relation between age and performance changes. Lifespan changes in digit symbol matching were best fit by a three-segment model in which performance steeply rose, b = 0.152, 95% CI 0.136–0.168, until age 17.16 years, 95% CI 16.82–17.51, when performance peaked over the lifespan. After this age, performance began decreasing, b = −0.015, 95% CI −0.019 to −0.011, and at age 35.29 years, 95% CI 32.64–37.94, began decreasing at a significantly greater rate, b = −0.040, 95% CI −0.043 to −0.037. These lifespan changes replicate prior reports of lifespan changes in cognition (Salthouse, Reference Salthouse2004), confirming that our sampling approach captured individual differences in performance in a way that replicates traditional studies. On the social cognitive tasks, performance across the lifespan was distinct from digit symbol matching, but largely similar between the tasks with one potentially important difference. In all social tasks, performance rose steeply from pre-adolescence to early adulthood (Fig. 1a) with the first breakpoint occurring for multiracial emotion identification at age 16.43, 95% CI 15.29–17.57, and the last breakpoint occurring for emotion discrimination at age 21.85 (95% CI 20.31–23.38), with a breakpoint for RMET occurring in between these ages. For multiracial emotion identification and emotion discrimination, the age of these breakpoints represents peak performance with performance leveling off after these breakpoints, and exhibiting no significant change in either direction across the rest of the lifespan, multiracial emotion identification second slope, b < 0.001, 95% CI −0.002 to 0.002, emotion discrimination second slope b = −0.002, 95% CI −0.005 to 0.001. However, RMET performance continues to rise after its breakpoint, though at a slower rate than in adolescence, RMET-36 second slope b = 0.006, 95% CI 0.005–0.008, RMET-16 second slope b = 0.005, 95% CI 0.002–0.007. Results were unchanged when controlling for gender.
(a) Measure performance as a function of age. The red line depicts the segmented regression slopes. The vertical gray bar depicts breakpoints and their 95% CI. Data points represent mean score as function of age with error bars denoting 95% CI. (b) Female>male effects sizes with 95% CI across measures. Positive values represent a female>male performance advantage; negative values represent a male>female performance advantage.

To summarize, performance on all measures exhibits a steep rate of improvement through adolescence, reaching a relatively similar breakpoint in late adolescence/early adulthood, between the ages of approximately 16 and 22. For all measures except for RMET, this is where performance peaks, after which performance either significantly declines, as with digit symbol matching, or remains stable, as with multiracial emotion identification and emotion discrimination. In contrast, performance on RMET continues to increase with age; an effect only typically observed with crystallized cognitive abilities, such as vocabulary or knowledge, which increase over the lifespan (Hartshorne and Germine, Reference Hartshorne and Germine2015). This suggests that in contrast to other social cognitive skills, in which performance peaks in late adolescence/early adulthood, performance on RMET may reflect the contribution on vocabulary or some other variable important to complex MSU, which continues to increase over the lifespan.
Gender
Females outperformed males on all social tasks, ts > 5.43, ps < 0.001, with comparable, small, effect sizes ranging from d = 0.16, 95% CI 0.10–0.22, CLES = 54.48% on multiracial emotion identification to d = 0.26, 95% CI 0.21–0.31, CLES = 57.36% on RMET-16 (Fig. 1b). The similar direction and magnitude of these effects across social cognitive tasks suggests a robustness to the female advantage in social cognition. However, female advantage was specific to social cognitive tasks. On digit symbol matching, males outperformed females, t (15 540) = −7.08, p < 0.001, with the difference being smaller in magnitude than the gender difference in social cognition, d = −0.11, 95% CI −0.14 to −0.08, CLES = 46.81%.
Education
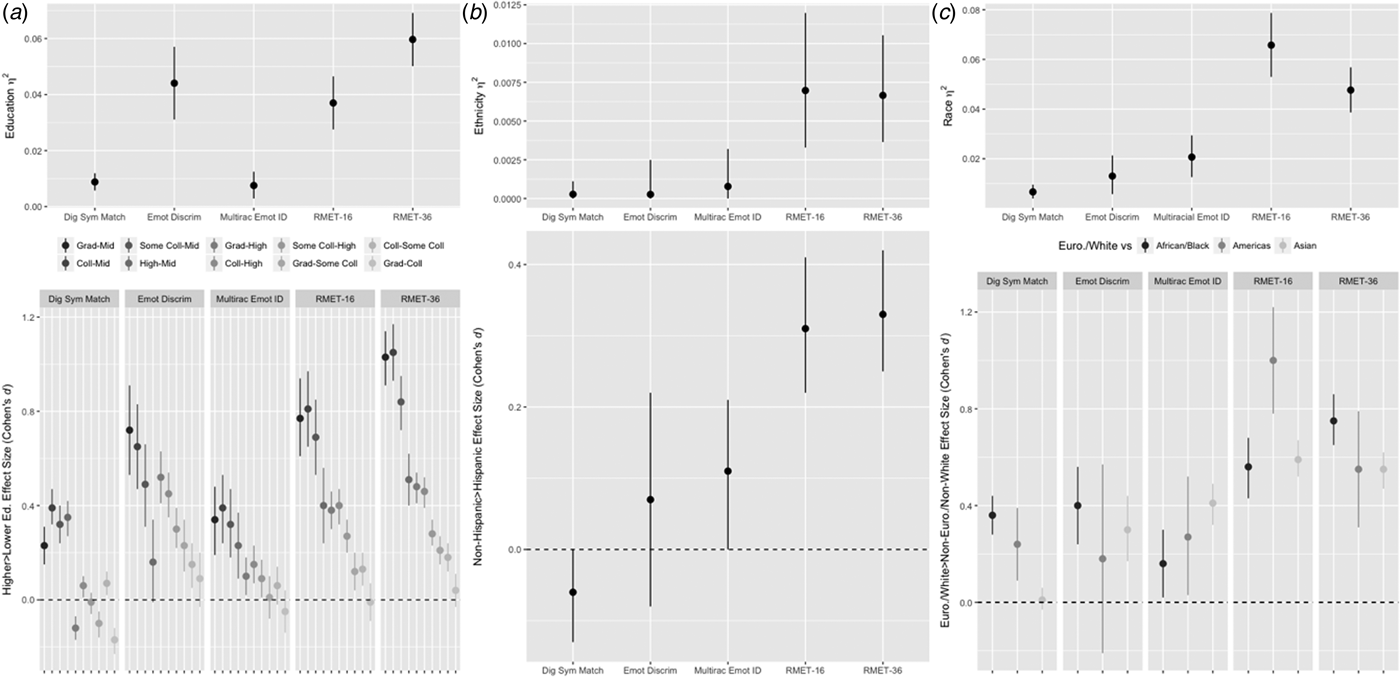
There was a clear education effect across all tasks, individual task ANOVA Fs > 8.97, ps < 0.001, such that participants with higher education generally outperformed those with less education, with the biggest differences occurring between those with the highest levels of education (graduate school, college) and lowest levels (middle school). That said, education effects varied substantially across tasks. Education explained 1.35 times more variance in RMET-36 performance, η 2 = 0.0597, 95% CI 0.0501–0.06914, than the other racially homogenous measure, emotion discrimination η 2 = 0.0441, 95% CI 0.0311–0.0571, 7.96 times more variance than the other measure which used multiracial stimuli, multiracial emotion identification η 2 = .0075, 95% CI 0.0029–0.0125, and 6.78 times more variance than the non-social measure, digit symbol coding η 2 = 0.0088, 95% CI 0.0058–0.0119 (Fig. 2a). Moreover, group differences were more reliable and biggest in magnitude for both versions of the RMET (RMET-36 and RMET-16: all post-hoc differences were significant except graduate v. college education), with effect sizes ranging from d = 0.04–1.05, CLES = 51.12–77.14% for RMET-36 and d = −0.01Footnote 5–0.81, CLES = 49.68–71.59% for RMET-16. In contrast, more highly educated participants less consistently outperformed less educated participants for emotion discrimination, multiracial emotion identification, and digit symbol matching, with effect sizes in the small-to-large range for emotion discrimination, range d = 0.09–0.72, CLES = 52.41–69.38%, and small-to-moderate range for multiracial emotion identification, range d = −0.05–0.39, CLES = 48.56–60.80% and digit symbol matching, range d = −0.17–0.39, CLES = 45.09–60.98%. Together, the pattern of results suggests that while better education is associated with better performance across cognitive and social cognitive measures, this effect is magnified with the RMET (i.e. the magnitude of education-level differences on performance is generally larger with the RMET v. the other measures). Furthermore, we observed comparable education effects on digit symbol coding and multiracial emotion identification, the social cognitive task that uses multiracial/multiethnic stimuli. This suggests that the effect of education on social cognitive performance can be mitigated with culturally diverse stimuli and/or reduced vocabulary demands.
(a) Education effects. The top panel depicts education η 2 and its 95% CI across measures. The bottom panel depicts effect size differences with 95% CI between levels of education. Positive values reflect a higher education>lower education performance advantage; negative values reflect a lower education>higher education performance advantage. Darker data points depict greater education-level differences (e.g. graduate v. middle school); lighter data points depict smaller education level differences (e.g. graduate v. college). Within each facet, education-level differences increase from right to left. (b) NIH-defined ethnicity effects. The top panel depicts ethnicity η 2 and its 95% CI across measures. The bottom panels depict effect size differences with 95% CI between non-Hispanic and Hispanic participants. Positive values reflect a non-Hispanic>Hispanic performance advantage; negative values reflect a Hispanic>non-Hispanic performance advantage. (c) Race effects. The top panel depicts race η 2 and its 95% CI across measures. The bottom panels depict effect size differences with 95% CI between European/White participants and non-European/non-White participants. Positive values reflect a European/White>non-European/non-White performance advantage; negative values reflect non-European/non-White>European/White performance advantage.

Ethnicity
NIH-defined ethnicity (i.e. Hispanic or Latino ancestry) explained 8.55–26.47 times more variance in the RMET than it did in the other tasks, and only impacted performance on RMET-36, t (610) = 6.80, p < 0.001, which was replicated with the RMET-16, t (492) = 6.01, p < 0.001, such that non-Hispanic participants outperformed Hispanic participants (Fig. 2b). These differences were small-to-moderate in magnitude, RMET-36 d = 0.33, 95% CI 0.25–0.42, CLES = 59.28%, RMET-16 d = 0.31, 95% CI 0.22–0.41, CLES = 58.81%. In contrast, no difference was observed between non-Hispanic and Hispanic participants for any other task, ts > 0.88, ps > 0.300, range d = −0.06–0.11, CLES = 48.22–52.98%. Since effects of ethnicity are not observed with the other tasks, it suggests that the ethnicity effect may be specific to RMET performance per se and not social or non-social cognition more broadly.
Race
We observed an effect of race on all tasks, Fs > 13.70, ps < 0.001; however, race explained 2.31–9.89 times variance in RMET performance, RMET-36 η 2 = 0.0476, 95% CI 0.0386–0.0568, RMET-16 η 2 = 0.0658, 95% CI 0.0530–0.0787, as compared with other tasks, multiracial emotion identification η 2 = 0.0207, 95% CI 0.0126–0.0294, emotion discrimination η 2 = 0.0130, 95% CI 0.0058–0.0213, digit symbol matching η 2 = 0.0067, 95% CI 0.0040–0.0096 (Fig. 2c). Further, the differences between European/White v. non-European/non-White backgrounds differed by task. Specifically, in the RMET-36, European/White participants outperformed all other groups, (ps < 0.001); an effect replicated in the RMET-16 dataset (ps < 0.001). These differences were moderate-to-large in size, RMET-36 range d = 0.55–0.75, CLES = 65.02–70.32%, RMET-16 range d = 0.56–1.00, CLES = 65.34–76.09%, with largest differences between African/Black and European/White participants. In contrast, on other tasks, European/White participants less consistently outperformed non-European/non-White participants. For example, on multiracial emotion identification, European/White participants performed no differently than Black/African or Native American/Alaskan Native participants; on emotion discrimination, European/White participants performed no differently than Native American/Alaskan Native participants; on digit symbol matching, European/White participant performed no differently than Asian participants (all ps > 0.05). Furthermore, the effect sizes for these differences were lower for all comparisons, multiracial emotion identification range d = 0.16–0.41, CLES = 56.46–61.30%, emotion discrimination range d = 0.18–0.40, CLES = 55.06–61.23%, digit symbol matching range d = 0.01–0.36, CLES = 50.53–63.00%. Thus, while European/White participants tended to outperform non-European/non-White participants, this difference was only reliable and large in magnitude in the RMET compared with all other tasks.
Additional analyses
We re-ran analyses evaluating the separate effect of education, ethnicity, and race on performance, controlling for all other factors, including gender and the non-linear effect of age. All findings were unchanged.
Discussion
Findings from the current study suggest that the RMET may be unduly sensitive to several sociocultural factors over and above other social and non-social cognitive tasks. Specifically, the RMET appears to be more sensitive to demographic and sociocultural factors such that older, more highly educated individuals of non-Hispanic and White/European backgrounds are likely to outperform their younger, less educated, Hispanic, and non-White/non-European counterparts. For the other tasks, we found similar trends in that those more highly educated tended to outperform those less educated and that participants reporting European/White race tended to outperform participants reporting non-European/non-White race (although there was no effect of ethnicity on these other measures). This pattern of results whereby the influence of variables were similar in nature (although not necessarily magnitude) across tasks suggest that education and race may in fact be associated with social cognitive ability in a reliable way; a finding that may be consistent with an increasing literature documenting the deleterious effects of socioeconomic disadvantage on the brain and cognition (Zsembik and Peek, Reference Zsembik and Peek2001; Glymour and Manly, Reference Glymour and Manly2008; Hackman et al., Reference Hackman, Farah and Meaney2010).
However, the effect of sociocultural variables on RMET performance is potentiated in a way that it in theory should not. Consider the finding that people with schizophrenia- or autism-spectrum disorders perform worse than healthy controls on the RMET with an effect size (Hedges’ g) of 0.73 and 0.81, respectively (Chung et al., Reference Chung, Barch and Strube2014). Is there a priori reason to believe that on the original RMET, performance differences should be similar or greater in magnitude between participants reporting European/White v. African race (d = 0.75)? Or between participants with some college/college/graduate v. middle school education (d = 0.84, d = 1.05, d = 1.03, respectively)? Said otherwise, is it reasonable to expect these groups to perform as differently from other groups as clinical populations with marked social impairment?
In theory, some of the sociocultural-RMET performance relations could be explained in a way that has nothing to do with limitations of the task. For example, regarding the lifespan findings, one possibility is that with age comes more social experience and expertise that would contribute to continually improving performance on the RMET over the lifespan. Something similar could be occurring with education in that more time spent in school with one's peers, navigating what might be complex social networks, may similarly positively impact social cognitive ability, explaining the large magnitude of effect that education has on RMET performance, which is consistent with other findings (Warrier et al., Reference Warrier, Grasby, Uzefovsky, Toro, Smith, Chakrabarti, Khadake, Mawbey-Adamson, Litterman, Hottenga, Lubke, Boomsma, Martin, Hatemi, Medland, Hinds, Bourgeron and Baron-Cohen2018). However, if that were the case, we would expect to see similar increases in performance across the lifespan in the other social tasks, and for education to have a similar magnitude of effect on the other social tasks, which we do not. The lifespan findings with the RMET also stand in contrast to other work demonstrating a decline in social cognitive ability over the lifespan using other MSU tasks (Moran et al., Reference Moran, Jolly and Mitchell2012; Moran, Reference Moran2013; Klindt et al., Reference Klindt, Devaine and Daunizeau2017). Our findings support the notion that something unique is contributing to RMET performance. It could be that age and education are serving as a proxy for verbal ability and IQ, which increases across the lifespan (Hartshorne and Germine, Reference Hartshorne and Germine2015) and has been shown to affect RMET performance (Baker et al., Reference Baker, Peterson, Pulos and Kirkland2014; Olderbak et al., Reference Olderbak, Wilhelm, Olaru, Geiger, Brenneman and Roberts2015); however, this is speculative given that we did not assess verbal ability or IQ directly. It is interesting, though, that performance on multiracial emotion identification, which is similar in structure (i.e. requiring emotion labeling) to the RMET, did not increase across the lifespan, and was not as related to education. This further suggests that the RMET may be particularly associated with these variables.
Regarding ethnicity and race, the RMET was the only task affected by NIH-defined ethnicity, and though White/European participants tended to outperform non-White/non-European participants across measures, these differences were less robust, and not as strong as they were with the RMET. Again, the relation between these factors and RMET could also seemingly be explained by other factors. For example, other research has revealed racial differences in aspects of mental state understanding that might affect how European/White v. non-European/non-White participants may approach the RMET (Masuda et al., Reference Masuda, Ellsworth, Mesquita, Leu, Tanida and Van de Veerdonk2008; Adams et al., Reference Adams, Rule, Franklin, Wang, Stevenson, Yoshikawa, Nomura, Sato, Kveraga and Ambady2010; Mason and Morris, Reference Mason and Morris2010). However, if this were the case, again, we would expect to see similar performance differences among race/ethnic groups in all social tasks, which we do not. The robust racial and ethnic group differences observed on the RMET do not appear to be simply the use of non-multiracial/multiethnic stimuli either: Ethnic differences were also less reliable and robust for emotion discrimination, which similarly contained racially/ethnically homogeneous (Caucasian) stimuli. The current findings, taken with other research documenting cultural differences in performance on the RMET (Prevost et al., Reference Prevost, Carrier, Chowne, Zelkowitz, Joseph and Gold2014), but not other MSU tasks (Bradford et al., Reference Bradford, Jentzsch, Gomez, Chen, Zhang and Su2018), suggest particular cultural bias with the RMET.
The RMET does appear to pick up on at least one reliable and robust demographic influence, that being gender differences. Across all social tasks, females outperformed males, which was a small, but reliable effect. This finding is consistent with other research on the RMET (Kirkland et al., Reference Kirkland, Peterson, Baker, Miller and Pulos2013; Baron-Cohen et al., Reference Baron-Cohen, Bowen, Holt, Allison, Auyeung, Lombardo, Smith and Lai2015; Warrier et al., Reference Warrier, Grasby, Uzefovsky, Toro, Smith, Chakrabarti, Khadake, Mawbey-Adamson, Litterman, Hottenga, Lubke, Boomsma, Martin, Hatemi, Medland, Hinds, Bourgeron and Baron-Cohen2018) and other social cognitive tasks (Kret and De Gelder, Reference Kret and De Gelder2012). This cannot be explained by general performance differences favoring females since males outperformed females on digit symbol matching.
The implications of these findings are somewhat troubling, particularly given the task's widespread use. Performance on the RMET seems to reflect aspects of social class and culture as much as it does social cognitive ability. With respect to clinical investigations, this confound can be particularly harmful. Given shared variance between social status and risk for psychiatric illness (Kendler, Reference Kendler1996; McLaughlin et al., Reference McLaughlin, Breslau, Green, Lakoma, Sampson, Zaslavsky and Kessler2011), using the RMET, it would be difficult to tell whether performance differences are the result of psychopathology v. factors that covary with psychopathology, namely, socioeconomic class and culture.
How then should the field proceed? We see several ways forward. First and foremost, researchers using the RMET or tasks with similar characteristics (i.e. high reliance on vocabulary; racial and ethnic stimuli homogeneity) should be careful to consider the potentially confounding impact of sample characteristics on their findings and draw inferences with those sample characteristics in mind, particularly when comparing clinical to non-clinical groups. Second, data from the multiracial emotion identification task suggest that at least some bias related to education, race, and ethnicity can be alleviated through the use of multicultural stimuli. This notion is further supported by examining other social cognitive tasks that use multiracial/multiethnic stimuli such as the Penn Emotion Recognition Test (Kohler et al., Reference Kohler, Turner, Bilker, Brensinger, Siegel, Kanes, Gur and Gur2003; Gur and Gur, Reference Gur and Gur2016), which does not appear to be affected by participant race and ethnicity (Pinkham et al., Reference Pinkham, Kelsven, Kouros, Harvey and Penn2017). Another option would be to use stimuli that are less verbally and culturally loaded, to the extent that that is possible. The Social Attribution Task-Multiple Choice task (Bell et al., Reference Bell, Fiszdon, Greig and Wexler2010), for example, which involves making judgments about non-verbal animated geometric objects acting with ostensible beliefs, desires, and intentions, has been validated for use across cultures (Lee et al., Reference Lee, Corbera, Poltorak, Park, Assaf, Bell, Wexler, Cho, Jung, Brocke and Choi2018). However, other research initiatives have recommended not using the task due to poor psychometric properties (Pinkham et al., Reference Pinkham, Harvey and Penn2018; although see Johannesen et al., Reference Johannesen, Fiszdon, Weinstein, Ciosek and Bell2018). Finally, as others have recommended (Pedraza and Mungas, Reference Pedraza and Mungas2008), new assessments should be developed and validated using more diverse samples along with statistical methods that assess whether scores have similar meanings across groups (Mungas et al., Reference Mungas, Reed, Crane, Haan and González2004; Siedlecki et al., Reference Siedlecki, Tucker-Drob, Oishi and Salthouse2008). Moving forward, measurement initiatives such as the Social Cognition Psychometric Evaluation study (Pinkham et al., Reference Pinkham, Harvey and Penn2018) will be increasingly important.
The increasing rise of large-scale cohort studies (e.g. NIH's All of Us Research Program), where demographic and sociocultural characteristics are likely to become increasingly crossed, means that without action toward creating sound measures, these research efforts, and others, will be profoundly undermined (Manly, Reference Manly2008). Thus, we take our findings as a call to action for social cognition researchers to create measures that minimize undue effects of sociodemographic characteristics. Given ongoing initiatives at the NIMH to select and recommend social cognitive measures for widespread use in research, the time to create and test new measures is now.
Supplementary material
The supplementary material for this article can be found at https://doi.org/10.1017/S003329171800404X.
Author ORCIDs
David Dodell-Feder, 0000-0003-0678-1728
Acknowledgements
We thank Erin Dunn and Andrew Smith for advice on data analysis, and the TestMyBrain.org volunteers for their participation.
Financial support
This project was supported by the Stanley Center for Psychiatric Research at the Broad Institute of MIT and Harvard as well as through NIH National Institute of Mental Health contract HHSN271201700776P awarded to L Germine.
Conflict of interest
None.
Ethical standards
The authors assert that all procedures contributing to this work comply with the ethical standards of the relevant national and institutional committees on human experimentation and with the Helsinki Declaration of 1975, as revised in 2008.