I. INTRODUCTION
Properties of materials, such as electrical resistivity,Reference Sun, Yao, Warren, Barmak, Toney, Peale and Coffey1,Reference Lu, Shen, Chen, Qian and Lu2 corrosion resistance,Reference Lin, Palumbo, Erb and Aust3 and dielectric phenomena,Reference Lee, Key, Liang, Garcia, Wang, Tricoche, Rohrer, Saito, Ito and Tani4 are strongly influenced by the type of grain boundaries in the material and how they are connected. The concept of grain boundary design (now known as grain boundary engineering) was first proposed by Watanabe.Reference Watanabe5 Grain boundary engineering aims to increase the fraction of special grain boundaries with desirable properties.Reference Field, Bradford, Nowell and Lillo6 Desirable properties can often be associated with boundaries with simple structures and low energy. Such low-energy structures are, in turn, associated with coincident site lattice (CSL) boundaries.Reference Randle7 Twin boundaries are a type of CSL boundary (noted as Σ3) and are commonly found in face centered cubic (fcc) materials with medium to low stacking fault energies, as is the case for Cu. Crystals separated by Σ3 twin boundaries are misoriented by a 60° rotation about a common <111> axis. A Σ3 twin boundary is classified as coherent when the boundary is in the {111} plane perpendicular to the misorientation axis and as incoherent otherwise. Properties of coherent and incoherent Σ3 grain boundaries can be significantly different, including the reflection coefficients for electron scattering.Reference Fuchs8
In recent years, extensive research has been focused on the effect of twin boundaries on the properties of Cu.Reference Shen, Lu, Lu, Jin and Lu9–Reference Xu, Sriram, Ozolins, Yang, Tu, Stafford, Beauchamp, Zienert, Geisler and Hofmann13 For example, Shen et al.Reference Shen, Lu, Lu, Jin and Lu9 showed that a high density of twin boundaries in ultrafine grained Cu results in high tensile strength while retaining significant ductility. In the work by Anderoglu et al.,Reference Anderoglu, Misra, Wang and Zhang10 sputtered Cu films with a layered arrangement of coherent twin boundaries exhibited better thermal stability than crystals without these boundaries. Twin boundaries are also thought to have little impact on resistivityReference Sutton and Balluffi12 and to enhance the electromigration resistanceReference Chen, Wu, Liao, Chen and Tu11,Reference Xu, Sriram, Ozolins, Yang, Tu, Stafford, Beauchamp, Zienert, Geisler and Hofmann13 of Cu.
Motivated by the various desirable properties resulting from the presence of twin boundaries, efforts have been made to study the influence of microstructure and processing conditions on twin formation in Cu. Kohama et al.Reference Kohama, Ito, Matsumoto, Shirai and Murakami14 investigated the role of texture in grain growth and twin boundary formation in Cu films. A strong (111) texture was observed to suppress grain growth and twin boundary formation, while a (100) texture facilitated the same processes. Park and FieldReference Park and Field15 found a dependence of twin boundary formation on annealing temperature and film thickness in three sputter deposited Cu films with thicknesses of 100, 480, and 850 nm. Pantleon et al.Reference Pantleon, Gholinia and Somers16 studied three micrometer thick self-annealed Cu films and found an increase in average grain size and Σ3 boundary density with film thickness.
In this work, a TEM based orientation mapping technique called ASTAR™ is used to measure the length fraction of Σ3 grain boundaries in Cu films with nanometer scale thicknesses well below the range studied in prior works. The Σ3 length fraction is the result of a two-dimensional analysis that assigns Σ3 boundaries as twins if the surface trace is consistent with the boundary terminating on a (111) plane. The density of Σ3 boundaries is also evaluated by the peak intensity of the Σ3 boundary area using an established stereological measurement method. A detailed description of the crystal orientation mapping system can be found in earlier publications.Reference Rauch and Dupuy17–Reference Rauch, Portillo, Nicolopoulos, Bultreys, Rouvimov and Moeck19 ASTAR™ has been successfully used to study heterophase interface character and grain boundary character distributions in nanocrystalline materials.Reference Darbal, Ganesh, Liu, Lee, Ledonne, Sun, Yao, Warren, Rohrer, Rollett, Ferreira, Coffey and Barmak20–Reference Liu, Nuhfer, Ledonne, Lee, Rollett, Barmak, Carpenter and Darbal22 In the work by Carpenter et al. and Liu et al.,Reference Carpenter, Liu, Darbal, Nuhfer, McCabe, Vogel, LeDonne, Rollett, Barmak, Beyerlein and Mara21–Reference Liu, Nuhfer, Rollett, Sinha, Lee, Carpenter, LeDonne, Darbal and Barmak23 the heterophase interfacial texture of Cu/Nb nanolamellar composites with average layer thicknesses as small as 18 nm was explored. Comparisons with bulk texture measurements provided by neutron diffraction demonstrated that the orientation mapping results were representative of bulk textures in both the Cu and Nb phases.Reference Carpenter, Liu, Darbal, Nuhfer, McCabe, Vogel, LeDonne, Rollett, Barmak, Beyerlein and Mara21 In the work by Liu et al.,Reference Liu, Choi, Beladi, Nuhfer, Rohrer and Barmak24 crystal orientation maps were obtained of a nanocrystalline tungsten thin film with a 100 nm average grain size wherein the distribution of grain boundary planes at specific lattice misorientations was obtained and was compared with the populations of the same boundaries in a microcrystalline ferritic steel. When the grain boundary character distributions (GBCDs) of the two materials were compared, it was found that they were correlated, so that the most common boundaries in tungsten were also the most common boundaries in ferrite steel. Darbal et al.Reference Darbal, Ganesh, Liu, Lee, Ledonne, Sun, Yao, Warren, Rohrer, Rollett, Ferreira, Coffey and Barmak20 studied the GBCDs of two Cu thin films with average layer thicknesses of 36.9 and 46.4 nm based on crystal orientation maps. The two Cu films showed strong peaks in the GBCD at the coherent Σ3 position.
Various attempts have been made to describe the formation and growth of twin boundaries in fcc materials. The most well-known models invoke the occurrence of growth accidents,Reference Gleiter25,Reference Mahajan, Pande, Imam and Rath26 grain encounters,Reference Burgers27–Reference Burgers, Meijs and Tiedema29 stacking fault packets,Reference Dash and Brown30 grain boundary dissociation,Reference Kopezky, Novikov, Fionova and Bolshakova31,Reference Kopezky, Andreeva and Sukhomlin32 or other nonspecific mechanisms.Reference Pande, Imam and Rath33 Details about each model will be given in the Discussion section. However, in this paper, we will focus on models that lend themselves to quantitative comparison with our experimental results.
\The purpose of the current paper is to present measurements of the Σ3 and coherent Σ3 boundary length fractions in a series of six Cu thin films encapsulated by Ta38Si14N48 layers. The deposition conditions and annealing temperature were such that all films have a random texture and a microstructure consisting of a single grain through the film thickness. There are three major novelties of the work. First, compared with most previous work, a larger number of Cu films with different thicknesses were studied. This allows a systematic comparison between the measured twin fraction and fractions calculated from existing physical models. Secondly, all films studied in this work have nanometer scale film thicknesses (26–111 nm) and grain sizes (51–315 nm). This scale is of significant interest in many current applications.Reference Chen and Gardner34 Finally, all of the samples had exactly the same thermal treatment and vary only in their grain size and thickness. As the film thickness is not considered to be an influential factor for twin density in any existing physical models, it is neglected in favor of grain size in comparing the experimental work with models of twin formation. Therefore, this experiment separates the influence of grain size from thermal treatment and allows a more rigorous comparison to established twin formation models than possible in typical grain growth experiments.
II. EXPERIMENTAL
A. Film processing
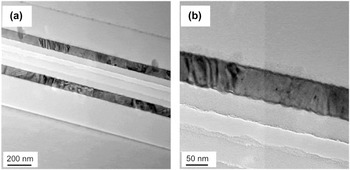
The six Cu films examined in this work were sputter deposited onto (100) Si substrates having a 150 nm thick layer of thermally grown SiO2 and were encapsulated between 20 nm of SiO2 and 2 nm of Ta38Si14N48 to form a Si/thermal SiO2/sputtered SiO2/Ta38Si14N48/Cu/Ta38Si14N48/sputtered SiO2 layer structure. The substrate was cooled to −40 °C by contact with a liquid nitrogen cooled Cu plate. The Cu layers were deposited by dc sputter deposition from high-purity (99.9999%) Cu targets. The deposited films had thicknesses in the range of 25.6–111.1 nm, measured by x-ray reflectivity at the Stanford Synchrotron Radiation Lightsource. Following deposition, the films were postannealed at 600 °C for 30 min in Ar + 3% H2 to achieve a columnar grain structure. Cross-sectional TEM micrographs of the film with a Cu layer thickness of 56.8 nm are shown in Figs. 1(a) and 1(b). Details of film deposition and processing of similar sets of Cu thin films can be found elsewhere.Reference Sun, Yao, Warren, Barmak, Toney, Peale and Coffey1,Reference Sun, Yao, Warren, Kumar, Roberts, Barmak and Coffey35
Cross-sectional TEM micrograph of the Cu film with a thickness of 56.8 nm at two different magnifications.

Plan-view TEM samples were prepared by first removing most of the Si by mechanical polishing from the back side and then etching in a mixture of HF and HNO3.Reference Yao, Petrova, Vanfleet and Coffey36 The etching was stopped before breaking into the Cu film, resulting in large-area, uniformly thick, electron transparent samples for TEM.
B. TEM characterization and orientation mapping
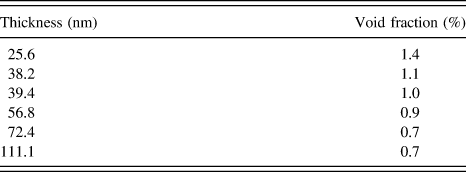
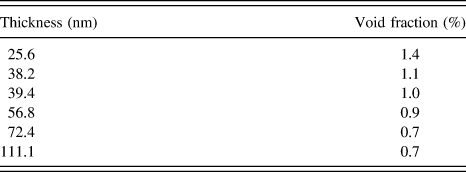
Void fractions of the films were measured using high-angle annular dark field (HAADF) imaging in the scanning transmission electron microscopy mode. Measured void fractions of the six Cu films are shown in Table I and are seen to be in the range of 0.7–1.4%, with the highest void fraction of 1.4% found in the thinnest film. Given the low void fraction of the films, very few of the grains neighbor a void or could be affected by a void and the films can therefore be considered to behave as continuous.
Void fractions of the six Cu films measured by HAADF.
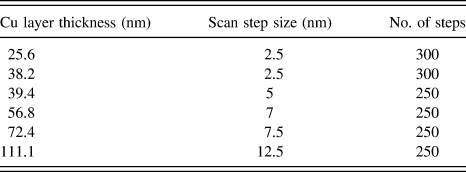
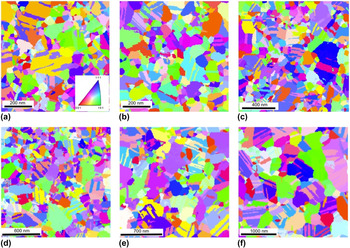
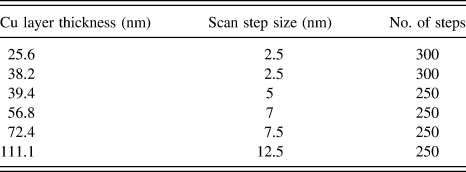
Orientation imaging was performed on an ASTAR™ (NanoMEGAS, Brussels, Belgium) system installed on a FEI Tecnai F20 TEM (FEI Corporation, Hillsboro, OR) with a field emission gun and an accelerating voltage of 200 kV. A probe size of 9 in the FEI Tecnai F20, which corresponds to a beam diameter of ∼1 nm, was used for collection of orientation maps. A condenser aperture with a diameter of 30 µm was used. Scan step sizes were chosen to be roughly consistent with the corresponding estimated grain sizes excluding twin boundaries and ranged between 2.5 and 12.5 nm for all six samples. The influence of step size on twin boundary length fraction measurements is discussed in Sec. III. D. Each orientation map contains 250–300 steps along both x and y directions. Approximately 30 fields of views with ∼100–200 grains in each field of view were collected and used for both grain size measurement and Σ3 boundary length fraction measurement. Detailed scan parameters used for each sample can be found in Table II. Example orientation maps of the six films are given in Fig. 2.
Scan parameters used for each Cu sample.
Inverse pole figure maps in the sample normal direction for Cu/Ta38Si14N48 films with film thicknesses of (a) 25.6 nm, (b) 38.2 nm, (c) 39.4 nm, (d) 56.8 nm, (e) 72.4 nm, and (f) 111.1 nm. Orientation of each grain can be determined from the color key in which [001], [101], and [111] are directions in the crystal reference frame.

For the determination of grain boundary character distribution, the ASTAR™ orientation data were rotated counterclockwise by 207° to bring the image and diffraction pattern orientations into coincidence. The ASTAR™ orientation data were then imported into the TSL OIM™ software (EDAX, Mahwah, NJ) for analysis. An additional counterclockwise rotation of 90° was applied to correct the difference in the reference frames between ASTAR™ and TSL.Reference Darbal, Ganesh, Liu, Lee, Ledonne, Sun, Yao, Warren, Rohrer, Rollett, Ferreira, Coffey and Barmak20
C. Cleanup of orientation data using TSL OIM™
Data cleanup needs to be applied to orientation data for removal of incorrectly indexed data points, especially near grain boundaries. First, a grain dilation filter is used which acts only on points which do not belong to any defined grain. The points will become part of the grain with the largest number of pixels surrounding the pixel of interest. Two parameters need to be defined for the grain dilation filter, the minimum grain size and the misorientation angle. For the Cu films studied here, the misorientation angle is defined to be 5°, thus neighboring pixels misoriented by less than 5° are considered to belong to the same grain. The minimum grain size is defined to be 5% of the mean grain area excluding twin boundaries, estimated from the uncleaned orientation maps.
After grain dilation, the single orientation per grain operation with a tolerance angle of 5° is used to assign an average orientation to all pixels in a given grain. Finally, cleanup procedures were used to remove false grain boundaries created by 180° ambiguity. This particular type of misindexing occurs because of the similarity of diffraction patterns related to simple symmetry operations, e.g., 180° rotations along certain axes. False 180° boundaries with misorientation axes of 001, 101, 102, 103, 104, 105, 113, 114, 116, 117, 212, 213, 215, 223, 313, 314, 315, 317, 323, and 525 were removed with a tolerance angle of 1°. These cleanup procedures change only ∼5% of the data points.
Grain boundary line segments were extracted from the orientation maps and used for calculating the GBCD. These line segments were reconstructed so that they deviated from true segments by no more than two pixels. More than 50,000 line segments were used for calculating the GBCD. Coherent and incoherent Σ3 boundaries were reconstructed with a misorientation tolerance angle of 9°. Coherent Σ3 boundaries were identified as twin boundaries whose boundary planes deviated from the {111} plane by no more than 8°. The choices of allowable misorientation and plane deviation are based on Brandon's criterion and are consistent with reported values.Reference Wright and Larsen37 Length fractions of total Σ3 and coherent Σ3 boundaries over the entire grain boundary population were calculated. After measurement of the Σ3 boundary length fraction, all Σ3 boundaries were excluded from the grain boundary network with a misorientation tolerance angle of 9° for grain size measurements excluding twin boundaries.
D. Influence of ASTAR™ scan step size on grain size measurement and boundary analysis results
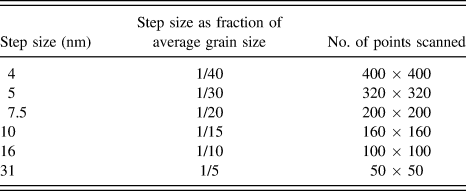
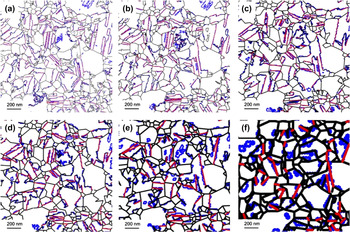
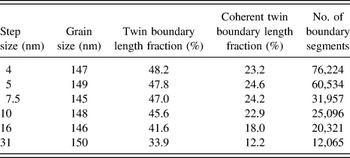
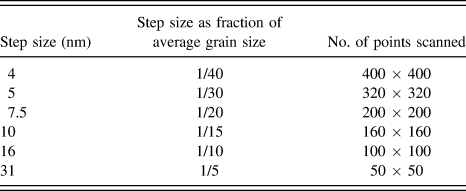
As shown in Table II, different scan step sizes were used for collection of orientation maps. In this section, the influence of scan step size on grain size and Σ3 boundary length fraction measurements will be described. The sample Cu (72.4 nm)/Ta38Si14N48 was chosen for the step size experiment. This sample has an ASTAR™ grain size of 147 nm. All grain size values in this paper are given as the equivalent circle diameter of the mean area. Six different scan step sizes ranging from 4 nm to 31 nm (1/40 to 1/5 of the mean grain size) were used to scan each field of view. The scan parameters are detailed in Table III. Table III shows that the number of points in the x and y directions was controlled so that each image had approximately the same field of view (1600 × 1600 nm). Figure 3 shows an example of boundary analysis results from the same area in the 72.4 nm-thick Cu sample scanned using the six different step sizes. In Fig. 3, blue lines represent all Σ3 boundaries and red lines represent coherent Σ3 boundaries while black lines represent other grain boundary types. Grain size measurement and boundary analysis results of sample Cu (72.4 nm)/Ta38Si14N48 scanned using the six different step sizes are shown in Table IV. Similar grain size measurement and boundary length fraction measurement results are obtained when scan step sizes ranging between 4 and 10 nm are used (Table IV). In contrast, boundary analysis results acquired with scan step sizes of 16 and 31 nm show large discrepancies from ones acquired with finer step sizes. This is a result of the inability of the coarser step sizes to capture the smaller grains, and hence the grain boundaries surrounding them. It is concluded that the choice of step size does not impact the experimental results as long as the step size used is between 1/40 and 1/15 of the mean grain size. In this work, all scan step sizes used for the six samples shown in Table II fall in this range. Therefore, the comparison of grain size and boundary fractions between different samples is not influenced by step size.
Scan parameters used for the evaluation of the impact of step size on twin length fraction and grain boundary character distribution. The sample used for these scans was Cu (72.4 nm)/Ta38Si14N48.
Reconstructed boundary maps of the same area of Cu (72.4 nm)/Ta38Si14N48 scanned using a step size of (a) 4 nm, (b) 5 nm, (c) 7.5 nm, (d) 10 nm, (e) 16 nm, and (f) 31 nm. In these maps, blue lines represent all twin boundaries and red lines represent coherent twin boundaries only while black lines represent other grain boundaries.

Grain size measurement and boundary analysis results of sample Cu (72.4 nm)/Ta38Si14N48 for different scan step sizes.

III. RESULTS AND DISCUSSION
A. GBCD of the Cu films
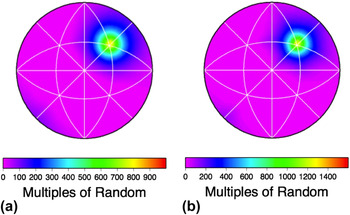
The relative areas of Σ3 grain boundaries, as a function of grain boundary plane orientation, for samples Cu (25.6 nm)/Ta38Si14N48 and Cu (111.1 nm)/Ta38Si14N48 are shown in Figs. 4(a) and 4(b), respectively. The relative areas reach a maximum at the coherent Σ3 positions. The values at the maxima as well as length fractions of all Σ3 and coherent Σ3 boundaries of the six films can be found in Table V. These distributions are consistent with Darbal et al.'s work on nanocrystalline Cu thin films.Reference Darbal, Ganesh, Liu, Lee, Ledonne, Sun, Yao, Warren, Rohrer, Rollett, Ferreira, Coffey and Barmak20 It has been reported that grain boundary population and energy have an inverse correlation so that boundaries of lower energy have higher populations.Reference Rohrer, Saylor, El-Dasher, Adams, Rollett and Wynblatt38–Reference Rohrer40 As a result, coherent Σ3 boundaries, which have a lower boundary energyReference Holm, Olmsted and Foiles41 compared to other grain boundary types, have a higher frequency in the Cu films. The low grain boundary energy of coherent twin boundaries can be explained by a low atomic misfit as well as by the broken bond model.Reference Mackenzie, Moore and Nicholas42 According to the broken bond model, surface energy reaches a minimum value at {111} planes for fcc materials.Reference Mackenzie, Moore and Nicholas42 Materials with a fcc crystal structure other than Cu also show a similar inverse correlation between energy and population as well as a high frequency at {111} planes.Reference Rohrer, Holm, Rollett, Foiles, Li and Olmsted43,Reference Holm, Rohrer, Foiles, Rollett, Miller and Olmsted44 As a comparison, recent measurements of the GBCD of body centered cubic (bcc) iron and tungsten show small relative areas for {111} planes.Reference Liu, Choi, Beladi, Nuhfer, Rohrer and Barmak24,Reference Beladi and Rohrer45,Reference Beladi and Rohrer46
The relative areas of grain boundaries with the Σ3 misorientation, plot on a stereographic projection along [001] of (a) sample Cu (25.6 nm)/Ta38Si14N48 and (b) sample Cu (111.1 nm)/Ta38Si14N48. The plots peak at the (111) position, corresponding to coherent Σ3 boundaries.

Grain size measurement and boundary analysis results of the six Cu/Ta38Si14N48 films. For twin boundary and coherent twin boundary length fractions, the error estimation is the standard deviation of the measured length fraction from individual fields of views divided by the square root of the numbers of fields of views for each film. For the grain size, the confidence interval at 95% confidence on the mean is given based on the measured population.Reference Carpenter, Rickman and Barmak50

B. Increase in boundary length fraction with grain size
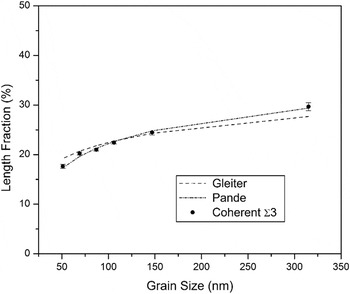
The measurements of the grain sizes and the length fractions of all Σ3 and coherent Σ3 boundaries of the six films are shown in Table V. The estimation of error for the boundary length fractions in Table V has been done by dividing the standard deviation of the measured length fraction from individual fields of views by the square root of the numbers of fields of views for each film. The relative area of the coherent twin as determined by the peak intensity of the GBCD for coherent Σ3, as well as the total Σ3 and coherent Σ3 length fractions directly measured from the orientation maps, are found to increase monotonically with grain size. In Fig. 5, the monotonic increase of the length fraction of coherent Σ3 boundaries with increasing grain size is plotted.
Coherent Σ3 boundary length fractions are plotted as a function of grain size.

C. Twinning models in the literature
1. Gleiter's growth accident model
In 1969, GleiterReference Gleiter25 proposed an atomistic model for the formation of annealing twins based on electron microscopic investigations of migrating grain boundaries and optical microscope measurement of twin density. In this model, twins are formed by a two-dimensional nucleation process on the {111} planes of the growing grain. Gleiter's model gives the following equation for the probability, p, of formation of a twin nucleus at a migrating boundary, which is also the probability for a {111} plane to be a twinning plane:
 $$p = \exp \left\{ {{{{\sigma _{\rm{z}}}\left( {Q - kT\ln {{\Delta {G^0}} \over {kT}}} \right)} \mathord{\left/ {\vphantom {{{\sigma _{\rm{z}}}\left( {Q - kT\ln {{\Delta {G^0}} \over {kT}}} \right)} {\left[ {kT{\sigma _{\rm{z}}} - {{\pi kT\varepsilon {h^2}} \over {\left( {Q - kT\ln {{\Delta {G^0}} \over {kT}}} \right)}}} \right]}}} \right. \kern-\nulldelimiterspace} {\left[ {kT{\sigma _{\rm{z}}} - {{\pi kT\varepsilon {h^2}} \over {\left( {Q - kT\ln {{\Delta {G^0}} \over {kT}}} \right)}}} \right]}}} \right\}\quad {\rm{.}}$$
In Eq. (1), Q is the activation energy for grain boundary migration, ΔG 0 is the difference in Gibbs free energy between the growing and the shrinking grain and is given by ΔG 0 = 4δΩ/d, where δ is the grain boundary energy, Ω is the atomic volume, and d is the grain diameter, σz is the energy of the coherent twin boundary, h is the height of the step formed by the twin nucleus (taken as the distance between {111} planes), ε is the energy of a step with height h, k B is the Boltzmann constant, and T is the absolute temperature. The values of the parameters given by Gleiter are Q = 3 × 10⁻¹⁹ J/atom, σz = 19.3 mJ/m2, h = 2.087 × 10⁻¹⁰ m, and ε ≈ δ/2 = 315 mJ/m2. The value of Ω is calculated from the known lattice parameter and fcc structure of Cu as 1.1775 × 10⁻²⁹ m3.
In Gleiter's model,Reference Gleiter25 a parameter p is given as the probability of formation of a coherent twin nucleus at a migrating grain boundary. However, in our experiments, coherent Σ3 boundaries are quantified in terms of length fraction of all grain boundary types. To relate p to the coherent Σ3 boundary length fraction, we proceed as follows. The probability p can be used to calculate the number of coherent twin boundaries per nanometer, as T = p/h and the average number of expected coherent twin boundaries per grain, as n = Td, where the grain size d is taken as the equivalent circle diameter of mean area, d <A> = (4<A>/π)½, where <A> is the mean area of grains. Assuming the average length of coherent twin boundaries to be equal to the mean chord length of a circle, i.e., equal to πd <A>/4, then the fractional length of coherent Σ3 boundaries for the sample is given by the fractional length of the coherent Σ3 boundary per grain. This fraction can be calculated as the length of coherent Σ3 boundaries divided by the total length of boundaries, including coherent Σ3 boundaries, per grain:
 $${l_{{\rm{f}}\Sigma 3}} = {{{{n\pi {d_{ \lt A > }}} \over 4}} \over {\pi {d_{ \lt A > }} + {{n\pi {d_{ \lt A > }}} \over 4}}} = {{pd_{ \lt A > }^2} \over {4h{d_{ \lt A > }} + pd_{ \lt A > }^2}}\quad {\rm{,}}$$
where πd <A> is the perimeter of the (mean) grain. Note that in Gleiter's model, only the probability of the formation of coherent Σ3 boundaries is calculated. As a result, we distinguished between coherent and incoherent Σ3 boundaries and compared the length fraction of only coherent Σ3 boundaries to the fraction calculated from Gleiter's model.
In 2006, Li et al.Reference Li, Cahoon and Richards47 revisited Gleiter's model and proposed an updated set of values for the parameters in Eq. (1) based on more recent experimental data, while still providing good agreement between experimental and calculated results. For pure Cu, Li et al. proposed the following parameter set: Q = 1.9 × 10⁻¹⁹ J/atom, δ = 800 mJ/m2, σz = 20.41 mJ/m2, and ε = 400 mJ/m2 and found that this parameter set gives reasonably good agreement between the experimentally measured and the calculated results as a function of annealing temperature for a Cu sample with a grain diameter of 200 micrometers.
2. Pande's semiempirical model
Pande introduced a semiempirical modelReference Pande, Imam and Rath33 in which the number of twins per grain, N, is given by
 $$N = k{\gamma _{\rm{g}}}\log D - k{\gamma _{\rm{g}}}\log {D_0}\quad {\rm{,}}$$
where k is a constant, γg is the grain boundary energy, D is the grain size, and D 0 is a critical grain size at or below which N = 0. A physical mechanism for this model was given in a later publication by Mahajan et al.,Reference Mahajan, Pande, Imam and Rath26 which places Pande's model in the growth accident category.
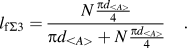
In Pande's model,Reference Pande, Imam and Rath33 the number of coherent twins per grain N is predicted, as shown in Eq. (3). N and l fΣ3 can be related in a manner similar to that for Gleiter's model, taking again the grain size as the equivalent circle diameter of the mean area, d <A>:
 $${l_{{\rm{f}}\Sigma 3}} = {{N{{\pi {d_{ \lt A > }}} \over 4}} \over {\pi {d_{ \lt A > }} + N{{\pi {d_{ \lt A > }}} \over 4}}}\quad {\rm{.}}$$
Rearrangement of Eq. (4) to obtain N using Eq. (2) gives:
 $$N = {{4{l_{{\rm{f}}\Sigma 3}}} \mathord{\left/ {\vphantom {{4{l_{{\rm{f}}\Sigma 3}}} {\left( {1 - {l_{{\rm{f}}\Sigma 3}}} \right)}}} \right. \kern-\nulldelimiterspace} {\left( {1 - {l_{{\rm{f}}\Sigma 3}}} \right)}} = k{\gamma _{\rm{g}}}\log {d_{ \lt A > }} - k{\gamma _{\rm{g}}}\log {d_{ \lt A > 0}}\quad {\rm{.}}$$
For the calculation of Pande's model, the number of coherent twins per grain, N, is calculated from Eq. (5) using the coherent Σ3 length fraction values l fΣ3, which are found in Table V. A plot of N versus log d <A> gives the slope and intercept as 1.045 and −0.946.
3. Grain encounter
The grain encounter theory states that grains, which are initially separated, touch each other during grain growth. If they happen to have a twin orientation, then the grain boundary will orient itself as a coherent twin boundary.Reference Burgers27–Reference Burgers, Meijs and Tiedema29,Reference Meyers and Murr48 Burgers also proposes that the annealing twin density in fcc materials is dependent of the orientation relationship between the growing crystal and the matrix.Reference Burgers, Meijs and Tiedema29
D. Comparison between experimentally measured twin fractions to values calculated from physical models
Coherent Σ3 length fractions for the Cu films were calculated using Gleiter's and Pande's models [Eqs. (1)–(5)] and are plotted in Fig. 5. The model parameters used to plot the prediction of Gleiter's model, as determined by the lowest sum squared error (SSE), are those given by Li et al.,Reference Li, Cahoon and Richards47 except for the twin boundary energy σz, which is found to be 22.53 mJ/m2. This value is about 10% higher than the value of 20.41 mJ/m2 suggested by Li et al. A distinctive feature of the Cu films studied in the current paper is that they have the same thermal conditions, i.e., they were annealed at the same temperature for the same amount of time. Here, grain size and film thickness are considered to be the only independent variables while film thickness is not considered to be an influential factor for twin density in any models described in Sec. III. C. Therefore, as a comparison to Li et al.'s workReference Li, Cahoon and Richards47 in which the temperature dependence of Gleiter's model was emphasized, the grain size dependence of Gleiter's model is evaluated in this paper.
Examination of Fig. 5 shows that both Gleiter's and Pande's models agree quite well with the experimental results. In other words, models for bulk, micron scale Cu work just as well for “nanoscale” Cu. Both models show a monotonic increase of coherent Σ3 length fraction with grain size. In Fig. 5, we are fitting the length fractions of coherent Σ3 boundaries only. Incoherent Σ3 boundaries are believed to form by a different mechanism and are therefore not considered in Gleiter's and Pande's models.
The growth textures of the six films are roughly the same as shown in Fig. 2. Based on the distribution of colors, the films are randomly textured. The orientation distribution of the six films will not be shown in this paper but is similar to the distribution of Darbal et al.'s nanocrystalline Cu films.Reference Darbal, Ganesh, Liu, Lee, Ledonne, Sun, Yao, Warren, Rohrer, Rollett, Ferreira, Coffey and Barmak20 According to Warrington and Boon's work,Reference Warrington and Boon49 the fraction of Σ3 boundaries in a randomly textured film should be less than 2%. As a result, the grain encounter theory, as presented in Sec. III. 3, is ruled out as a possible mechanism to produce the large fraction of twins observed in these Cu films.
IV. CONCLUSIONS
In this work, a series of six Cu films with varying grain sizes and film thicknesses are studied via TEM based orientation mapping. The influence of scan step size on the measurement of all the Σ3 and the coherent Σ3 boundary length fraction was explored. It is found that the scan step size does not influence the grain size and boundary analysis results as long as it is 1/40–1/15 of the average grain size. GBCDs of the Cu films showed a maximum in relative area at the coherent Σ3 position, in agreement with previous reports on the GBCDs of fcc materials. 41–53% of grain boundaries in the Cu films are Σ3 boundaries while about half of the Σ3 boundaries are coherent.
Coherent Σ3 length fractions for the six Cu films were calculated and were shown to increase monotonically with grain size. The results were quantitatively compared to models for the formation of annealing twins. Both Gleiter's growth accident model and Pande's semiempirical model show good agreement with the results, allowing us to conclude that models for micron scale Cu work just as well for “nanoscale” Cu.
ACKNOWLEDGMENT
Financial support of the SRC, Task 1292.008 and 2121.001, and of the MRSEC program of the NSF under DMR-0520425 is gratefully acknowledged. G.S.R. acknowledges financial support from the ONR-MURI under the Grant No. N00014-11-1-0678. Portions of this research were carried out at the Stanford Synchrotron Radiation Lightsource, a Directorate of SLAC National Accelerator Laboratory, and an Office of Science User Facility operated for the U.S. Department of Energy Office of Science by Stanford University.