1. Introduction
Economic and cultural globalization has turned the learning of foreign languages into a socio-economic need. Consequently, the learning of at least one foreign language is a compulsory subject in the academic curricula of most countries in the world (around 81% of the 119 countries analysed in the UNESCO World Report on Cultural Diversity and Intercultural Dialogue in 2009Footnote 1 ). One of the biggest difficulties for learners of a second language (L2) is to accurately perceive and produce the speech sounds of the new language, and only a few individuals manage to achieve high proficiency levels in these skills (Bongaerts, Reference Bongaerts and Birdsong1999; Sebastián-Gallés & Baus, Reference Sebastián-Gallés, Baus and Cutler2005, Sebastián-Gallés & Díaz, Reference Sebastián-Gallés and Díaz2012). The perception and production of speech sounds is fundamental to mastering any language: without an accurate perception of speech sounds, listeners cannot understand what others say, and without an accurate production, they cannot make themselves understood. Evidence has accumulated that in speech perception, difficulties with the perception of L2 sounds leads to inappropriate lexical competitors being active, slowing down the recognition of the intended word (Broersma, Reference Broersma2012; Broersma & Cutler, Reference Broersma and Cutler2008; Broersma & Cutler, Reference Broersma and Cutler2011; Pallier, Colomé & Sebastián-Gallés, Reference Pallier, Colomé and Sebastián-Gallés2001; Sebastián-Gallés, Echeverría & Bosch, Reference Sebastián-Gallés, Echeverría and Bosch2005; Weber & Cutler, Reference Weber and Cutler2004;), resulting in very real problems for L2 learners in communicative situations. Whereas L2 learners can often find ways around such communicative problems by using compensatory strategies (Poulisse, Bongaerts & Kellerman, Reference Poulisse, Bongaerts and Kellerman1990), it still makes the task of communicating more difficult for them, as it makes them less efficient language users. Mastering speech sounds well is thus essential to L2 learning success.
Factors such as age of acquisition (AoA) of the L2, amount of exposure to the L2, and motivation to learn the L2 play a crucial role in ultimate L2 attainment (Birdsong, Reference Birdsong1999), yet they do not fully account for individual variability in L2 learning. Training studies, as well as naturalistic language studies, have shown that individuals that are similar in the aforementioned relevant factors for L2 learning do not profit from equivalent phonetic experience to the same extent (Díaz, Mitterer, Broersma & Sebastián-Gallés, Reference Díaz, Mitterer, Broersma and Sebastián-Gallés2012; Golestani, Molko, Dehaene, LeBihan & Pallier, Reference Golestani, Molko, Dehaene, LeBihan and Pallier2007; Golestani, Paus & Zatorre, Reference Golestani, Paus and Zatorre2002; Sebastián-Gallés & Baus, Reference Sebastián-Gallés, Baus and Cutler2005; Tremblay, Kraus & McGee, Reference Tremblay, Kraus and McGee1998). The present study aims to investigate the origin of the distinct outcomes in the learning of a second language. Finding the origin of individual variability in the learning of the L2 phonemes is crucial for predicting final L2 acquisition and may help to design tailored L2 learning protocols that maximize the success of L2 learning.
The present aim is addressed by using the same experimental design, with slight modifications, as a previous study with early bilinguals (Díaz, Baus, Escera, Costa & Sebastián-Gallés, Reference Díaz, Baus, Escera, Costa and Sebastián-Gallés2008). This previous study suggested that there is a uniquely linguistic capability that varies across individuals and predicts L2 phonological learning (Díaz et al., Reference Díaz, Baus, Escera, Costa and Sebastián-Gallés2008). In that study, early Spanish–Catalan bilinguals were selected according to their proficiency in discriminating two L2 (Catalan) vowels in several behavioural tasks (for a description of the tasks see Pallier, Bosch & Sebastián-Gallés, Reference Pallier, Bosch and Sebastián-Gallés1997; Sebastián-Gallés et al., Reference Sebastián-Gallés, Echeverría and Bosch2005; Sebastián-Gallés & Soto-Faraco, Reference Sebastián-Gallés and Soto-Faraco1999). The two groups were intended to represent the extreme endpoints of non-native phoneme perception and were categorized as good perceivers (GPs) or poor perceivers (PPs). Participants’ sensitivity to acoustic and speech changes was assessed by means of an event-related brain potential, the mismatch negativity (MMN).
The MMN is elicited when the auditory perceptual system detects a mismatch between frequently repeated stimuli (standard stimuli) and stimuli differing in at least one acoustic feature (deviant stimuli) (Näätänen, Reference Näätänen2001; Näätänen, Gaillard & Mäntysalo, Reference Näätänen, Gaillard and Mäntysalo1978). The MMN is a fronto-central negativity, with a reversed polarity at temporal sites, that peaks around 100–250 ms after the detection of a change in the auditory signal and is sensitive to changes both in pure tones and speech sounds (Kujala & Näätänen, Reference Kujala and Näätänen2010; Näätänen, Lehtokoski, Lennes, Cheour, Huotilainen, Iivonen, Vainio, Alku, Ilmoniemi, Luuk, Allik, Sinkkonen & Alho, Reference Näätänen, Lehtokoski, Lennes, Cheour, Huotilainen, Iivonen, Vainio, Alku, Ilmoniemi, Luuk, Allik, Sinkkonen and Alho1997; Nenonen, Shestakova, Huotilainen & Näätänen, Reference Nenonen, Shestakova, Huotilainen and Näätänen2005; Winkler, Kujala, Tiitinen, Sivonen, Alku, Lehtokoski, Czigler, Csépe, Ilmoniemi & Näätänen, Reference Winkler, Kujala, Tiitinen, Sivonen, Alku, Lehtokoski, Czigler, Csépe, Ilmoniemi and Näätänen1999). The MMN can be elicited during passive listening (e.g., while attending to a silent movie) and is, therefore, not influenced by engagement of cognitive processes related to task demands, strategies or motivation. Crucially, the amplitude of the MMN is directly related to the magnitude of the perceived change (Amenedo & Escera, Reference Amenedo and Escera2000; Näätänen, Reference Näätänen2001). There are two brain sources that contribute to the generation of the MMN: a superior temporal generator (related to the processing of the auditory sensory input against a memory trace) and a frontal generator (related to the orienting of attention towards a detected change in the auditory input) (Escera, Alho, Winkler & Näätänen, Reference Escera, Alho, Winkler and Näätänen1998; Giard, Perrin, Pernier & Bouchet, Reference Giard, Perrin, Pernier and Bouchet1990; Näätänen, Reference Näätänen1990; Yago, Escera, Alho & Giard, Reference Yago, Escera, Alho and Giard2001). Note that occasionally an additional parietal MMN generator has been reported (Lavikainen, Huotilainen, Pekkonen, Ilmoniemi & Näätänen, Reference Lavikainen, Huotilainen, Pekkonen, Ilmoniemi and Näätänen1994). The functional dissociation of the MMN temporal and frontal generators allows us to investigate the contributions of each MMN source to potential discrimination problems in poor L2 perceivers. Whereas ERPs cannot directly measure the activity of the MMN generators, it has been claimed that their activity can be inferred from the amplitude and latency of the MMN at frontal and mastoid electrodes. ERP source analyses indicate that temporal electrodes capture the activity only from the temporal MMN generator while the frontal electrodes receive contributions from the temporal and frontal electrodes (Giard et al., Reference Giard, Perrin, Pernier and Bouchet1990). Experimental evidence showing that the frontal and temporal MMN subcomponents can be manipulated independently support this observation. The frontal MMN, but not the temporal one, increases as a function of the probability of the standards stimuli (Sato, Hirooki, Tomiharu, Takeyuki, Naoko, Tadayoshi & Sunao, Reference Sato, Hirooki, Tomiharu, Takeyuki, Naoko, Tadayoshi and Sunao2000), diminishes with alcohol intake (Jääskeläinen, Pekkonen, Hirvonen, Sillanaukee & Näätänen, Reference Jääskeläinen, Pekkonen, Hirvonen, Sillanaukee and Näätänen1996) and decreases over time (Sussman & Winkler, Reference Sussman and Winkler2001). The temporal MMN subcomponent, but not the frontal one, shows additive MMNs for simultaneous frequency and intensity deviations (Paavilainen, Mikkonen, Kilpeläinen, Lehtinen, Saarela & Tapola, Reference Paavilainen, Mikkonen, Kilpeläinen, Lehtinen, Saarela and Tapola2003) and is diminished for speech in temporal lobe epileptic patients (Hara, Ohta, Miyajima, Hara, Iino, Matsuda, Watanabe, Matsushima, Maehara & Matsuura, Reference Hara, Ohta, Miyajima, Hara, Iino, Matsuda, Watanabe, Matsushima, Maehara and Matsuura2012) and stutterers (Corbera, Corral, Escera & Idiazábal, Reference Corbera, Corral, Escera and Idiazábal2005) when compared to controls. The scalp distribution of MMN differences may contribute to differentiating between perceptual (related to the temporal MMN generator) and attentional (related to the frontal MMN generator) origins of differences in the MMN amplitude between groups.
The GPs and PPs tested by Díaz et al. (Reference Díaz, Baus, Escera, Costa and Sebastián-Gallés2008) showed equivalent MMN responses to tones of different frequencies, durations, and predictability in their presentation order. This lack of differences indicated that GPs and PPs had similar general acoustic-perceptual capacities. When the participants were tested with phonemes that belonged either to their native language (the Spanish vowels /e/ and /o/) or to an unknown language (the Estonian vowels /ö/ and/o/), GPs showed larger MMNs compared to PPs, i.e., greater discrimination sensitivity, not only to the native but also to the unknown vowel contrasts. The larger MMN in GPs for phonemes together with the lack of differences for non-linguistic stimuli between the groups was interpreted as a demonstration of a uniquely linguistic ability for (native and non-native) language learning. The difference in the amplitude of the MMN for speech between the groups was present at frontal electrodes, but absent at mastoids, which suggested that the two groups differed in the activity of the frontal MMN generator, whose function is to reorient attention to deviations in the auditory signal. In line, a previous study (Sebastián-Gallés, Soriano-Mas, Baus, Díaz, Ressel, Pallier, Costa & Pujol, Reference Sebastián-Gallés, Soriano-Mas, Baus, Díaz, Ressel, Pallier, Costa and Pujol2012) found larger white matter volume for PPs, as compared to GPs, in a right frontal brain area (i.e., the insulo/fronto-opercular region) and the volume correlated positively with the MMN amplitude (the less negative MMN, the more white matter volume).
Díaz et al. (Reference Díaz, Baus, Escera, Costa and Sebastián-Gallés2008)'s findings contrast with those from training studies of general auditory (i.e., non speech-specific) capabilities being at the basis of individual differences for phonological learning (Golestani et al., Reference Golestani, Molko, Dehaene, LeBihan and Pallier2007; Lengeris & Hazan, Reference Lengeris and Hazan2010; Wong, Perrachione & Parrish, Reference Wong, Perrachione and Parrish2007; Wong, Warrier, Penhune, Roy, Sadehh, Parrish & Zatorre, Reference Wong, Warrier, Penhune, Roy, Sadehh, Parrish and Zatorre2008). For instance, Lengeris & Hazan (Reference Lengeris and Hazan2010) found a positive relation between the learning of new vowels and frequency discrimination for non-speech sounds, and Wong et al. (Reference Wong, Perrachione and Parrish2007) showed a positive correlation between pitch pattern identification in non-speech sounds and the learning of words of a tonal language. The contrasting results between training studies (i.e., general auditory capabilities) and Díaz et al. (Reference Díaz, Baus, Escera, Costa and Sebastián-Gallés2008) (i.e., uniquely linguistic ability) about the origin of individual differences in L2 learning could be due to a difference in age of acquisition of the non-native speech sounds and/or the distinct types of learning situations. Another important difference between Díaz et al. (Reference Díaz, Baus, Escera, Costa and Sebastián-Gallés2008) and previous training studies is the methodology employed to assess learning. Díaz et al. (Reference Díaz, Baus, Escera, Costa and Sebastián-Gallés2008) measured an automatic brain response during passive listening, i.e., the MMN. The use of the MMN may provide a more fine-grained measure of auditory discrimination abilities that is not influenced by differences in attention or motivation to the task.
Crucially, training studies investigated the acquisition of new phonemes in adults while Díaz et al. (Reference Díaz, Baus, Escera, Costa and Sebastián-Gallés2008) studied bilinguals who learned the L2 during childhood (i.e., at 4 years of age). It has been proposed that the neural mechanism that supports language learning changes with development. According to these views, while early language acquisition is rooted in the same brain mechanisms as native language learning, later L2 acquisition recruits distinct brain regions other than those involved in native language processing (for a debate on the topic, see Birdsong, Reference Birdsong1999). Alternatively, one could claim that formal training and more naturalistic language learning play out differently with respect to the role of non-linguistic skills. The bilinguals studied in Díaz et al. (Reference Díaz, Baus, Escera, Costa and Sebastián-Gallés2008) acquired their L2 in the first years of their lives and lived in a fully bilingual society. The participants in training studies are exposed to a less naturalistic learning situation, which may involve the use of different learning strategies (as proposed by Goldinger, Reference Goldinger, Trouvain and Barry2007, and McClelland, McNaughton & O’Reilly, Reference McClelland, McNaughton and O’Reilly1995). Nevertheless, the many differences between the studies make it very difficult to accurately pinpoint a single factor (or combination of factors) that may trigger the different results. Still, these different findings make one wonder whether people who learned a second language in a natural environment, but at a later age than those studied in Díaz et al. (Reference Díaz, Baus, Escera, Costa and Sebastián-Gallés2008), would show a relationship between their speech-specific discrimination abilities, that is, their discrimination of any speech sound (native, L2, or unknown), and their learning of L2 phonemes.
To address the question of whether the variability in the mastery of L2 sounds is explained by speech-specific or general-acoustic capabilities in bilinguals regardless of the age at which the L2 was learned, the present study assessed and analysed the MMN with similar methods and procedures as were used in Díaz et al. (Reference Díaz, Baus, Escera, Costa and Sebastián-Gallés2008) but in a new bilingual population (i.e., late bilinguals) and for additional types of speech changes. In the present study, the participants were late bilinguals who learned the second language in a formal setting rather than through spontaneous social interaction. In addition, the present study investigates, not only the discrimination sensitivity of phonemes that differed in the frequency spectral cues (as was done in Díaz et al., Reference Díaz, Baus, Escera, Costa and Sebastián-Gallés2008), but also of other types of phonetic features, such as duration and nasality information.
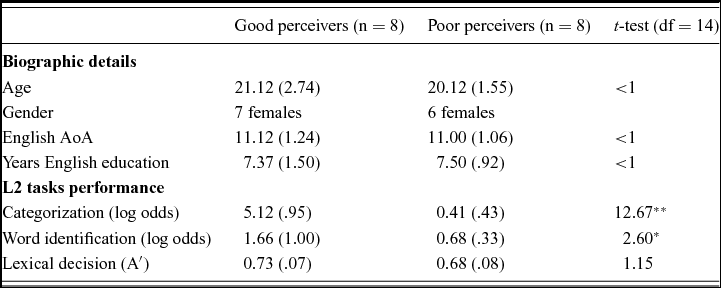
In the present study, analogous to Díaz et al. (Reference Díaz, Baus, Escera, Costa and Sebastián-Gallés2008), GPs and PPs of an L2 vocalic contrast were selected from a population of Dutch–English bilinguals based on their results in different behavioural tasks (see Methods; see Díaz et al., Reference Díaz, Mitterer, Broersma and Sebastián-Gallés2012, for a detailed description of the tasks). All participants were native Dutch (L1) speakers and started learning English (L2) at the age of 10–12 in formal educational settings (Table 1). Note that ‘perfect’ acquisition of L2 phonology is already compromised as early as the age of 4 (Caramazza, Yeni-Komshian, Zurif & Carbone, Reference Caramazza, Yeni-Komshian, Zurif and Carbone1973; Pallier et al., Reference Pallier, Bosch and Sebastián-Gallés1997); hence, in terms of phonological learning, the present sample of participants can be labeled as late bilinguals. The two groups of bilinguals differed in their ability to discriminate the English vowels /æ/ (as in cattle: /kætl/) and /ε/ (as in kettle: /kεtl/). Previous research has shown that it is very difficult to learn a new phonetic contrast when the native language has a single phoneme category falling approximately in between the new contrast (Best, Reference Best and Strange1995; Best & Tyler, Reference Best, Tyler, Bohn and Munro2007; Flege, Reference Flege and Strange1995). This is, for example, the problem that Japanese listeners must face when learning the English /r-l/ contrast (Goto, Reference Goto1971). In the present case, the two English mid-front unrounded vowels /æ/ and /ε/ are perceptually assimilated to the only available mid-front unrounded Dutch vowel /ε/, which is phonetically somewhere between the two English vowels, and are therefore difficult for Dutch listeners to perceive as different vowels (Broersma, Reference Broersma2005; Cutler, Weber, Smits & Cooper, Reference Cutler, Weber, Smits and Cooper2004).
Groups’ biographic details and behavioural performance in L2 phonetic tasks. Standard errors in parenthesis.

Note: *p < .05, **p < .001, AOA = Age of Acquisition.
After participants’ behavioural measurements, GPs and PPs participated in an event-related potentials (ERP) study to measure their auditory discrimination sensitivity to both general-acoustic and speech-specific contrasts by means of the MMN brain response. To evaluate general-acoustic capabilities, the exact same procedures from Díaz et al. (Reference Díaz, Baus, Escera, Costa and Sebastián-Gallés2008) were used. Participants’ discrimination sensitivity to duration and frequency changes were evaluated in an oddball paradigm in which a tone was presented frequently (standard), while three other tones deviating in the magnitude (small, medium and large deviants) of one parameter (either frequency or duration) were presented at a lower probability (deviants). Participants’ capacity to extract patterns from an auditory signal was evaluated by presenting a sequence of two pure alternating tones differing in frequency (standard). The predictable presentation of the tones was sometimes violated by repeating one of the two tones (deviant) (Atienza, Cantero, Grau, Gomez, Dominguez-Marin & Escera, Reference Atienza, Cantero, Grau, Gomez, Dominguez-Marin and Escera2003). To maximally tax the auditory perceptual system and in an effort to increase the likelihood of observing differences between participants, the tones were presented at a fast rate (one tone every 314 ms). Importantly, the lack of reliable MMN signatures for the smaller acoustic changes (i.e., small deviants) in Díaz et al. (Reference Díaz, Baus, Escera, Costa and Sebastián-Gallés2008) in the Duration and Frequency conditions shows that our paradigm is good at examining the limits of the participants’ auditory system.
For the assessment of speech-specific capabilities, the ERP paradigm was similar to that used in Díaz et al. (Reference Díaz, Baus, Escera, Costa and Sebastián-Gallés2008). Native and non-native phonemes were used, but the phonetic stimuli were adapted to the languages the participants knew. The relevance of using native and non-native phonemes is that participants do not vary in their age of acquisition, motivation to learn these phonemes, or amount of exposure. The present study evaluated the discrimination sensitivity of several native phonemic cues. In our previous study, only sensitivity to changes in spectral properties was evaluated because that was the only phonemic relevant cue in the languages spoken by the participants (Spanish and Catalan). In the current study, native speech discrimination abilities were measured for duration and spectral cues because these two types of information are phonemically relevant to discriminate Dutch vowels (Reinisch & Sjerps, Reference Reinisch and Sjerps2013) as well as the English L2 contrast (Díaz et al., Reference Díaz, Mitterer, Broersma and Sebastián-Gallés2012). For the non-native speech contrast a new phonemic cue was included, nasality (air passes through the nose when a phoneme is pronounced, such as in the consonants /m/ or /n/ or in some French vowels), a speech feature that is not a property of Dutch vowels, which are all oral (the air passes through the mouth). Participants’ discrimination sensitivity to each type of phonetic feature was evaluated by presenting in an oddball paradigm vowels that differed only in the target phonetic feature (native duration: /ɔː/-/ɔ/Footnote
2
; native spectrum: /ɑ/-/ɔ/2; non-native nasalization: /
 /-/ɔ/2). In a separate block, the same L2 contrast employed in the behavioural tasks for the selection of the participants, i.e., the English vowels /ε/ and /æ/, was presented in an oddball paradigm. A diminished MMN was expected for the group of PPs compared to GPs because the MMN amplitude should relate to the overt categorization of these vowels (Näätänen et al., Reference Näätänen, Lehtokoski, Lennes, Cheour, Huotilainen, Iivonen, Vainio, Alku, Ilmoniemi, Luuk, Allik, Sinkkonen and Alho1997; Winkler et al., Reference Winkler, Kujala, Tiitinen, Sivonen, Alku, Lehtokoski, Czigler, Csépe, Ilmoniemi and Näätänen1999).
In the present study, the MMN amplitude and scalp distribution, useful for inferring the activity of the MMN generators, are compared for good and poor perceivers for acoustic and speech changes. Based on the hypothesis that differences in L2 phonetic processing in late bilinguals are caused by differences in speech-specific capabilities, as in early bilinguals (Díaz et al., Reference Díaz, Mitterer, Broersma and Sebastián-Gallés2012), we expect the MMN to be larger for GPs compared to PPs only when processing speech, regardless of the experience with the speech sounds presented (i.e., native, L2, or unknown vowels) and of the type of speech information manipulated (i.e., spectrum, duration, or nasality).
2. Methods
2.1. Participants
Selection of the experimental sample
An initial sample of 55 healthy Dutch (L1)–English (L2) late bilinguals was recruited from the Max Planck Institute for Psycholinguistics participant pool (42 females; mean age = 21.16, SD = 2.47). All participants had received on average 7 years (SD = 2.02) of English instruction during primary and secondary education, starting when they were 11 years-old (SD = 1.01). They had lived in the Netherlands all their life in a monolingual Dutch environment and were fluent speakers of English. No participant knew any French. Participants were college or graduate students and did not report having had language, hearing, or learning disabilities. They were paid for their participation.
All participants performed three behavioural tasks designed to evaluate their ability to perceive the English /ε/ - /æ/ vowel contrast that is very difficult for Dutch native listeners to discriminate (Broersma, Reference Broersma2005; Cutler et al., Reference Cutler, Weber, Smits and Cooper2004). The tasks were a categorization task on a seven-step continuum that ranged from /æ/ to /ε/, a word identification task in which participants had to choose which word of an /æ/-/ε/minimal pair they heard, and a lexical decision task in which participants had to judge whether auditory strings containing /æ/ or /ε/ were actual English words (Broersma & Cutler, Reference Broersma and Cutler2011). The categorization task measured acoustic-phonetic analysis, while the other two tasks evaluated phonological representations during lexical access (for a more detailed description of the task and the materials, see Díaz et al., Reference Díaz, Mitterer, Broersma and Sebastián-Gallés2012). In previous studies, a cutoff point was calculated for each task to establish a native-like performance range (the average minus 3 times the standard deviation of the native group). Bilinguals were categorized as good or poor perceivers if they performed consistently within or below natives’ proficiency range respectively (Díaz et al., Reference Díaz, Baus, Escera, Costa and Sebastián-Gallés2008; Díaz et al., Reference Díaz, Mitterer, Broersma and Sebastián-Gallés2012; Sebastián-Gallés & Baus, Reference Sebastián-Gallés, Baus and Cutler2005). However, this criterion could not be used in the present sample because no bilingual performed at native-like levels in all of the three tasks. Instead, we used hierarchical clustering and k-means procedure (IBM SPSS statistics 19) on the average accuracy for the three behavioral tasks to classify the bilinguals as good or poor perceivers (Archila-Suerte, Bunta & Hernandez, in press). A hierarchical cluster analysis using Ward's method of minimum variance with Euclidean square distance intervals revealed two large scale groups of participants. A clear demarcation point in the agglomeration schedule coefficient between two- and one-cluster solutions (74.24 and 281.24 respectively) indicated that a two-cluster solution is the most adequate to split the sample of participants (also confirmed by visual inspection of the dendrogram). The two cluster groups consisted of 28 and 27 participants each. In a second step, k-means clustering with fixed seeds (k = 2) was run. This analysis yielded two clusters of 28 and 27 participants each, the exact same groups as the previous hierarchical cluster analysis. Cluster 1 scored above cluster 2 in the categorization (log odds for cluster 1: 4.10 ± 1.12, cluster 2: 0.24 ± 0.83; t(53) = 14.37, p < 0.001) and the word identification tasks (log odds for cluster 1: 1.28 ± 0.73, cluster 2: 0.83 ± 0.51; t(53) = 3.39, p < 0.05) but were similar for the lexical decision task (A’ for cluster 1: 0.70 ± 0.08, cluster 2: 0.70 ± 0.09; t(53) > 1).
Experimental groups
For the GP group, eight participants were randomly selected from among the 28 participants in cluster 1. They all scored within the native performance range – 3 standard deviations below the natives’ mean (see Díaz et al., Reference Díaz, Mitterer, Broersma and Sebastián-Gallés2012) – in the categorization task. In addition, two of the participants scored within the native range of performance in the lexical decision task and another one in the word identification task. For the PP group, another eight participants were randomly selected from among the 27 participants in cluster 2. They all scored below 3 standard deviations below natives’ mean in all three behavioural tasks except for one (who achieved native-like levels in the lexical decision task). Table 1 displays the details of the participants from the two experimental groups and their accuracy in each behavioural task. All participants were right-handed, as assessed by the Edinburgh Handedness Inventory (Oldfield, Reference Oldfield1971), and gave written informed consent to participate in the study. The experiment was approved by the local research ethics panel.
2.2. Stimuli
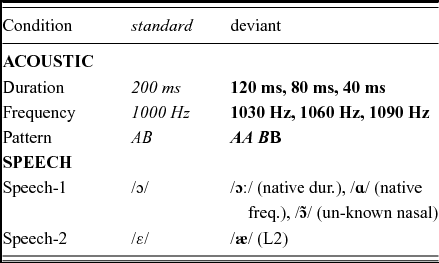
Tonal and speech stimuli were employed. The tonal stimuli were four 1000 Hz pure tones of different durations: 200 ms, 120 ms, 80 ms, 40 ms (Duration condition); four 50 ms pure tones that varied in frequency: 1000 Hz, 1030 Hz, 1060 Hz, 1090 Hz (Frequency condition); and two 50 ms pure tones with a frequency of either 500 or 1000 Hz (Pattern condition) (Table 2). All tones had 10 ms of rise/fall times.
Experimental design and stimuli. Relevant features of standard (italic type) and deviant (bold) stimuli are listed.

The speech stimuli were Dutch (participants’ native language), English (participants’ L2), and French (unknown for participants) vowels (Speech-1 condition). The Dutch and French vowels were synthesized with Klatt synthesizer (Klatt, Reference Klatt1980). The Dutch vowel /ɔ/ was 120 ms long and the formant frequencies were F1 = 500 Hz, F2 = 890 Hz, F3 = 2600 Hz, and F4 = 3500 Hz (Rietveld & van Heuven, Reference Rietveld and van Heuven1997). Its pitch contour linearly fell from 120 to 105 Hz over the duration of the sound, and the nasality parameter was set to 0 to create an oral vowel. The Dutch vowel /ɔː/ was synthesised with the exact same parameters as the vowel /ɔ/ but with a longer duration of 180 ms (Rietveld & van Heuven, Reference Rietveld and van Heuven1997). The native Dutch vowel /ɑ/ was synthesised with the exact same parameters as the vowel /ɔ/ except for the F1 and F2 formant frequencies (680 and 1050 Hz respectively) (Rietveld & van Heuven, Reference Rietveld and van Heuven1997). The non-native French nasal /ɔ(/ was synthesised with the exact same parameters as the vowel /ɔ/ but differed only in the nasality parameter (which was set to 350 Hz).
In addition, participants were presented with the two endpoints of the seven-step continuum used in the categorization task for participant selection, the English vowels /ε/ and /æ/ (Speech-2 condition). They were synthesised with the source-filter synthesis of the PRAAT software (Boersma, Reference Boersma2001). Both vowels were generated based on the average values from four English speakers (/ε/: F1 = 600 Hz, F2 = 1800 Hz; /æ/: F1 = 740 Hz, F2 = 1630 Hz; the other formants were identical: F3 = 2750 Hz, F4 = 3400 Hz, and F5 = 4500 Hz). The pitch contour for both vowels fell linearly from 108 to 90 Hz. The duration of both synthetic stimuli was 165 ms.
2.3. Procedure
The participants’ central sound processing was evaluated for three different general-acoustic features (Duration, Frequency, and Pattern conditions) and for native and non-native phonetic stimuli (Speech-1 and Speech-2 conditions) (see Table 2) (Díaz et al., Reference Díaz, Baus, Escera, Costa and Sebastián-Gallés2008; Corbera et al., Reference Corbera, Corral, Escera and Idiazábal2005). Each condition was presented in separate blocks.
In the Duration and Frequency conditions, the tones were presented in an oddball paradigm in which the standard tone was presented with a probability of .8 (600 standard tones per block), and the probability of each deviant (small, medium and large) was .066 (50 presentations of each deviant tone per block). In the Frequency condition, a 1000 Hz tone was the standard, and a 1030 Hz (small deviant), a 1060 Hz (medium deviant), and a 1090 Hz (large deviant) tones were the deviants. In the Duration condition, the standard tone had a length of 200 ms, while the deviants had a length of 120 ms (small deviant), 80 ms (medium deviant), and 40 ms (large deviant). The stimulus onset asynchrony (SOA) was 314 ms.
In the Pattern condition, 400 trains of six tones were presented (2400 tones all together). Each train was created by presenting alternately two tones with a frequency of 1000 and 500 Hz each. Tones within and between the trains were presented at a constant SOA of 128 ms (onset-to-onset inter-train interval: 768 ms). Stimulus trains were presented in a predictable way: ‘ABABAB-BABABA-BABABA-ABABAB. . .’ in which ‘A’ represents the 500 Hz tone, ‘B’ the 1000 Hz tone, ‘-’ indicates the beginning of the trains, and ‘A’ and ‘B’ denote the deviant event, i.e., repetition of the last tone presented in the preceding train.
Two blocks assessed phoneme discrimination capabilities. In the Speech-1 block, the standard stimulus was the Dutch vowel /ɔ/ and the deviant stimulus were the Dutch vowel /ɔː/ (native duration deviant), the Dutch vowel /ɑ/ (native spectrum deviant), and the French vowel /
/ (unknown nasal deviant). The presentation probability of the standard vowel was .8 (600 standard presentations per block), and each deviant probability was .066 (50 presentations of each deviant tone per block). In the Speech-2 block, the standard stimulus was the English vowel /ε/ and had a presentation probability of .8 (400 standard presentations), while the deviant stimulus was the English vowel /æ/ and had a presentation probability of .2 (100 presentations). Vowels were presented with a constant SOA of 488 ms.
For all oddball conditions except for Pattern, stimuli were presented in a random order with the restriction that the first five stimulus of the blocks were always a standard and that at least one standard was presented between two deviants.
Eight presentation lists were created, including two presentations of each condition to have enough trials for each of the deviants (100 deviant trials) except for the Speech-2 condition which was presented only once because one block already contained 100 deviant trials. First, the three acoustic conditions and the Speech-1 condition appeared in random order, and after a short break, they were repeated in the reverse order. The Speech-2 block was assigned randomly to one position. Lists were counterbalanced between groups.
ERP measurements took place in an electrically shielded, soundproof room at the Donders Centre for Cognitive Neuroimaging in Nijmegen, the Netherlands. Testing took place in one session several weeks after the behavioural tests. During the EEG recording, participants sat in a comfortable chair in a dimly illuminated, sound-attenuating booth. Participants were instructed to ignore the auditory stimulation and to watch a silent movie. All the stimuli were delivered binaurally via a loudspeaker set, placed approximately 1.5 m in front of the participants, at an intensity of 80 dB. The experimental session lasted about one hour, including a ten-minute break.
2.4. Electrophysiological recording
The ERPs were recorded from the scalp using a 32-channel BrainCap with sintered Ag/AgCl electrodes and two additional electrodes located at the two mastoids (LM, RM). Eye movements were measured with electrodes attached to the infra-orbital ridge of the right eye and on the outer canthus of the right and left eyes. The common EEG/EOG reference was attached to the tip of the nose. Electrode impedances were kept below 5 kOhm. The electrophysiological signals were filtered online with a bandpass of 0.1–100 Hz and digitized at a rate of 500 Hz.
The EEG was offline filtered with a bandpass of 0.1–30 Hz and a slope of 12 dB/oct). ERPs were averaged offline for standard and deviant stimuli, separately for each participant and condition. Automatic ocular correction was performed using the method of Gratton and Coles (BrainVision Analyzer Software package v. 1.05; Brain Products GmbH, Munich, Germany). Epochs with EEG exceeding either ±100 μV after baseline subtraction at any channel, activity lower than 0.5 μV, or more than 50 μV voltage step/sampling within intervals of 200 ms were automatically rejected offline. Standard stimulus epochs occurring immediately after deviant stimulus epochs were excluded from the analysis. For each deviant at least 55 trials were accepted. Epochs included a pre-stimulus baseline of 100 ms in all cases and were 500 ms long. Baseline was corrected, and lineal DC detrend procedure was performed on the individual segments.
2.5. Data analysis
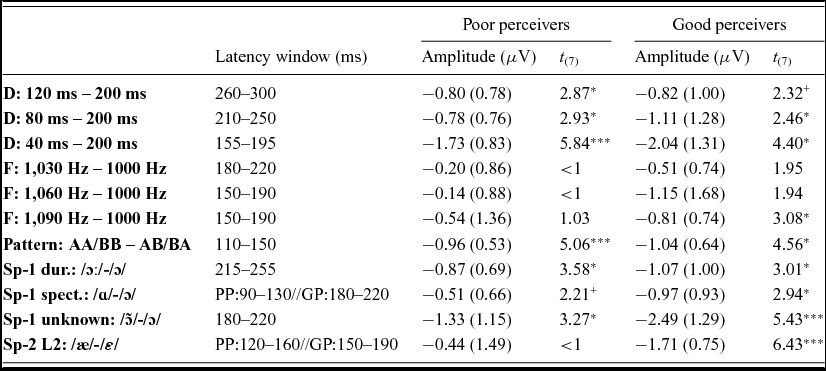
The MMN was identified in the difference waves (obtained by subtracting ERPs elicited by the standards from those elicited by the deviants) at the Fz electrode in a 100–300 ms time window after stimulus onset for each group. For most comparisons, the MMN peaked at the same latency for both groups, except for two speech comparisons (the native frequency comparison /ɑ/ - /ɔ/ and the L2 comparison /æ/- /ε/) for which the negativity slope started at the same time point for both groups but peaked earlier for the PP group (Figure 3). For the statistical analysis, the MMN was measured for each participant group and condition as the mean amplitude in a 40 ms latency window centered in its group maximum peak (Table 3). To test whether a significant MMN was elicited in each group and condition, one sample t-tests were carried out to compare the amplitudes of the MMN component at the Fz electrode against the zero level (Table 3). In addition, the number of trials accepted for each participant and deviant were submitted to t-tests comparisons to ensure that a similar number of trials was averaged for each group of participants. The t-test did not reveal significant differences in the number of trial averaged for good and poor perceivers for any of the deviants (for all t-tests p > .1).
T-test of the MMN mean amplitude for the acoustic (D = Duration, F = Frequency, P = Pattern) and speech conditions at the Fz electrode. Degrees of freedom in subscripts.

Note + p < 0.065, *p < 0.05, ***p < 0.001.
A 5-way (2×2×2×2×3), repeated-measures ANOVA compared the MMN amplitudes for the two groups (factor ‘Group’) in the Tone and Speech condition types (factor ‘Condition type’). To test also whether the groups differed in the scalp distribution of the MMN, the factors ‘Laterality’ (left electrodes: C3 and F3, and right electrodes: C4 and F4) and ‘Frontality’ (frontal electrodes: F3 and F4, and central electrodes: C3 and C4) were included in the ANOVA. The factor ‘Deviant feature’ was included nested within the factor ‘Condition type’. For the Tone condition type, there were 3 deviant features: duration (the mean MMN amplitude of the three duration deviants), frequency (the mean MMN amplitude of the three frequency deviants), and pattern. For the Speech condition type, there were also 3 deviant features: duration (deviant /ɔː/), spectral (deviant /ɑ/), and nasal (deviant /
/). The L2 deviant /æ/ was not included in the analysis because it was expected to elicit a larger MMN in the GP group than in the PP groups according to the behavioural tasks.
Further repeated-measures ANOVAs were calculated for each condition separately (Frequency, Duration, Pattern, Speech-1, and Speech-2) with the factors ‘Laterality’, ‘Frontality’, ‘Deviant’, and ‘Group’.
When differences between the groups were found (i.e., significant main effect or interaction involving the factor ‘Group’), a second ANOVA was performed with the additional factor ‘MMN generator’ (frontal: F3, F4 vs. mastoids: LM, RM) to investigate the contributions of the temporal and frontal MMN sources to individual differences in phoneme perception.
No correction for multiple comparisons was applied to the present planned comparisons because we had strong hypotheses based on our previous studies (Díaz et al., Reference Díaz, Baus, Escera, Costa and Sebastián-Gallés2008; Sebastián-Gallés et al., Reference Sebastián-Gallés, Soriano-Mas, Baus, Díaz, Ressel, Pallier, Costa and Pujol2012): we expected GPs and PPs to have similar MMNs for the tone conditions and GPs to have larger MMNs for speech sounds at frontal, but not mastoid, electrodes. All main effects are reported. However, only interactions involving the factor ‘Group’ are reported. Significance levels of the F-ratios were adjusted with the Greenhouse–Geisser correction for effects with more than 1 degree of freedom in the numerator, and the corrected p values are reported.
3. Results
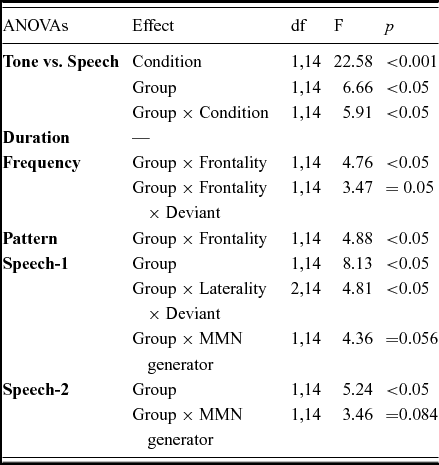
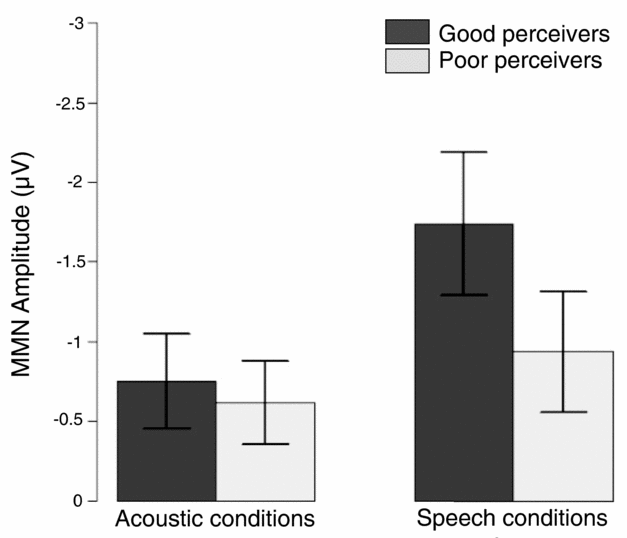
Table 4 displays the effects that reached significance in the ANOVAs. The ANOVA comparing the GPs and PPs for all conditions together showed significant differences between the two groups (F(1,14) = 6.66, p < .05). The main effect of ‘Condition type’ (F(1,14) = 22.58, p < .001) was also significant. Crucially, the interaction ‘Group’ × ‘Condition type’ reached significance (F(1,14) = 5.91, p < .05) (Figure 1). No other main effect or interactions with the factor ‘Group’ were significant. To investigate in which conditions GPs and PPs differed, separate ANOVAs were performed for the acoustic and speech conditions.
Significant effects yielded by the ANOVAs comparing the groups for all the conditions together and each condition separately.

Mean MMN amplitudes for the acoustic and speech conditions. Bars represent the mean MMN amplitudes for the two types of conditions (acoustic and speech) for good and poor perceivers. Error bars represent standard deviations.

3.1. Acoustic conditions
MMN elicited in the Duration condition
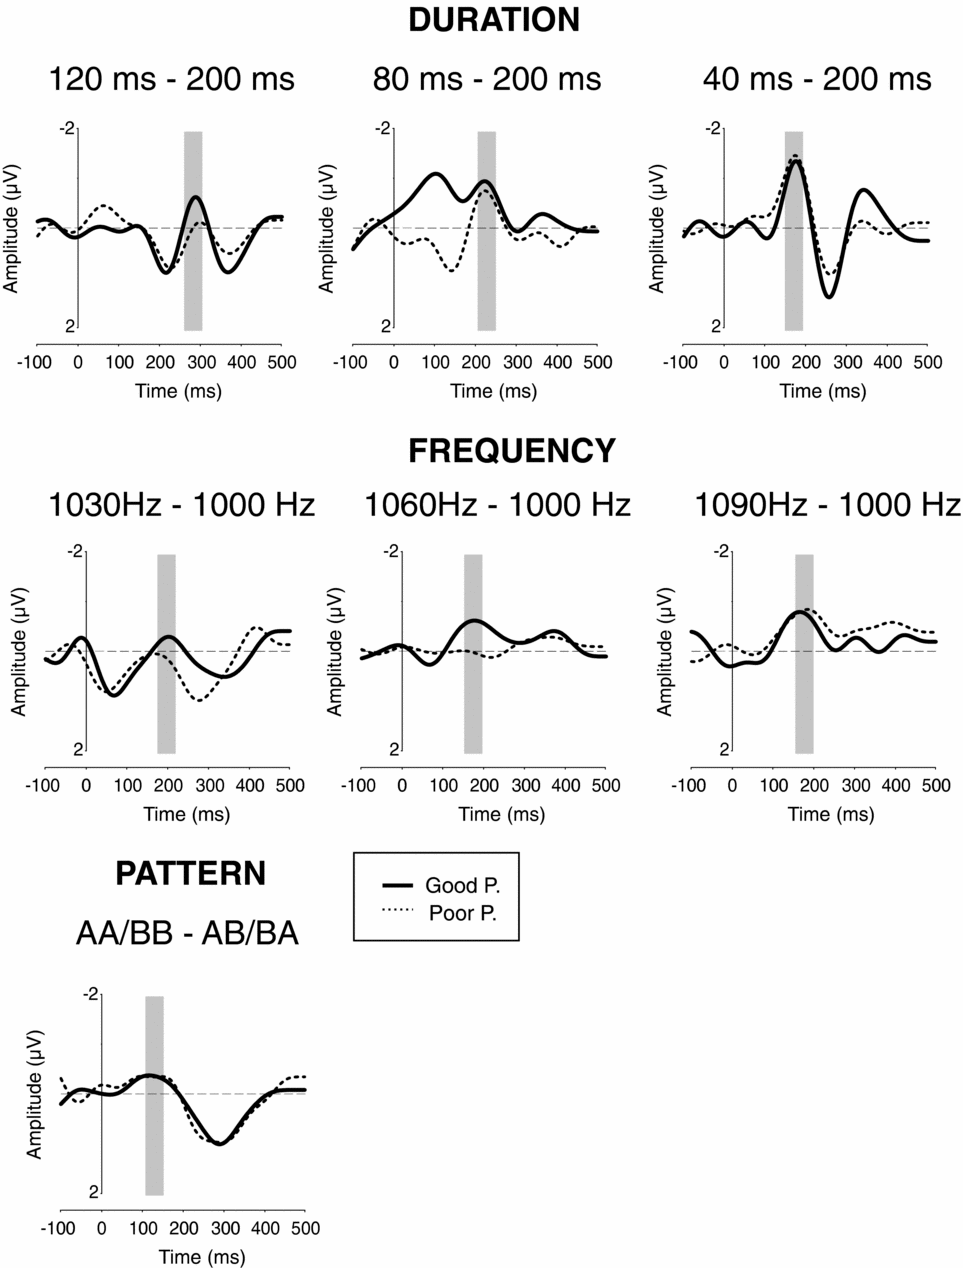
Both groups displayed a reliable MMN in response to the large (40 ms) and medium (80 ms) deviants compared to the standard, which had a duration of 200 ms (Table 3). The MMN elicited by the small deviant (120 ms) was significant for the PP group and marginally significant for the GP group.
When the MMN amplitudes were submitted to an ANOVA, the factor ‘Group’ did not reach significance (F (1,14) < 1) and did not interact with any other factor (all p > .05) (Figure 2). A main effect of ‘Deviant’ was observed (F (2,28) = 6.85; p < .05). The large deviant elicited a more prominent MMN than the medium (t (15) = 2.94, p < .05) and the small deviants (t (15) = 4.19, p = .001) (amplitude means: deviant 120 ms = −.56 μV, deviant 80 ms = −.81 μV, deviant 40 ms = −1.57 μV). No differences were present between the MMNs elicited by the medium and the small deviant (t (15) < 1).
MMNs for the acoustic conditions. The grand-mean difference waves (responses elicited by the standard stimuli subtracted from that elicited by the deviant stimuli) are displayed for the good and poor perceivers in the acoustic conditions (duration, frequency and pattern conditions) at the C3 electrode. Grey boxes indicate latency windows of the MMNs. For visualization purposes, this data is displayed with a low-pass filter of 8Hz.

MMN elicited in the Frequency condition
The large deviant stimuli (1090 Hz, standard: 1000 Hz) elicited a reliable MMN for the GP group. The other negativities assessed did not reach significance (Table 3). Note that despite the rather large amplitude (−1.15 μV), the negativity for the middle deviant in the GP group was not different from the zero level because of the large variability across participants (the standard deviation was ±1.68 μV and larger than the mean amplitude difference).
The ANOVA did not reveal group differences (F (1,14) = 2.44, p = .140). The factor ‘Group’ interacted significantly with ‘Frontality’ (F (1,14) = 4.76, p < .05) and the triple interaction ‘Group’ × ‘Frontality’ × ‘Deviant type’ was also significant (F (1,14) = 3.47, p = .05). To explore whether group differences caused the triple interaction, t-test comparisons between the two groups were performed separately for each deviant type at each frontal and central electrodes. None of the t-test yielded significant results (all p > 0.1).
MMN elicited in the Pattern condition
Both groups showed a reliable MMN response (Table 3). The statistical comparisons revealed that the negativity was not different between the two groups (F (1,14) < 1) (Figure 2). The factor ‘Frontality’ was significant (F (1,14) = 11.65, p < .05) due to the enhancement of the negativity at frontal electrodes (frontal = −.84 μV, central = −.40 μV). The factor ‘Frontality’ interacted significantly with the factor ‘Group’ (F (1,14) = 4.88, p < .05). The subsequent t-test comparisons of the MMN amplitude at each electrode did not reveal any significant difference between the two groups (all p >.05).
3.2. Speech conditions
MMN elicited in the Speech-1 condition
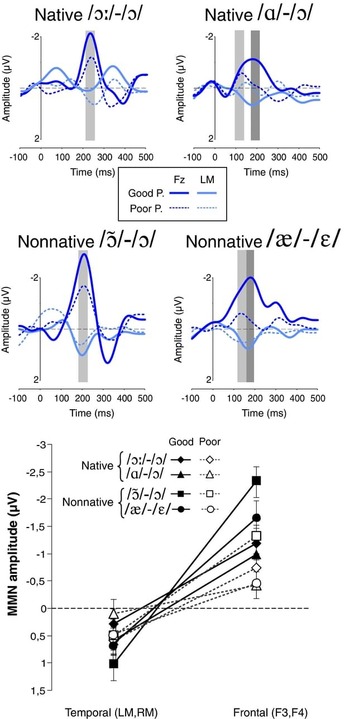
The native duration deviant phoneme /ɔː/ (different from the standard phoneme only in duration) elicited a reliable MMN in both groups of participants; the native spectrum deviant phoneme /ɑ/ (different from the standard phoneme only in the spectrum) elicited a reliable MMN in the GP group and a marginally significant MMN in the PP group. The non-native deviant, the unknown French nasal vowel /ɔː/ (different from the standard phoneme only in nasalization) triggered a reliable MMN in both groups.
The analysis revealed a significant main effect of ‘Group’: GPs showed larger MMNs for phonetic stimuli than PPs (F
(1,14) = 8.13, p < .05; GP = −1.73 μV, PP = −.93 μV) (Figure 3). This effect was not qualified by a ‘Group’ × ‘Deviant’ interaction (F
(1,14) < 1), meaning that the PP group showed smaller mismatch detection for all kinds of deviants (spectrum, duration, and nasality). In addition, there was a main effect of the factor ‘Deviant’ (F
(2,28) = 6.93, p < .05). T-test comparisons showed that the negativity elicited by the deviant non-native phoneme /
/ was larger from the ones elicited by each native deviant vowel (/
/ vs. /ɔː/: t
(15) = 3.53, p < .05; /
/ vs. /ɑ/: t
(15) = 2.86, p < .05). The MMN to the native deviant Dutch phonemes /ɔː/ and /ɑ/ were not different (t
(15) < 1) (MMN mean amplitudes: /ɔː/ = −.97 μV, /ɑ/ = −.74 μV, /
/ = −1.91 μV). The factor ‘Frontality’ also reached significance (F
(2,28) = 10.08, p < .05) revealing a central scalp prominence of the MMN (frontal = −1.15 μV, central = −1.51 μV).
MMNs for the speech conditions. The grand-mean difference waves (responses elicited by the standard stimuli subtracted from that elicited by the deviant stimuli) are displayed for the good and poor perceivers in the speech conditions (speech-1 and speech-2 conditions) at the C3 electrode. Grey boxes indicate latency windows of the MMNs. When the latency of the MMN peak maxima is different between the groups, MMN latency windows for good perceivers are in dark grey boxes and the ones for poor perceivers are in light grey boxes (upper panel). For visualization purposes, this data is displayed with a low-pass filter of 8Hz. Mean amplitude values for both groups at frontal (F3, F4) and temporal (LM, RM) electrodes for all deviants in the speech conditions. Error bars depict standard errors (bottom panel).

The triple interaction ‘Deviant’ × ‘Laterality’ × ‘Group’ was also significant (F
(2,28) = 4.81, p < .05). T-test comparisons between the two groups were performed separately for each deviant and electrode. GPs had larger MMNs than PPs at right electrodes for the native deviant /ɑ/ (at F4: t
(14) = 2.32, p < .05, GP: −1.10 μV, PP: -0.25 μV) and for the non-native deviant /
/ (at F4: t
(14) = 2.17, p < .05, GP: −2.53 μV, PP: −1.29 μV; at C4: t
(14) = 2.23, p < .05, GP: −2.94 μV, PP: −1.34 μV). A further ANOVA was carried out to investigate the role of the frontal and temporal MMN generators in the group differences (Figure 3). There was a main effect of the factor ‘Generator’ (F
(1,14) = 59.82, p < .001) due to the reversal of the frontal negativity at the mastoid electrodes (frontal = −1.15 μV, mastoids = .51 μV). The factor ‘Group’ did not reach significance (F
(1,14) = 2.22, p > .05) but the interaction ‘Group’ × ‘MMN generator’ was marginally significant (F
(1,14) = 4.36, p = .056). Subsequent analyses showed significant differences between the two groups at the frontal electrodes (t
(14) = 2.36, p < .05; GP = −1.49 μV, PP = −.82 μV) but not at the temporal ones (t
(14) < 1; GP = .63 μV, PP = .40 μV). That is, the amplitude of the MMN was larger for GPs than for PPs only at the frontal electrodes. As in the previous ANOVA, the triple interaction ‘Deviant’ × ‘Laterality’ × ‘Group’ reached significance (F
(2,28) = 3.98, p < .05). Further t-test comparisons between the groups for each deviant and electrode separately showed, as in the previous ANOVA, a larger MMN for GPs at the F4 electrode for the native deviant /ɑ/ and the unknown deviant /
/.
MMN elicited in the Speech-2 condition
The deviant L2 phoneme /æ/ elicited a reliable MMN only for the GP group (see Table 3). The ANOVA revealed a main effect of ‘Group’ (F (1,14) = 5.24, p < .05) with a larger MMN in the GP group than in the PP group (GP = −1.61 μV, PP = −.47 μV) (Figure 3). This result is in line with the behavioral differences in the discrimination abilities of the two groups for the L2 contrast /æ/ - /ε/, on the basis of which these groups were formed. The main effect of ‘Laterality’ was also significant (F (1,14) = 13.29, p < .05) revealing a larger MMN at left than at right-hemisphere electrodes (right = −.89 μV, left = −1.18 μV).
An ANOVA comprising the factors ‘MMN generator’, ‘Laterality’, and ‘Group’ again revealed a generator effect (F (1,14) = 19.29, p < .001) caused by the change in polarity at temporal sites (frontal = −1.05 μV, mastoids = .59 μV) (Figure 3). The interaction between the factors ‘Group’ and ‘MMN generator’ was marginally significant (F (1,14) = 3.46, p = .084). Further analyses showed that the MMN was larger for the GP than the PP group at the frontal generator (t (14) = 2.49, p < .05; GP = −1.65 μV, PP = −.45 μV), while no differences were observed at the temporal one between the two groups (t (14) < 1; GP = .69 μV, PP = .49 μV).
4. Discussion
The present study compared auditory discrimination sensitivity of speech and non-speech sounds by good (GPs) and poor (PPs) perceivers of an L2 speech contrast, as indexed by the event-related potential MMN. Comparable MMN responses were elicited by the two groups of participants in three acoustic conditions (involving tones varying in frequency, duration, and presentation pattern) suggesting that the groups did not differ in the processing of non-speech stimuli. The lack of reliable MMN signatures for deviant stimuli with a small magnitude in both the Duration and the Frequency conditions shows that our paradigm was good at examining the limits of the participants’ auditory system, because both rougher and finer discriminatory abilities were evaluated (similar results were found previously for early bilinguals with the same experimental design, Díaz et al., Reference Díaz, Baus, Escera, Costa and Sebastián-Gallés2008).
The two groups differed in their MMN responses to phonetic stimuli. GPs exhibited larger MMNs than PPs during the processing of phonetic changes, indicating greater discrimination sensitivity of speech sounds in GPs as compared to PPs. Crucially, the distinct sensitivity of the two groups was present no matter what type of speech information changed (i.e., duration, spectrum, and nasality) and their previous experience with the phonemes (i.e., native, L2, and unknown). This result suggests that all speech sounds, regardless of their familiarity, are processed by the same cognitive mechanism and that variations in the capability of this mechanism originate individual differences in the learning of second languages. The present findings agree with previous studies showing that individual variability between L2 phoneme learners is present in the perception of speech sounds but not of pure tones (Díaz et al., Reference Díaz, Baus, Escera, Costa and Sebastián-Gallés2008; Golestani & Zatorre, Reference Golestani and Zatorre2009). An open question is whether the individual differences in speech discrimination are driven by the linguistic status of the speech sounds or the acoustic complexity of speech. To the best of our knowledge, this question has yet to be investigated.
When comparing the scalp distribution of the group differences to the speech sounds, a marginally significant interaction was found between the scalp distribution of the MMN and the groups. Posterior t-test showed that GPs had larger MMN at frontal electrodes as compared to PPs, whereas the MMN was similar between the groups at the mastoids. The frontal scalp distribution of the group differences is analogous to the findings of Díaz et al. (Reference Díaz, Baus, Escera, Costa and Sebastián-Gallés2008). The present findings are in line with those of a previous magnetic resonance imaging study in which GPs and PPs early bilinguals were found to have different white matter volumes at frontal, but not temporal regions (Sebastián-Gallés et al., Reference Sebastián-Gallés, Soriano-Mas, Baus, Díaz, Ressel, Pallier, Costa and Pujol2012). Sebastián-Gallés et al. (Reference Sebastián-Gallés, Soriano-Mas, Baus, Díaz, Ressel, Pallier, Costa and Pujol2012) found larger white matter volume in the right insulo/fronto-opercular region for PPs, as compared to GPs, and, importantly, the white matter volume in this frontal region was correlated with the MMN amplitude (the less negative MMN, the more white matter volume). These convergent results suggest differences between GPs and PPs in frontal MMN generators. Distinct functional contributions have been attributed to each MMN generator (Deouell, Reference Deouell2007; Shalgi & Deouell, Reference Shalgi and Deouell2007). The temporal generator is claimed to be related to the comparison of the incoming auditory sensory input and a memory trace. Although one cannot accurately identify MMN generators with ERPs, several studies support that the activity of the MMN generators can be inferred from the amplitude, latency and scalp distribution of the MMN (Escera et al., Reference Escera, Alho, Winkler and Näätänen1998; Giard et al., Reference Giard, Perrin, Pernier and Bouchet1990; Näätänen, Reference Näätänen1990; Yago et al., Reference Yago, Escera, Alho and Giard2001). Therefore, the absence of differences in the activity generated at mastoids could be interpreted as both groups being equally able to represent and integrate the incoming phonemic auditory information. The frontal generator is claimed to sustain the re-orienting of attention to changes in the auditory signal. Hence, the differences observed at frontal electrodes suggest that the two groups may differ in the way the disparity between an incoming mismatching phoneme and the standard phoneme neural representation triggers involuntary attention. Following this rationale, GPs and PPs seem to differ in the domain general, cognitive mechanism that allows them to reallocate attentional resources to novel and rare speech sounds. This result implies that the learning of new phonemes requires not only a sensory distinction between phonemes, but also attentional processes to successfully represent the new sounds in long-term storage.
The present results are also relevant for the issue of age differences in language learning. It has been proposed that the neural mechanism that supports speech learning changes with development. The fact that early exposure to an L2 has a beneficial impact on the mastery of second languages has led to the claim that distinct brain learning mechanisms sustain language learning at different ages (Johnson & Newport, Reference Johnson and Newport1989; Lenneberg, Reference Lenneberg1967; Oyama, Reference Oyama1976; Patkowski, Reference Patkowski1980; Pulvermüller & Schumann, Reference Pulvermüller and Schumann1994; Weber-Fox & Neville, Reference Weber-Fox and Neville1996). Nevertheless, recent neuroimaging data indicate that there is a common brain network for language processing, regardless of the age of initial learning, and that the age of initial learning of the L2 had only a modulatory effect on the strength of the brain activations (Perani et al., Reference Perani, Paulesu, Sebastián-Gallés, Dupoux, Dehaene, Bettinardi, Cappa, Fazio and Mehler1998; for a meta-analysis see Indefrey, Reference Indefrey2006; for a review see Perani & Abutalebi, Reference Perani and Abutalebi2005; for opposite findings see Kim, Relkin, Lee & Hirsch, Reference Kim, Relkin, Lee and Hirsch1997; Wartenburger, Heekeren, Abutalebi, Cappa, Villringer & Perani, Reference Wartenburger, Heekeren, Abutalebi, Cappa, Villringer and Perani2003). The present results are in line with the conclusion that shared neural mechanisms are involved in the processing of languages, regardless of the age of initial exposure to an L2 (see also Sebastián-Gallés & Díaz, Reference Sebastián-Gallés and Díaz2012). The present study on late bilinguals replicates previous findings in early bilinguals (Díaz et al., Reference Díaz, Baus, Escera, Costa and Sebastián-Gallés2008): namely, GPs and PPs differed in their discrimination accuracy of all phonemes – L1, L2, and unknown – but not in their sensitivity to general-acoustic changes. The similarity in the results on early and late bilingualsFootnote 3 suggests that the perception and processing of native and L2 phonemes (and even of unknown phonemes) are sustained by the same brain mechanism, regardless of the age at which a language is learned or the previous experience with the language.
An important difference between the population of early bilinguals studied previously (Díaz et al., Reference Díaz, Baus, Escera, Costa and Sebastián-Gallés2008) and the present study is the distribution of the participants’ accuracy across the behavioral tasks used to evaluate the mastery of an L2 vowel contrast. In both studies bilingual participants performed three tasks that aimed to evaluate their mastery of a difficult L2 vowel contrast across several phonological processes: from acoustic-phonetic analysis (categorizing isolated vowels) to lexical access (detecting vowel mispronunciations within words). In the Díaz et al. (Reference Díaz, Baus, Escera, Costa and Sebastián-Gallés2008) study, the GPs performed similar to a group of native listeners in all three tasks, while the PPs performed below the native listeners’ range in all three tasks. Therefore, the two groups represented the extreme endpoints of non-native phoneme perception. In the present study, the difference between GPs and PPs was not so sharp: that is, participants with native-like accuracy in one task sometimes had low scores in another task. Because of the less clear division between skilled and less skilled listeners, they were classified on their scores in the categorization task, which assessed the most basic phonological processes (i.e., acoustic-phonetic analysis, Díaz et al., Reference Díaz, Mitterer, Broersma and Sebastián-Gallés2012). Importantly, despite the different selection criteria between the present study and the Díaz et al. (Reference Díaz, Baus, Escera, Costa and Sebastián-Gallés2008), the MMN assessed in the present study in response to speech was again different between the two groups of late bilinguals.
The present results also show that the MMN is a reliable measure to capture group differences in speech perception. Firstly, the MMN relates to behavioural discrimination of difficult L2 phoneme contrasts (Amenedo & Escera, Reference Amenedo and Escera2000; Näätänen, Reference Näätänen2001). Accordingly, in the present study, only the GPs showed a reliable MMN in response to the deviant phoneme /æ/. This result reinforces the validity of the criteria established for selecting the participants. Secondly, the agreement between the behavioural and MMN results for the L2 contrast speaks for the extrapolation of the MMN results with synthetic, isolated phonemes to natural speech. GPs were more accurate than PPs in discriminating the L2 phonemic contrast in the word identification task for which sentences recorded by a native speaker were presented. In line with this finding, GPs displayed a larger MMN to isolated, synthetic L2 vowels than PPs. Thirdly, the MMN allows the measurement of subtle differences in native perception in healthy individuals that, otherwise, are highly difficult to assess with behavioural studies because of the robustness of native processing.
This is the first study that assesses the MMN elicited by a nasal vowel in non-native listeners. Nasal vowels are easy to discriminate from oral vowels (Hawkins & Stevens, Reference Hawkins and Stevens1985) and should elicit a MMN in non-native listeners (Nenonen et al., Reference Nenonen, Shestakova, Huotilainen and Näätänen2005). Unexpectedly, the MMN to the non-native nasal deviant was significantly larger than to the other speech deviants suggesting that a change in nasality is much more salient than a change in formant frequency or duration (perhaps because it is acoustically a more prominent contrast than the other ones or perhaps because non-native listeners interpret the nasal vowels as an oral vowel followed by a nasal consonant as /n/ or /m/; Lahiri & Marslen-Wilson, Reference Lahiri and Marslen-Wilson1991).
Whether the findings of the present study can be generalized to phoneme training studies is an open question. In contrast to the present findings, training studies usually attribute variability in phoneme learning to general-acoustic capabilities (Golestani et al., Reference Golestani, Molko, Dehaene, LeBihan and Pallier2007; Lengeris & Hazan, Reference Lengeris and Hazan2010; Wong et al., Reference Wong, Perrachione and Parrish2007; Wong et al., Reference Wong, Warrier, Penhune, Roy, Sadehh, Parrish and Zatorre2008; for speech-specific origin of learning success in a training study, see Golestani & Zatorre, Reference Golestani and Zatorre2009). A plausible reason for the opposite results between this and training studies is that natural and training learning experiences trigger distinct types of learning strategies and processes (Goldinger, Reference Goldinger, Trouvain and Barry2007; McClelland et al., Reference McClelland, McNaughton and O’Reilly1995). For example, differential activation of striatal regions has been shown for training involving mere passive observation compared with feedback of a non-native contrasts (the English /r-l/ contrast in Japanese listeners) (Tricomi, Delgado, McCandliss, McClelland & Fiez, Reference Tricomi, Delgado, McCandliss, McClelland and Fiez2006). The many differences between the populations studied and the distinct procedures to assess the relation between individual variability in language learning and in auditory perception make it highly difficult to discern the cause of the distinct results found by natural and training learning studies.
The present results suggest that the mastery of the L2 sounds relates to both native and unknown phoneme discrimination abilities for several types of speech information in late bilinguals. Because similar results were reported for early bilinguals (Díaz et al., Reference Díaz, Baus, Escera, Costa and Sebastián-Gallés2008), we conclude that variability in the learning of non-native speech-sounds stems from variability in a uniquely speech-specific capability, regardless of the age of onset of L2 learning, and a continuity of the mechanism for L2 learning through lifespan. Hence, the assessment of speech discrimination capabilities of speech sounds, regardless of the familiarity, is a general index of linguistic abilities and can predict the successful learning of non-native phonemes.