I. Introduction
The increasing integration of international trade has been extensively studied in the economic literature and is a continuing source of debate, with some studies assuming perfect competition. However, under certain circumstances, monopolistic competition seems more appropriate and representative of a high level of product differentiation (Livat, Alston, and Cardebat, Reference Livat, Alston and Cardebat2019). This is the case with wine, which is a highly differentiated experience good for which consumers consider several attributes in the selection process (e.g., price, taste, color, and brand). This has led some studies (e.g., Costanigro, McCluskey, and Mittelhammer, Reference Costanigro, McCluskey and Mittelhammer2007; Rebelo et al., Reference Rebelo, Gouveia, Lourenço-Gomes, Marta-Costa, Jordão and Cosme2018) to suggest that there are several markets for wine instead of just one. As happens for other consumption goods, the quality can be assessed by observable technical characteristics that determine whether a wine is good or bad, pointing to vertical differentiation. Nevertheless, horizontal differentiation also exists because a consumer's own preferences play an important role in making a decision. By studying wine experts’ opinions, Cardebat and Livat (Reference Cardebat and Livat2016) argue that a wine (even one with no evident defects) can be pleasant for one consumer and unpleasant for another, depending on subjective quality appreciation. Additionally, some authors (e.g., Gergaud and Ginsburgh, Reference Gergaud and Ginsburgh2010; Cardebat and Livat, Reference Cardebat and Livat2016; Livat, Alston, and Cardebat, Reference Livat, Alston and Cardebat2019) suggest that horizontal differentiation can be measured by reference to designations of origin. In summary, given the product differentiation observed in the wine industry, the analysis of this industry calls for the use of models that fit monopolistic competition well; this is the case for the gravity model for international trade.
In recent years, several studies have used the gravity model to examine the effects of different factors on exports in general, but also in the wine sector in particular (e.g., Dascal, Mattas, and Tzouvelekas, Reference Dascal, Mattas and Tzouvelekas2002; Castillo, Villanueva, and García-Cortijo, Reference Castillo, Villanueva and García-Cortijo2016; Dal Bianco et al., Reference Dal Bianco, Boatto, Caracciolo and Santeramo2016, Reference Dal Bianco, Estrella-Orrego, Boatto and Gennari2017; Gouveia, Rebelo, and Lourenço-Gomes, Reference Rebelo, Gouveia, Lourenço-Gomes, Marta-Costa, Jordão and Cosme2018). The variables commonly used include economic factors affecting trade flows in the origin countries, economic factors affecting trade flows in the destination countries, and natural or artificial factors enhancing or restricting trade flows. Natural or artificial factors could include, among other things, trade policies, exchange rate movements, and cultural barriers. Besides not being very extensive, the literature on the determinants of wine trade is, generally, focused on aggregated wine trade between countries, neglecting the potential effect of wine horizontal differentiation, a gap this article seeks to fill.
The wine market is increasingly global and has expanded rapidly, most dramatically during the last three decades of the 20th century (Castillo, Villanueva, and García-Cortijo, Reference Castillo, Villanueva and García-Cortijo2016), and Portugal has actively participated in this market. In terms of total wine exports by volume and value, Portugal held, respectively, the ninth and tenth positions in the world in 2016. From 2006 to 2016, the average annual growth rate of Portuguese wine exports was 3%. France was the main importer of Portuguese wine in both 2006 and 2016, with imports valued at 105 and 112 million euros, respectively. Following France are the United Kingdom and the United States, but here the evolution since 2006 has been very different, as exports to the United Kingdom increased by 5% and to the United States by 61%. This has made the United States the highest absolute growth (nearly €30 million). Other relevant increases (more than €10 million) in imports can be observed in Poland, Switzerland, Germany, Canada, Brazil, and China. On the other hand, two export destinations that were relevant in 2006, Angola and Spain, observed important decreases of 19% and 10%, respectively.
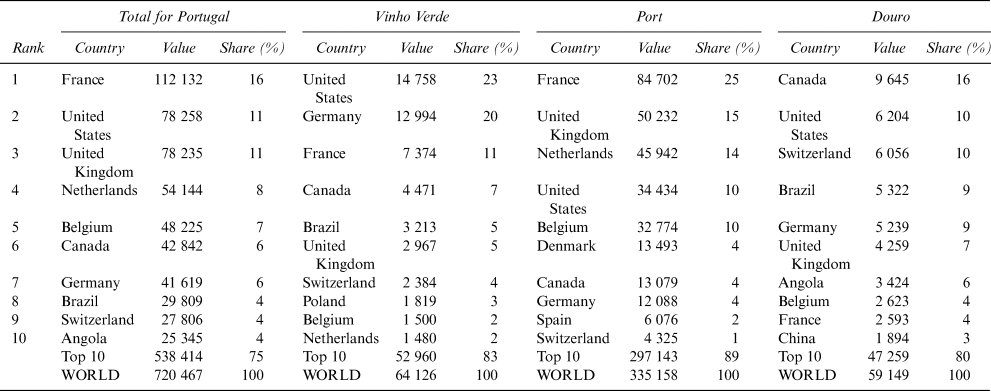
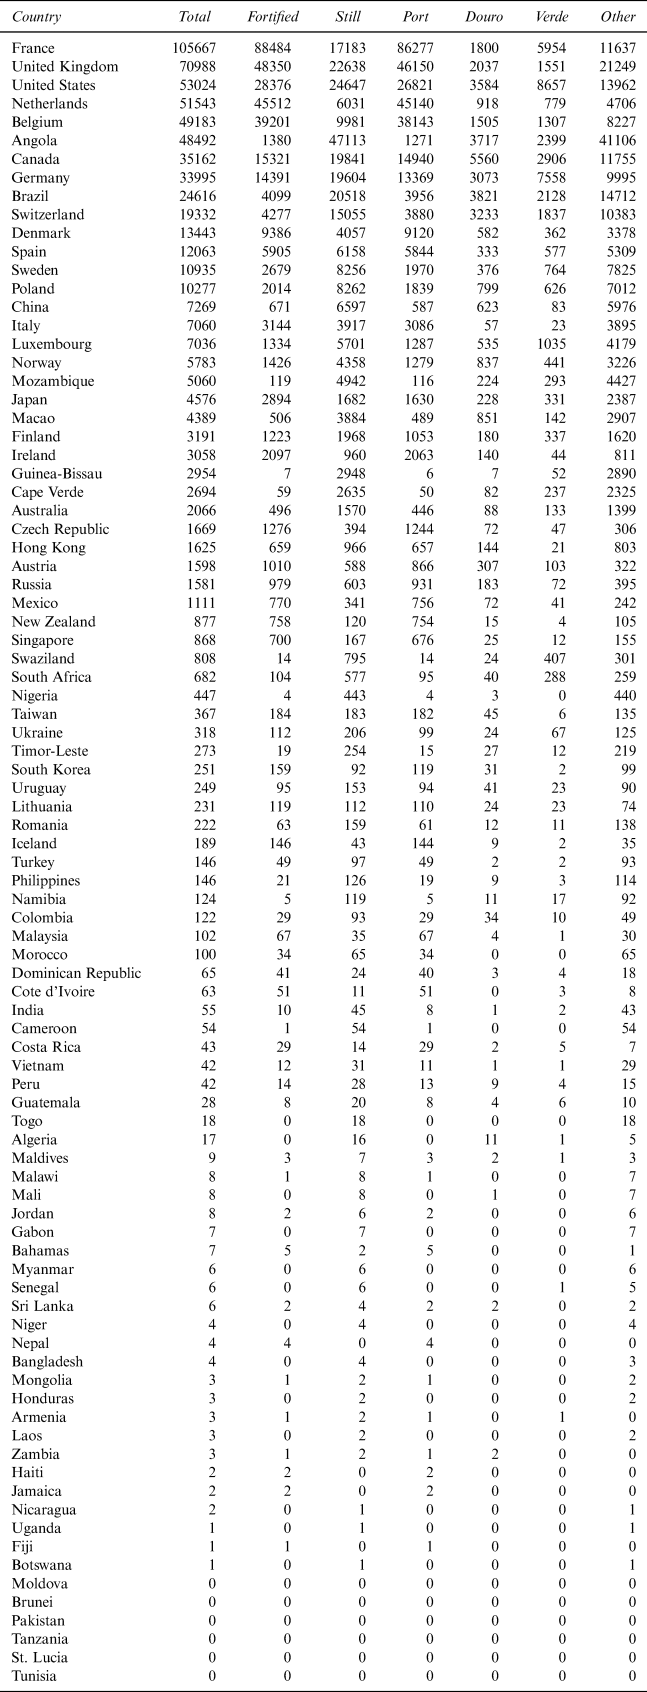
As in other countries, wine production in Portugal is organized through demarcated wine regions, of which there are 14 under the umbrella branding of Protected Designation of Origin (PDO). This work considers three PDOs from two northern Portugal wine regions: PDO Port fortified wine and PDO Douro still wine, which are both produced in the Douro region (one of the oldest demarcated wine regions of the world), and PDO Vinho Verde, which is produced in the wine region with the same name. Together, these represented around 64% of total Portuguese bottled wine exports (by value) in 2016. Focusing on the evolution of the exports of these wines between 2006 and 2016, it is possible to observe two different trends. On the one hand, there is the trend for Port wine, an ancestral commodity in the world market for which exports represent more than 80% of total sales; on the other hand, there are the trends for Vinho Verde and Douro wines, which are new entrants that are making an important mark on a global scale. Port wine has an established position in the world wine trade, and this is reflected by the small variation in its exports. For Douro and Vinho Verde the situation is different: the expansions in their markets resulted in increases from €20 to €64 million and from €27 to €59 million, respectively. Port wine remains the most important wine exported by Portugal, but its share decreased from 59% in 2006 to 47% in 2016 as a consequence of the increasing shares of other wines such as Vinho Verde (which increased from 5% to 8%) and Douro (which increased from 4% to 9%). The main destination countries, despite mostly being common to the three PDOs, have different weights in total exports for each PDO (Table 1).
Main Importing Countries of Total Portuguese, Vinho Verde, Port and Douro Wine in Real Value (1000€), 2016

Sources: Authors’ computation from Comext (http://epp.eurostat.ec.europa.eu/newxtweb/) and IVDP (www.ivdp.pt).
This picture demonstrates the relevance of studying the determinants for exports in the Portuguese wine industry, as a representative case where there is horizontal differentiation, suggesting different determinants for distinct wines. This assessment is performed through the re-specification of a gravity model for aggregate goods (Anderson and van Wincoop, Reference Anderson2003), using three levels of analysis: (i) total Portuguese wine exports; (ii) fortified and still wine exports; and (iii) Vinho Verde, Douro, and Port wine exports. The sample includes 89 importing countries for the period between 2006 and 2016.
The article is structured as follows. Section II provides a review of the literature on determinants of wine exports. Section III describes the materials and methods. Section IV presents and discusses the results. Finally, Section V concludes and explores some policy implications.
II. Literature Review
Theoretical and empirical studies have shown that there are many different factors that influence exports in general and wine exports in particular. Besides the gravity model, the literature indicates that there are other approaches to study the performance of wine exports, such as the export competitiveness of respective countries through indices of comparative advantage (Anderson, Reference Anderson2013), international diversification of firms through foreign direct investment (Outreville, Reference Outreville2016), and a historical perspective on the wine trade (Ayuda, Ferrer-Perez, and Pinilla, Reference Ayuda, Ferrer-Perez and Pinilla2019).
Regarding the gravity model approach, some authors analyze the wine exports of the main players worldwide, for example, Dal Bianco et al. (Reference Dal Bianco, Boatto, Caracciolo and Santeramo2016) investigated the impact of tariffs and non-tariff frictions on wine and they estimated a negative influence on world wine trade of wine-specific tariff protection and restrictive technical barriers. Additionally, their results point to a negative effect on trade of a home bias variable (measured by the production of wine in the importing country), and positive effects of both importers’ gross domestic product (GDP) and sharing a common language. The latter is taken into consideration to represent cultural proximity and because it may facilitate negotiation. Dal Bianco et al. (Reference Dal Bianco, Boatto, Caracciolo and Santeramo2016) found a much lower impact owing to the effect of distance (proxy for transport costs) than the general literature using gravity equations, pointing out that wine is a highly-priced product with long storage capacity, for which differentiation plays an important role. Moreover, Castillo, Villanueva, and García-Cortijo (Reference Castillo, Villanueva and García-Cortijo2016) also estimated a negative effect of distance on wine exports. Their results also showed evidence that price negatively affects exports and that common language and higher GDP in the importing and exporting countries were favorable for exports of bottled wine.
A second group of studies considers exports from European Union (EU) members only, where the traditional wine producers are located. Dascal, Mattas, and Tzouvelekas (Reference Dascal, Mattas and Tzouvelekas2002) examined the determinants of wine exports in the first 12 EU countries. The authors highlighted the positive effect on wine trade of GDP per capita, both from the exporting and importing countries. Exchange rate was suggested to be a facilitator to EU exports in a situation of depreciation of EU country currencies, as it leads to an improving competitive position. The scale of wine production and EU membership were both positive influences on wine exports, while the price of exported wine had a negative effect. Moreover, Olper et al. (Reference Olper, Curzi, Frisio and Raimondi2012) estimated the determinants of home bias in wine and beer consumption in the EU-15, concluding that the home bias effect exists for both products but it is higher in the wine sector. From the importers point of view, the authors also estimated that contiguity between trade partners and a higher diaspora from the exporting country in the importing country had positive effects on wine trading, while distance had a negative effect.
A third group focuses on a single specific exporter. For example, Dal Bianco et al. (Reference Dal Bianco, Estrella-Orrego, Boatto and Gennari2017) concluded that for the Argentinean bottled wine's industry it would be worth making commercial and political efforts towards countries having strong economic growth. They stated that Argentinean exports were negatively affected by wine production in importing countries. However, this effect was low and a more serious deterrent was the imposition of tariffs, for which they advocated a pro-trade Mercosur and Argentinean foreign policy. In another study, Gouveia, Rebelo, and Lourenço-Gomes (Reference Gouveia, Rebelo and Lourenço-Gomes2018) estimated the impact of several macroeconomic factors on Port wine exports. The findings show that total Port wine exports are positively determined by GDP per capita and the presence of a Portuguese emigrant community, while exports are negatively influenced by landlockedness. In addition, the results revealed specific determinants for specific product categories—such as GDP for aged Port, and wine consumption per capita for high standard, vintage, and aged Port.
Summing up, the literature on the determinants of international wine trade is mainly focused on aggregated wine trade. Therefore, it seems that an analysis using different types of wine (horizontal differentiation) is a topic deserving additional research.
III. Materials and Methods
At the country level, one of the main formulations for international trade flows is the gravity equation, inspired by Newton's physical law of gravity, which mainly suggests that economic flows between two countries, an origin and a destination, would increase with higher economical masses (commonly represented by the GDP) in both countries and decrease with greater distance between these two. Initially developed by Tinbergen (Reference Tinbergen1962) and Pöyhönen (Reference Pöyhönen1963), the gravity model was later enriched by several authors (e.g., Anderson, Reference Anderson1979; Helpman and Krugman, Reference Helpman and Krugman1985; Helpman, Reference Helpman1987; Bergstrand, Reference Bergstrand1989; Eaton and Kortum, Reference Eaton and Kortum2002).Footnote 1
Over the time, researchers included more variables in the model, but generally the dependent variable is exports, as it is the case in this work for Portuguese wine. Regarding the explanatory variables, the GDP per capita of the importing country is considered to represent purchasing power (Román, Bengoa, and Sánchez-Robles, Reference Román, Bengoa and Sánchez-Robles2016) or the demand of a good in the international market (Nazlioğlu, Reference Nazlioğlu2013) and an increase is expected to have a positive impact on exports. One of the most included variables to represent price indicators in international trade models is the real exchange rate, which, considering basic demand laws, should have an inverse relationship with external demand. In other words, the appreciation of an exporter's currency will increase the price for importing countries, which naturally will decrease demand through income and substitution effects. In sector-level analysis, it is also crucial to include sectoral characteristics such as the specific tariffs applied (Pokharel, Reference Pokharel2018). Higher tariffs increase trade costs and, consequently, should reduce exports. In the context of wine trade, if the importing country is also a traditional producer, the home bias effect should also be considered, as it is conceivable a disproportionate market share of domestic wines over wines coming from the international market (Olper et al., Reference Olper, Curzi, Frisio and Raimondi2012).
This study follows the gravity model of the prominent work of Anderson and van Wincoop (Reference Anderson and van Wincoop2003), with some adaptations proposed by Gouveia, Rebelo, and Lourenço-Gomes (Reference Gouveia, Rebelo and Lourenço-Gomes2018). For the specific analysis of trade between a single exporter and many importers, as is the case in this article, the economic activity of the exporter and the index of the inward trade frictions are not relevant. Additionally, the index of the outward trade frictions facing the exporter, and the economic activity mass of the world, will be accounted for by the fixed effects at country and time level. Considering these aspects, the gravity function for Portuguese wine exports is the following:

where X w,kt is the dependent variable of the equation and represents the wine exports by type of wine w to the importing country k in year t.Footnote 2 Wine exports are a function of the per capita GDP of country k in year t (gdppc kt), the real exchange rate of k’s currency vis-à-vis the euro in year t (rer kt), the ad valorem equivalent tariff implemented by country k in year t for wine w (tariff w,kt), and a dummy variable equal to 1 when k is a top 10 producer of wine in year t and 0 otherwise (prod10kt).
For gravity equations, a common issue with the dependent variable is the “zero problem,” because the variable is estimated with a logarithm in order to make the equation linear, which raises the problem of the undefined logarithm of zero when there is no trade between some countries. Some direct solutions could be adopted, such as eliminating these observations or adding a small constant, although they do not consider the main problem, which is that zeros are usually not randomly distributed (Heckman, Reference Heckman1979). A trade flow of zero between two countries can happen for several reasons, but, in general, it is due to the high-fixed cost necessary for trading. In relation to this issue, Helpman, Melitz, and Rubinstein (Reference Helpman, Melitz and Rubinstein2008) show that the international trade of a certain country can be observed in relation to two different aspects, the intensive margin of trade (the amount traded with each country) and the extensive margin of trade (the number of countries with which there is trade). If zero observations are ignored, the extensive margin of trade is missing. One of the most prominent solutions was proposed by Silva and Tenreyro (Reference Silva and Tenreyro2006), which estimates the equation using a multiplicative form and a non-linear estimation method, preferably Poisson pseudo-maximum likelihood (PPML). This approach avoids the use of a logarithmic form for the dependent variable, correcting the bias of OLS estimates of gravity under heteroscedasticity, because, as suggested by Jensen's inequality, E(lny) ≠ lnE(y).
The arguments mentioned earlier in favor of the PPML estimator lead to the following multiplicative form of the gravity equation for Portuguese wine exports:

where, in addition to time varying explanatory variables, country (δ k) and time (γ t) fixed effects are included and an additive statistical error (u kt), identically and independently distributed, is assumed.
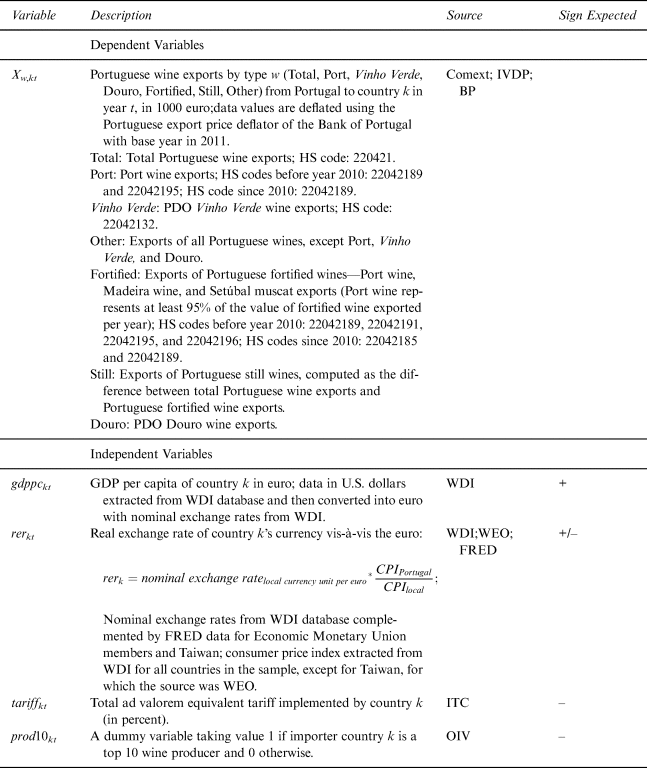
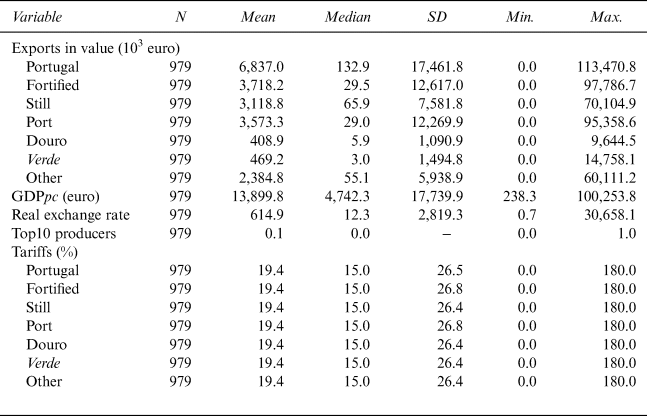
The period of study is 2006–2016.Footnote 3 Over these years, Portuguese wine was exported to more than 170 countries and this work focuses on a sample of 89 importing countries representing around 99%.Footnote 4 Details on data, including definition, sources, and methods of computation, can be observed in Table A.1 of Appendix A. Main descriptive statistics of the variables are presented in Table A.2 of Appendix A.
IV. Results and Discussion
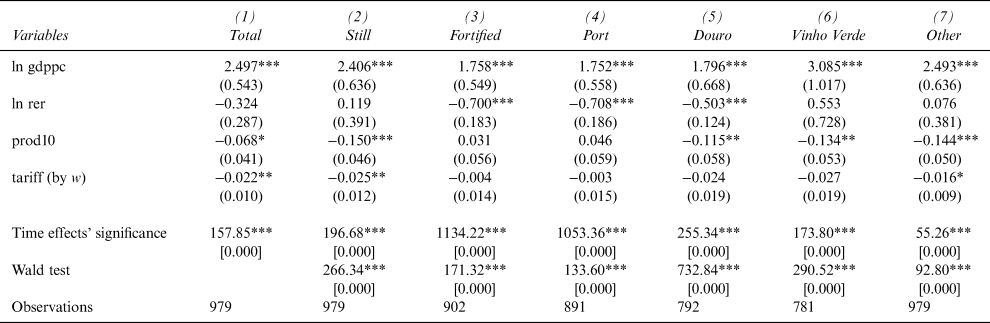
Gravity model estimates for Portuguese wines are presented in Table 2.Footnote 5 Time effects are considered through yearly dummy variables (omitted due to space considerations) and they jointly exhibit statistical significance. The Wald test indicates, with statistical significance, that the coefficients estimated for each kind of wine are different from the coefficients estimated for total Portuguese wine exports, which suggests that separated equations should be estimated.
Estimation of Portuguese Wine Export Determinants through PPML

Notes: Standard errors in parentheses; ***p < 0.01, **p < 0.05, *p < 0.1. Figures in [ ] indicate p-values.
Source: Authors’ computation.
The results reveal, as expected, a positive and statistically significant coefficient associated with per capita GDP. On average, total exports of Portuguese wine (Column 1) vary by 2.5% with a variation of 1% in per capita GDP, ceteris paribus. This finding is in line with previous studies in relation to the positive effect (e.g., Dascal, Mattas, and Tzouvelekas, Reference Dascal, Mattas and Tzouvelekas2002; Castillo, Villanueva, and García-Cortijo, Reference Castillo, Villanueva and García-Cortijo2016; Dal Bianco et al., Reference Dal Bianco, Boatto, Caracciolo and Santeramo2016), but shows a higher value of elasticity, suggesting a higher sensitivity to income for Portuguese wine exports (the main destination countries are mainly countries with high per capita income). The magnitude of the effect of per capita GDP on exports is different for still (Column 2) and fortified (Column 3) wines. The effect of per capita GDP on still wine exports is much greater than the effect on fortified wine exports, with estimated coefficients of 2.4 and 1.8, respectively. Sensitivity to per capita GDP also varies among PDOs. On average, for each 1% growth of per capita GDP in an importer country, the exports of Port (Column 4) and Douro (Column 5) wines will increase less (1.8%) than the exports of Vinho Verde (3.1% in Column 6) and all other Portuguese wines (2.5% in Column 7).
The results suggest a home bias effect because an importing country that is one of the top ten producers of wine is less likey to import Portuguese wine. This trade resilience is also pointed out by Dal Bianco et al. (Reference Dal Bianco, Boatto, Caracciolo and Santeramo2016), but here the results go further, and it is estimated that only exports of Port wine are resistant to the home bias effect. These results suggest that top wine-producing countries find substitutes for Portuguese still wines in their domestic markets, but do not find a valid substitute for Port wine, because the product is very strongly differentiated in the market.
Estimates also suggest that ad valorem equivalent tariffs have a statistically significant inverse relationship with total exports of Portuguese wine, as a 1% increase in tariffs will cause a 2.2% decrease in exports. However, the lack of significance in the estimates for wines with PDO may indicate the positive role of product differentiation in overcoming tariff barriers. This inference would explain why ad valorem equivalent tariffs have a negative effect on aggregates of still wine, but not on Vinho Verde and Douro wines individually. This reasoning is reinforced by the negative effect of tariffs on the exports of all other Portuguese wines (which also include wines without PDO).
A specific determinant of Douro and Port wine exports is the real exchange rate, as the estimated coefficients are negative and statistically significant. It seems that the value of exports of Douro and Port wine increase (decrease) with a depreciation (appreciation) of the euro, because these two goods become, in relative terms, cheaper (more expensive). In the wine trade literature, Dascal, Mattas, and Tzouvelekas (Reference Dascal, Mattas and Tzouvelekas2002) estimate a similar effect for wine exported by EU members, while Cardebat and Figuet (Reference Cardebat and Figuet2019) suggest that exchange rate reduce the volume of French wine exports.
V. Conclusion
In a world of increasingly globalized markets, where a country's openness is related to challenges and opportunities, emerging markets have appeared, leading to increased innovation and product differentiation. Replacing the role of traditional markets in demand for wines, such as France, Germany, Japan, or Switzerland,Footnote 6 emerging markets are relevant to the future of the worldwide wine industry, because they represent new consumers, most of them inspired by a Western lifestyle (Castillo, Villanueva, and García-Cortijo, Reference Castillo, Villanueva and García-Cortijo2016). According to Mariani et al. (Reference Mariani, Napoletano, Vecchio and Pomarici2014), new markets starting from low levels of wine consumption include China, Hong Kong, Singapore, Russia, South Korea, Brazil, Mexico, South Africa, and Angola, and, in a longer-term perspective, Banks and Overton (Reference Banks and Overton2010) expect that India, Malaysia, Nigeria, Taiwan, Thailand, and the United Arab Emirates will offer good business opportunities.
Wine is a typical globalized product, with increasing product differentiation that can turn out to be a threat or an opportunity for traditional producers. This article examines the determinants of wine exports in one of the most traditional producers, Portugal, considering the total exports of wine and the exports of different types of wine, in order to understand the role of horizontal differentiation.
Using balanced panel data for 89 importing countries from 2006 to 2016, a gravity model is estimated using the Poisson pseudo-maximum likelihood method. The main finding of this work is that the wine market is not homogeneous and that exports of different kinds of wines are affected differently by macroeconomic determinants. Wald tests reveal differences in the coefficients estimated for the determinants of Portuguese wine exports, first, between fortified and still wines, then also between wines with different designations—Douro, Vinho Verde, and Port. These differences are reflected in the distinct magnitudes of impact for common determinants and by specific determinants for certain wines.
Comparing the results for still and fortified wines, it is suggested that purchasing power in the importing country, despite being a common determinant of exports, is considerably more important for still wine than for fortified wine. In addition, tariffs and home bias are trade deterrents for still wine, but not for fortified wine. On the other hand, fortified wine exports are constrained by an inverse relationship to the real exchange rate.
Disaggregating PDO wine exports, empirical results show that purchasing power in the importing country is a very important determinant, but it seems that this effect is far more crucial for exports of Vinho Verde than for Douro or Port wines. Tariffs do not seem to be trade deterrent for the three PDOs under consideration, but they have a negative effect on exports of all other Portuguese wines. Home bias is similarly felt in exports of all wines considered except Port wine. Finally, the findings suggest that the real exchange rate is a specific determinant of Port and Douro wines exports.
This study has managerial and political implications for the wine industry and other industries with similar structure. Taking advantage of common determinants of exports for different typologies of the same product, Portuguese wine firms should adopt international marketing strategies based on scope economies and, thereby, cross-selling different categories of wines in foreign markets. Furthermore, the benefits of product differentiation highlighted in this article are clear: it helps to surmount customs costs and, at a certain level, to create market niches in foreign markets (such as for Port wine). In political terms, this implies that Portugal should achieve favorable free trade agreements with third countries in the context of EU trade policy.
For future research, it would be helpful to consider the extensive trade margin, as it may be relevant for stakeholders to be aware of the factors that influence the probability of a particular country importing a specific product produced only by a certain region/country.
Appendix A
Data: Description, Source and Expected Sign of Explanatory Variables

Descriptive Statistics

Sample of the 89 Importing Countries and Average Annual Imports of Portuguese Wine between 2006 and 2016 in 1000€ (Constant Prices)

Appendix B
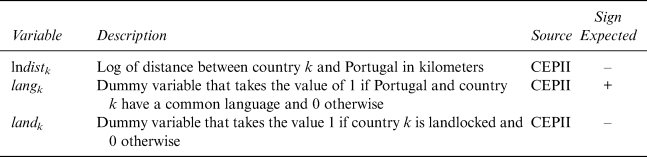
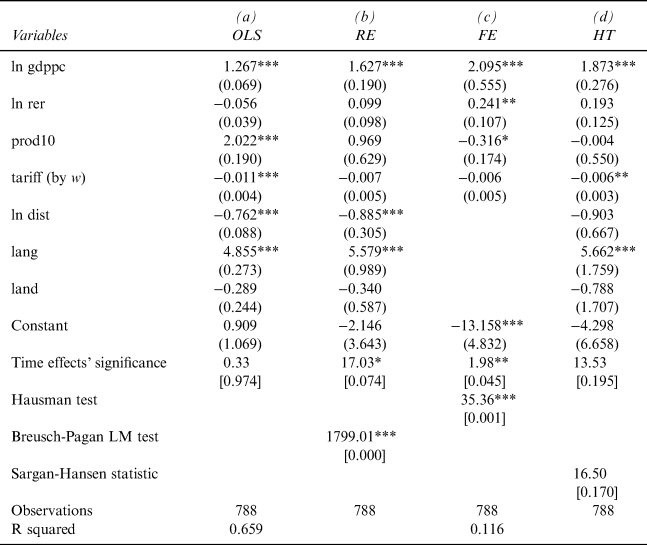
Alternative estimators to PPML were tested and are presented in Table B.2, where the dependent variable is in the logarithmic form and the linear estimations do not solve the “zero problem” (see Section III). Column (a) in Table B.2 reports the results for the pooled ordinary least square (OLS) estimations, Column (b) the random effects (RE) model, Column (c) the fixed effects (FE) model, and Column (d) the Hausman and Taylor (HT) estimator (1981). Time effects are included in all models. Time-invariant variables can be included in OLS, RE, and HT, being variables dist k, lang k, and land k defined in Table B.1. In FE estimations, heteroscedasticity and serial correlation were corrected using a clustered robust estimator.
Time-Invariant Variables Used in Estimations with OLS, RE, and HT Estimators: Descriptions and Sources

Determinants of Total Portuguese Wine Exports in Value Using OLS, RE, FE, and HT Estimators, 2006–2016