


INTRODUCTION
The marine ecosystem fluctuations driven by climate forcing have been observed for the various regions of the world seas (Anderson & Cahalan, Reference Anderson and Cahalan2005; Zhang & Gong, Reference Vilibić and Orlić2005), and for the Mediterranean (Colmenero-Hidalgo et al., Reference Colmenero-Hidalgo, Flores, Sierro, Barcena, Lowemark, Schonfeld and Grimalt2004). The results obtained for various basin-scale case studies (for example Bering Sea, Baltic Sea and North Sea) suggest that substantial modifications in the climate regime can be responsible for shifts in various marine ecosystem components (see http://www.beringclimate.noaa.gov). Following Rodionov & Overland (Reference Rodionov2005), the regime shifts are defined as a ‘rapid reorganization of ecosystem from one relatively stable state to another. In the marine environment, regimes may last for several decades and shifts often appear to be associated with changes in the climate system’. Most of the shifts in the marine ecosystem are attributed to changes in the sea temperature, salinity and circulation controlled by local atmospheric variations which are partly under the influence of large-scale teleconnections. Changes of the surface temperature in the northern hemisphere in the last few decades (IPCC, Reference Solomon, Qin, Manning, Chen, Marquis, Averyt, Tignor and Miller2007), accompanied with changes in precipitation intensity, and the modified atmospheric circulation pattern over the northern hemisphere are crucial factors that control the Adriatic Sea thermohaline circulation and the ecosystem. The Adriatic Sea shows strong interannual variability of temperature and salinity caused by the presence of Levantine Intermediate Water (LIW) in the intermediate layer of the eastern coast (Vilibić & Orlić, Reference Trigo, Xoplaki, Zorita, Luterbacher, Krichak, Alpert, Jacobeit, Saenz, Fernandez, Gonzalez-Rouco, Garcia-Herrera, Rodo, Brunetti, Nanni, Maugeri, Turkes, Gimeno, Ribera, Brunet, Trigo, Crepon, Mariotti, Lionello, Malanotte-Rizzoli and Boscolo2002).
Analyses of the long-term physical, chemical and biological parameters in the Adriatic Sea also show significant interrelated variability (Marasović et al., Reference Kušpilić, Grbec, Beg-Paklar, Morović and Barić1995; Grbec et al., Reference Grbec, Dulčić and Morović2002; Grubelić et al., Reference Grubelić, Antolić, Despalatović, Grbec and Beg Paklar2004; Grbec et al., Reference Grbec, Morović, Kušpilić and Marasović2007). The observed increase of primary production (PP) in the Adriatic Sea by the end of the 1970s, was first attributed to eutrophication (Pucher-Petković et al., Reference Paz, Tourre and Planton1988), however, more recent investigations suggested that climate changes may be also related to the increased PP (Marasović et al., Reference Marasović, Grbec and Morović2005). Both steady and abrupt climate changes and shifts have been recognized as key factors which control variations in the pelagic ecosystem (Grbec et al., Reference Grbec, Morović, Dulčić, Marasović and Ninčević2008) and the occurrence of some marine organisms (Dulčić et al., Reference Dulčić, Beg Paklar, Grbec, Morović, Matić and Lipej2007) on the decadal to long-term scales.
Generally, primary production in the sea depends on the presence of dissolved nutrients and microelements, carbon dioxide and photosynthetic radiation. In the Adriatic Sea enrichment of these critical elements is favoured by the advective inflow of saltier Mediterranean water, river discharges, mixing processes induced by strong Bora and Sirocco winds and upwelling phenomena at the Palagruža Sill topographic barrier (see, for example, Cushman-Roisin et al., Reference Cushman-Roisin, Gačić, Poulain and Artegiani2001). In addition, the atmospheric CO2 concentration is recognized as a factor which controls not only continuous trends in observed climate, but it can be attributed to extreme events (i.e. heat waves and droughts) causing shifts in both temperature and precipitation space and time distributions (Bell & Sloan, Reference Bell and Sloan2006).
Numerous studies provide evidences that changes in primary production, plankton abundance and community structure are related to climate changes (Edwards et al., Reference Edwards, Beaugrand, Reid, Rowden and Jones2002; Yunev et al., Reference Zhang and Gong2007; Katara et al., Reference Katara, Illian, Pierce, Scott and Wang2008; Möllmann et al., Reference Molinero, Ibanez, Souissi, Buecher, Dallot and Nival2008). The best-studied pattern of atmospheric variability is the North Atlantic Oscillation (NAO) (Hurrel, Reference Hurrell1995), which has been related to changes in phytoplankton biomass (Reid et al., Reference Reed1998; Barton et al., Reference Barton, Greene, Monger and Pershing2003), primary production and toxic algal blooms (Belgrano et al., Reference Belgrano, Lindahl and Hernroth1999). Long-term zooplankton variability in the Mediterranean Sea in relation to climate changes was described by Molinero et al. (Reference Molinero, Ibanez, Suissi, Chifflet and Nival2008).
In this study we investigated the potential link between the abrupt increase of primary production in the Adriatic Sea and the abrupt changes in the atmosphere, and to what extent the environmental factors such as sea temperature and carbon dioxide content (represented here by pH-TOT) are important for controlling the primary production rate.
MATERIALS AND METHODS
To examine the role of climate changes on the primary production variability in the area of the eastern Adriatic Sea, long-term series of various atmospheric and oceanographic parameters were analysed. In the middle Adriatic, primary production (PP) has been measured at the two permanent oceanographic stations: Kaštela Bay station (KBS) in the coastal area and Stončica station (STS) in the open sea waters (Figure 1). The studied period extends over 41 years, starting from 1961 for sea temperature and since 1962 for PP time series, whereas the acquisition of chemical parameters started in 1972. Water temperature measurements were performed with classical methods (reversing thermometers) on standard oceanographic depths in the period 1961–1998, whereas in the latter period the CTD probe Sea Bird SBE-25 was used. Homogeneity of temperature time series was maintained throughout the whole period. The oxygen was determined by the classical Winkler titration method, while pH-TOT was determined according to Strickland & Parsons (Reference Stratford and Haines1972), and primary production was measured by the 14C tracer technique of Steemann Nielsen (Reference Schippers, Vermaat, De Klein and Mooij1952).
Map of the Adriatic Sea with location of oceanographic (■) and meteorological stations (★) in the study area.

The regional atmospheric data (air temperature, precipitation and wind speed) used in our analysis were obtained from the meteorological stations along the eastern Adriatic coast denoted in Figure 1 and cover the period from 1961–2002. Air–sea boundary layer parameters (heat and water fluxes) were calculated for the Split–Marjan meteorological station and used in the analysis to describe variations in the surface layer. The net heat flux (QNET) was computed as the sum of solar radiation, longwave back radiation, sensible and latent heat flux. Mean monthly solar radiation was calculated using the Reed (Reference Raven and Falkowski1977) formula, the sensible and latent heat fluxes using classical bulk formulae (Gill, Reference Gill1982), while long wave back radiation was calculated according to May (Reference Marasović, Ninčević, Kušpilić, Marinović and Marinov1986). The principal component analysis was used to determine the interannual variability of the Adriatic climate. The matrix was composed of mean annual values of air temperature, precipitation, and wind speed from the 9 meteorological stations along the eastern Adriatic coast. The data were structured as a (42*27) matrix in which each of 42 rows describe one year from 1961–2002 for 27 variables consisting of 3 meteorological parameters for 9 stations along the eastern Adriatic coast. Only those principal components showing eigenvalues greater than 1 (Kaiser–Guttman criterion) were used in the further analysis. The extracted principal components were used as a proxy of the Adriatic climate.
The relation of the regional conditions, described by Adriatic climate proxy, and PP at annual scale with the large scale circulation patterns was examined through their correlations with the North Atlantic Oscillation Index (NAOI). The NAOI is defined as a winter (DJFM) difference of normalized sea level pressure between Lisbon (Portugal) and Reykjavik (Iceland) and it is obtained at www.cgd.ucar.edu/cas/jhurrell/.
The sequential t-test analysis of regime shift (STARS) method proposed by Rodionov (Reference Richardson and Schoeman2004) was applied to the mean annual, winter (JFM) and spring–summer (AMJJA) primary production values and to time-series of explanatory variables in the atmosphere and sea, to detect their abrupt changes. The method is based on sequential t-test analysis in which the STARS method determines whether the next value in the investigated time series is significantly different from the previous regime. If so, this year in time series can be possibly marked as a year where the new regime started. The subsequent observations are used to confirm or reject the regime shift. The hypothesis of existence of a new regime is tested using regime shift index defined as:

where m is number of years since the new regime start, l is cut-off length of the regime, and σl is averaged standard deviation in the l-year regime. The cut-off length determines the minimum duration of a regime. The RSI represents cumulative sum of normalized deviation from the empirical mean for the new regime. The differences between the mean values of a new regime and the current one are used to test the significance according to the Student's t-test. The determination of the regime is strongly dependent on the cut-off length l and probability level P of the t-test. For our time series the cut-off length is set to l = 5 and the P level is 0.05. For our time series the cut-off length is set to l = 5 (in order to eliminate quasi-biennial oscillations) and P level is 0.05. The sequential regime shift detection method is available at www.beringclimate.noaa.gov/regime.
The locally-weighted scatter plot smoothing (LOWESS) method (Cleveland, Reference Cleveland1979) was used to illustrate trends in the time series of meteorological and oceanographic parameters. Pearson correlation analysis was used to find significant correlations between the series of primary production and various environmental variables. Statistical analysis was performed using the Statistica 7 software (StatSoft Inc, 2006).
RESULTS AND DISCUSSION
Long-term production changes
For the purpose of this paper, long-term changes of primary production in the middle Adriatic were studied primarily at the open sea station (STS), since it can be assumed that the open sea area is more sensitive to climate influences than to the anthropogenic impact. The rate of primary production in the coastal area (station KBS) is approximately double than at the open sea. In spite of the strong anthropogenic influences in the coastal area, the fluctuations at both stations show significant degree of correspondence with the correlation coefficient between monthly PP values of 0.37 (P < 0.001). Since anthropogenic influence can also be at the origin of regime changes, to exclude this impact, we analysed only the open sea station STS.
The PP changes at the station STS show periods with opposite anomalies through the 1962–2002 time-series. The winter (JFM) and spring–summer (AMJJA) anomalies are generally negative until the 1980s, and then are shifted to the positive values until 1996, after which negative anomalies are established again (Figure 2). In the first period, until 1979, there is no significant trend of PP at the open sea (STS), and values oscillate below the mean value within one standard deviation relative to the whole period. An abrupt increase of PP in 1965, with values exceeding for more than three standard deviations the overall winter mean, can be related to extreme atmospheric conditions prevailing during February 1965. The high pressure system occurred over the Adriatic with prolonged Bora wind episodes, which brought dry and cold air over the area (NCAR archive). These conditions probably contributed to the high production rate via high solar radiation input and mixing, which induced enhanced nutrients concentration in the upper layers. The STARS and LOWESS methods were applied on primary production mean annual and spring–summer values. The spring–summer season was defined as a period from April–August since it is a biologically active period in the Adriatic. Using the regime shift detection method the highest regime shift indices (RSI) for the PP were obtained for the years 1980 and 1997 (Figure 3). The abrupt shift that occurred in 1980 initiated a new increased PP regime, which lasted until the end of 1996, when the production rate returned to the state before 1980. During the period spring–summer, the mean productivity during the years 1980–1996 was 387.85 (mg Cm−2 day−1) which is according to the test of differences between sample means (significant at P = 0.001 level), higher than 181.29 (mg Cm−2 day−1) for the rest of the series. In this new productivity regime the periods with increasing (1980–1986) and decreasing (1987–1996) trends of PP were illustrated by the LOWESS method.
Anomaly time series of winter (JFM) and spring–summer (AMJJA) primary production at the STS station in the middle Adriatic Sea.

Results of the regime shift method applied to (A) mean annual (JD) and (B) mean spring–summer (AMJJA) primary production. Bold solid lines indicate regimes. Thin solid lines display LOWESS analysis.

In addition to the measurements of PP in the water column, the pH-TOT was determined as a measure of seawater alkalinity (sum of the free weak acid anions, primarily HCO3−, and CO32− ions). As carbon dioxide exists at several different chemical forms in the seawater and the proportions of these forms are governed by the ability to balance the alkalinity. Anomaly time-series of pH-TOT values at STS showed a change of regime in the period from 1989–1998 (Figure 4), which is in accordance with shifts of PP and atmospheric conditions (see Figures 3 & 5). Unfortunately, the limited number of pH-TOT data did not allow statistical confirmation of the linkage between atmospheric CO2 and PP. Even for the areas with adequate datasets, the answer to this question is still controversial and requires future investigations (Raven, Reference Pucher-Petković, Marasović, Vukadin, Stojanoski, Caddy and Savini1997; Raven & Falkowski, Reference Raven1999; Tortell et al., Reference Strickland and Parsons2000; Ibelings & Marbely, Reference Ibelings and Maberly1998; Schippers et al., Reference Samuel, Haines, Josey and Myers2004).
Anomaly time series of annual pH-TOT values in comparison with annual primary production anomaly.

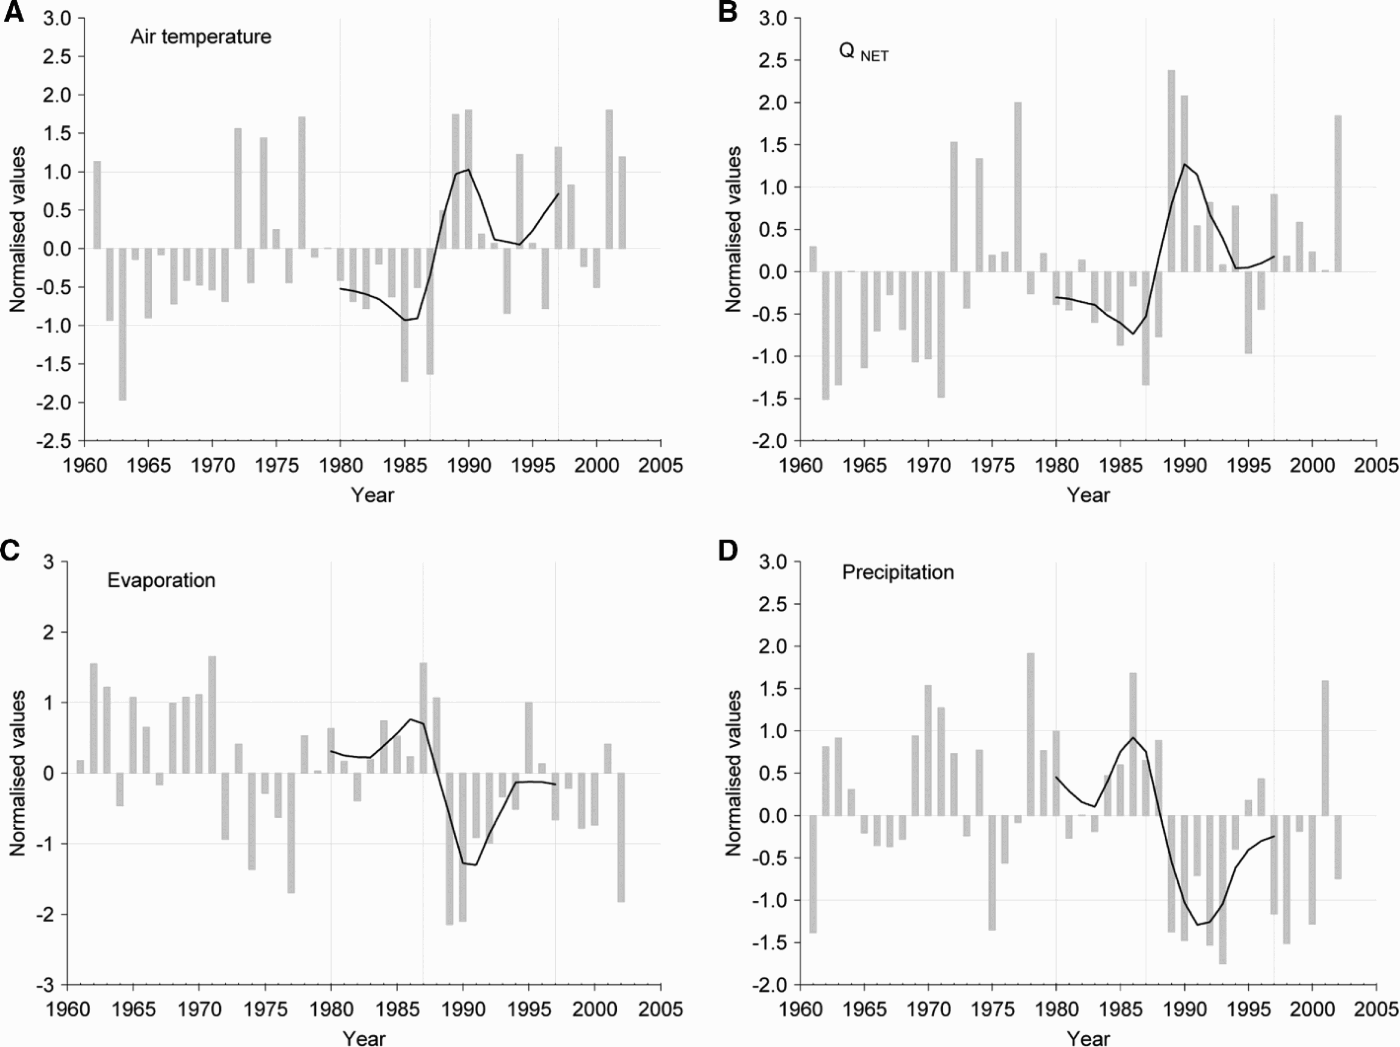
Anomaly time series of winter (A) air temperature; (B) net heat flux (QNET); (C) evaporation; and (D) precipitation rate for the Split–Marjan meteorological station.
Climate variations
The climate-induced changes and shifts in the atmosphere can be one of the forcing factors that control ecosystem dynamics in the area and will be documented in this subsection. In order to explain the observed PP changes in the period from 1962 –2002, we have analysed Adriatic climate year-to-year fluctuations. Instead of comparing primary production with regional meteorological variables, the Adriatic climate proxy is defined as the first three principal components extracted from the meteorological matrix. The PC1 accounts for 40.6% of the total variance in the initial matrix, PC2 accounts for 15.1% and PC3 for 9.4% which together explained more than 65% of variability of the interannual Adriatic climate variation. The three first principal components were compared to the annual primary production and winter NAO index using Pearson correlation. The results suggested that there are significant relationships between Adriatic climate proxy, NAO winter index and primary production (Table 1). The first principal component, which describes temperature conditions over the Adriatic Sea, is not significantly correlated to primary production changes. The second PC, which describes precipitation conditions and the third PC which describes wind conditions over the middle Adriatic are both significantly correlated with primary production interannual variations. This analysis confirms the existence of similar interannual variability of primary production, the regional atmospheric conditions and the large-scale teleconnection index.
Contribution of first three principal components (PCs) to the total variance of meteorological matrix (eigenvalues/percentage) and Pearson correlation coefficients (r) between PCs and primary production annual values (PP) and NAO winter index.

Significance levels: *P < 0.05, **P < 0.001.
Since the cold season is crucial for the Adriatic dynamics (Orlić et al., Reference Möllmann, Muller-Karulis, Kornilovs and St John2007) local conditions of the middle Adriatic are described by the winter air temperature, evaporation, precipitation, and air–sea heat flux exchange from the meteorological station Split–Marjan. The LOWESS method was applied to the winter (JFM) atmospheric variables (Figure 5) and also to PP variability in the biologically active spring–summer period (see Figure 3). Similar trends are observed in the variability of the time series during the new PP regime.
Downscaling from annual to seasonal scale, the explainable and meaningful significant correlation coefficients for the winter season were obtained between local precipitation and primary production rate (r = –0.37; P < 0.05) and between PP and wind speed from open sea station Lastovo (r = 0.39; P < 0.05). The negative correlation between PP and precipitation during the cold period of year (JFM) is a result of PP dependency on solar radiation (light limitation). Increased wind speed is beneficial for production due to the increased mixing and advection. In the warm period of the year (AMJJA) significant correlations are obtained between primary production and evaporation (r = 0.40; P < 0.05) and with wind speed (r = 0.46; P < 0.05). Correlation with evaporation is probably an indirect measure of the wind influence over the area. Significant correlation with wind is again due to beneficial influence of mixing for primary production.
Furthermore, the shifts in the Adriatic PP are related to the changeable basin-scale circulation. Namely, during the colder Adriatic winters, with prolonged Bora wind episodes the formation of the deep Adriatic water masses is occurring. These water masses spread toward the south-east and exiting from the Adriatic enhance more intensive intrusions of the Mediterranean warmer and nutrient richer water through the Otranto Strait with few months delay (Orlić et al., Reference Möllmann, Muller-Karulis, Kornilovs and St John2007). Warmer winter conditions are not favourable for deep water generation and therefore intrusion of intermediate Mediterranean water into the Adriatic in spring–summer period (AMJJA) is weaker if compared to the usual conditions. Weaker intrusions cause colder and less salty middle Adriatic waters below 50 m, since the water is not replenished by warmer and saltier Mediterranean water. To quantify this process we introduced two indices. The first is a measure of ‘intensity’ of deep water masses formation in winter and the second is a measure of ‘intensity’ of Mediterranean intrusion in summer. The first index (ATNA)n is simply defined as a normalized mean winter (JFM) northern Adriatic air temperatures averaged from stations Mali Lošinj, Senj and Rijeka. The positive index indicates relatively warmer winters over the Adriatic, while negative anomalies imply relatively colder winters. The second index (STS50-100)n is defined as anomaly of the mean spring–summer (AMJJA) seawater temperature in the layer 50–100 m at STS. This is indicative for intrusions of warmer Mediterranean intermediate waters into the Adriatic, being positive for years of stronger intrusions and negative in years of weaker intrusions.
During the first period of the new PP regime in 1980s, the (ATNA)n winter (JFM) index was negative, and the sea temperature spring–summer (AMJJA) anomaly (STS50–100)n index was positive, indicating stronger intrusion (Figure 6). For the second part of the new regime (after 1987) the situation was opposite. The index obtained from normalized mean winter (JFM) northern Adriatic air temperatures was positive implying weaker LIW intrusion into the Adriatic. The consequences of this process were negative sea temperature anomalies in the 50–100 m layers during spring–summer. This period coincides with the Eastern Mediterranean Transient (EMT) (Klein et al., Reference Klein, Roether, Manca, Bregant, Beitzel, Kovačević and Luchetta1999) influencing the thermohaline and bio-chemical properties of the Mediterranean waters (Stratford & Haines, Reference Steemann Nielsen2002). The EMT caused a barrier for normal circulation between the Eastern Mediterranean and Adriatic (Samuel et al., Reference Rodionov and Overland1999). These conditions were reflected also in the salinity and oxygen content in the middle Adriatic. Less intense water exchange resulted with low oxygen content in the second period with the higher productivity (Figure 6). During this period there was no additional nutrient input (Kušpilić et al., Reference Klein, Roether, Manca, Bregant, Beitzel, Kovačević and Luchetta2004), which resulted in the lower primary production. It seems that (STS50–100)n index is a suitable descriptor of thermohaline circulation in the area of the middle Adriatic, and due to its significantly negative correlation with NAO winter index (r = −0.39; P < 0.05) and spring–summer primary production (r = −0.55; P < 0.05) could be also a good indicator of primary production changes in the Adriatic (Table 2). The regime shift index obtained for (STS50-100)n and PP appears almost the same years in the two time series (Figure 7).
Anomaly time series of winter air temperature for the northern Adriatic (A); spring–summer sea temperature (B); spring–summer oxygen concentration (C); and spring–summer salinity (D); in the layer (50–100 m) at STS.

Regime shift index values for the spring–summer primary production (PP) and spring–summer sea temperature index (STS50–100)n and corresponding normalized time series.

Correlation coefficients (r) between spring–summer primary production PP (AMJJA) and NAO winter index and explanatory variables: index (ATNA)n and (STS50–100)n.

Significance levels: *P < 0.05.
The hemispheric-scale NAO index is not directly connected to Adriatic climate variability. Since NAO influence on regional climate decreases with the distance from the North Atlantic pressure centres, correlation coefficients between the winter NAO index (DJFM) and air temperature and precipitation vary asymmetrically along the eastern Adriatic coast (Table 3). From the north to the south the correlation coefficients between temperature and NAO decrease, while the correlations with precipitations become significant. The Eastern Mediterranean is located in the transition area under the influence of both mid-latitude and tropical variability, and a large part of its atmospheric variability is linked to NAO and other mid-latitude teleconnection patterns (Trigo et al., Reference Tourre and Paz2006). It will be useful to investigate also the linkage of the Adriatic climate to the regional NAWA (North Africa–West Asia) index shown to be suitable for the south-eastern Mediterranean region (Paz et al., Reference Ottersen, Planque, Belgrano, Post, Reid and Stenseth2003; Tourre & Paz, Reference Tortell, Rau and Morel2004).
Correlations coefficients (r) between winter NAO index and winter air temperature (AT) and precipitation (P) along the eastern Adriatic coast.

Significance levels: *P < 0.05.
CONCLUSION
The influence of climate changes on different species in the food chain of a marine ecosystem has been demonstrated in numerous studies. In the Adriatic Sea changes in atmospheric and oceanographic conditions have been related to the increase of the fish species Mola mola, which has been associated to steady temperature increase in the warm season, while Ranzania Laevis responded with increase to abrupt decrease of winter temperature (Dulčić et al., Reference Dulčić, Beg Paklar, Grbec, Morović, Matić and Lipej2007).
In the Mediterranean the response of copepods shows changed seasonal distribution, so that climate variability regulated timing of the seasonal peak (Molinero et al., Reference May2005a). Hemery et al. (Reference Hemery, D'Amico, Castege, Dupont, D'Elbes, Lalanne and Mouches2008) have shown that in the Biscay Bay the fish species reflect biogeographical limits between communities and temperature regimes. These and other examples show that in spite of many evidences of influences of climate variability and shifts, a simple connection cannot be drawn between the atmosphere and biota.
Complex effect of climate forcing on the plankton community structure has been manifested as changed timing of the seasonal peaks in the north-western Mediterranean (Molinero et al., Reference Molinero, Ibanez, Nival, Buecher and Souissi2005b). Climate impact on plankton ecosystems in the north-eastern Atlantic was observed in phytoplankton biomass increase in cooler regions and decrease in warmer regions (Richardson & Schoeman, Reference Reid, Planque and Edwards2004). Cloern et al. (Reference Cloern, Jassby, Thompson and Hieb2007) explained abrupt phytoplankton biomass and PP increase through trophic cascade and top-down control of phytoplankton biomass by bivalve suspension feeders. All these influences describe impact of hemispheric–regional climate–weather variability to a marine ecosystem. Response of the various local marine ecosystem components to NAO influences is different as a result of diversity in biological groups. Due to various mechanisms, which may produce variations in individual population and community level, or timing of reproduction and spatial distribution, the NAO impact to a local ecosystem can be classified as direct, indirect or integrated (Ottersen et al., Reference Orlić, Dadić, Grbec, Leder, Marki, Matić, Mihanović, Beg Paklar, Pasarić, Pasarić and Vilibić2001). Such mechanism-based classification can help in design/interpretation of related ecological changes to the NAO and other large-scale teleconnection patterns. The effect of NAO on Adriatic PP has a non-trivial mechanism which involved lagged meteorological–ocean interactions, due to which its influence is classified as indirect.
Sequential t-test analysis of the regime shift (STARS) method applied to the open sea primary production indicated the existence of a new regime in the period 1980–1996 characterized by significantly different mean primary production rate. Additionally, the LOWESS method revealed the periods of increasing (1980–1986) and decreasing (1987–1996) primary production.
Middle Adriatic Sea primary production can be partly explained by thermohaline circulation, induced by winter northern Adriatic climate, responsible for spring–summer ocean conditions. The increased PP in the 1980s was induced by the increased LIW intrusion. The decreasing PP trend, but still within the period of high values, started in 1987 and coincided with EMT, which caused greatly reduced water mass exchange in the Otranto Strait. Primary production variability is also significantly correlated with precipitation and wind variability over the Adriatic.
Since the obtained shift in the ecosystem corresponds to the shift in the climate induced thermohaline circulation, primary production changes can be explained by coupling between ecosystem and climate forcing. Statistically significant correlations between winter NAO index and Adriatic atmospheric and ocean conditions crucial for the PP variability, point to their dependence on the processes occurring over an area much wider than the Adriatic.
ACKNOWLEDGEMENTS
The work on this paper is supported from the Ministry of Science of the Republic of Croatia through the project No. 001-0013077-1118, and also through the SESAME project No. 036949. NCEP Reanalysis data were provided by the NOAA–CIRES ESRL/PSD Climate Diagnostics branch, Boulder, Colorado, USA, from their website at http://www.cdc.noaa.gov/, and the NAO index was taken from the website www.cgd.ucar.edu/cas/jhurrell/. We are grateful to the referees, whose valuable comments helped us to improve our manuscript.



