1. Introduction
For a number of developing countries, including India, issues relating to energy choice and household energy transitions are important from a policy standpoint. Efforts at encouraging and facilitating households to make substitutions that will result in more efficient energy use and less adverse environmental, social, and health impacts are advocated in many of these countries. But the effective design of public policy in this area requires, as a first step, research and analysis of the factors that affect energy choices and consumption patterns in rural and urban areas of such countries. In rural areas, choices are constrained not only by low incomes, but also by the lack of access to more commercial fuels and markets for energy using equipment and appliances. Often, the choice of fuel is determined more by local availability and transaction and opportunity costs involved in gathering the fuel (mostly wood, dung, and other biomass) rather than by household budget constraints, prices, and costs. Modeling choices in such circumstances is complicated and often there is little data available on proximity to supply of biomass, opportunity costs, or time needed for collection.
In contrast to rural households, urban ones often have a wider choice and greater availability and accessibility to modern commercial fuels, electricity, and energy using end-use equipment and appliances, and, therefore, greater potential for fuel switching. The rapid growth of urban areas in developing countries has been accompanied by a huge surge in the demand for household fuels and electricity. In India, the share of urban population increased from 17.3 per cent in 1951 to about 28 per cent in 2001 and is projected to rise to about 41 per cent by 2030 (UN, 2003). Changing urban lifestyles have important implications for the quantum and pattern of energy use in households residing in these areas and suggest various avenues for policy relevant research. In addition, an understanding of factors affecting fuel choices in urban households might also provide insights into how rural households might behave if supply of commercial fuels and access to markets were not constrained in these areas.
In India, household energy is required to meet the needs for cooking and water heating and for lighting and powering electrical equipment and appliances.Footnote 1 However, the bulk of energy used in Indian households even today is for cooking.Footnote 2 Therefore, an understanding of cooking energy consumption patterns is particularly important.
Despite a major shift away from the use of biomass fuels towards commercial fossil fuels and electricity over the last two decades in urban areas, there are still many poor Indian households that rely on firewood as their primary source of cooking energy. As income increases, households tend to switch from firewood to kerosene and then LPG (liquid petroleum gas). However, all households do not necessarily switch completely or, in other words, terminate the use of one fuel when taking up the use of another.
LPG, when compared to kerosene or firewood, has clear health, environmental, and efficiency benefits. Of course, choice is constrained by cost as well and it is not fuel costs alone that matter, but also the start-up costs of connections, equipment and stoves. Some recent studies that have compared total costs of different cooking fuels in India (World Bank, 2003; Reddy, Reference Reddy2003; Gupta and Ravindranath, Reference Gupta and Ravindranath1997) find that in some cases the option of purchased firewood can be even more expensive than LPG, particularly when the efficiency of use of the different fuels is taken into account. However, for most poor households, the capital costs associated with the use of LPG are still a large hindrance to wider adoption of this fuel for cooking. In addition, a number of factors other than the cost affect the choice of fuels used by the household. The energy ladder hypothesis, which has traditionally been used to describe household fuel switching strategies, prescribes income to be the sole factor. However, as will be shown later in the paper, there are, in fact, several other household characteristics that affect choice.Footnote 3
In this paper, we analyze cooking fuel choices in urban households of India. For this purpose we use a microeconomic data set, which is derived from the Indian Household Consumer Expenditure Survey conducted by the National Sample Survey Organisation (NSSO, 2002). Fuel choice is modeled empirically using a discrete choice framework and the substitution relationships between fuels examined. The impact of income and prices on fuel choice are examined. The analysis also aims to identify whether and to what extent other socio-demographic variables determine fuel choice.
The rest of the paper is structured as follows. Section 2 includes a brief review of the literature. Section 3 describes the data and presents some descriptive statistics. Section 4 presents the model, and section 5 discusses the results. Finally section 6 concludes with a brief discussion of some of the main policy implications of the results.
2. Literature review
Several studies that try to understand household energy use patterns in developing countries can be found in the literature. However, those that try to quantify patterns in household energy transitions and the underlying causal factors, or factors affecting fuel choice decisions using disaggregate household data, are more limited. Recently, renewed focus on such studies has been stimulated by growing concerns about the health impacts of indoor air pollution associated with the burning of unprocessed biofuels such as wood and dung in inefficient cooking stoves. Amongst studies on household fuel choices for developing countries, we can distinguish broadly between two types, those that use simple descriptive statistics and others that have employed econometric methods to analyze fuel choice.
The traditional view on fuel switching in the household sector of developing countries has been that households gradually ascend an ‘energy ladder’ and that there is a simple linear progression from relatively inefficient fuels and energy end-use equipment to more efficient fuels, electricity and equipment, with increasing income levels and urbanization (Leach, Reference Leach1992; Sathaye and Tyler, Reference Sathaye and Tyler1991; Smith et al., Reference Smith, Apte, Yuqing, Wongsekiarttirat and Kulkarni1994; Reddy and Reddy, Reference Reddy and Reddy1994). In general, much of the literature points to income being an important factor influencing energy choice. However, while income is important, in as far as it increases the options available to a household, what in fact actually motivates households to switch between different fuels and triggers energy transitions is a much more complex interplay of factors. Recent literature on household energy use in developing countries also supports the view that in fact the picture drawn by the energy ladder theory is too simplistic and that there are many factors that determine fuel choice (Davis, Reference Davis1998; Masera et al., Reference Masera, Saatkamp and Kammen2000; Barnett, Reference Barnett2000). An early study by Hosier and Dowd (Reference Hosier and Dowd1987) for household fuel choice in Zimbabwe using a multinomial logit model shows that although economic factors do affect fuel choice, a large number of other factors are also important. In addition, much of the recent literature bears out that fuel switching is often not complete and is, in fact, a gradual process with many households often using multiple fuels. The reasons for multiple fuel use are varied and not dependent on economic factors alone, although the affordability or cost of the energy service also has an important bearing on the household's choice. In some cases, households choose to use more than one fuel because they want to increase the security of supply. In other cases, the choice might be dependent on cultural, social or taste preferences.
Other recent work in this field include a study for Bolivia (Israel, Reference Israel2002) that examines whether fixed costs associated with switching to LPG act as a barrier, how income growth effects fuelwood use and whether female earned income influences fuel choice. The study concludes that reducing the fixed costs associated with a switch to cleaner fuels like LPG and increasing income earning opportunities for women can go a long way in encouraging households to shift away from the use of fuelwood. A multicountry study by the World Bank (Heltberg, Reference Heltberg2003, Reference Heltberg2004) has also examined the factors affecting a switch from solid (traditional) fuels to non-solid (modern) fuels and the role of electrification in facilitating such a switch. In another study, Heltberg (Reference Heltberg2005) analyzes the factors determining fuel choice in Guatemalan households. Another recent study by Chaudhuri and Pfaff (Reference Chaudhuri and Pfaff2003) estimates Engel curves for traditional (dirty) and modern (cleaner) fuels using household survey data from Pakistan and concludes that there is evidence of a U-shaped relationship between indoor air quality and income akin to the EKC as households switch from traditional fuels to modern fuels with increases in household income. Evidence on the nature of household energy transitions in Africa includes studies by Campbell et al. (Reference Campbell, Vermuelen, Mangono and Mabugu2003); Davis (Reference Davis1998); Ezzati and Kammen (Reference Ezzati and Kammen2002); Hosier and Kipondya (Reference Hosier and Kipondya1993).
Evidence from empirical studies on the patterns of household energy use in India includes World Bank (1999, 2002) and Alam et al. (Reference Alam, Sathaye and Barnes1998). Viswanathan and Kavi Kumar (Reference Viswanathan and Kavi Kumar2005) analyze fuel consumption patterns across rural and urban households in India by examining data on the share of expenditures for different fuels. However, prior empirical research using a discrete choice framework for households in India is limited to only two studies. The first of these studies is Reddy (Reference Reddy1995) that looks at energy carrier choices for a sample of households residing in the city of Bangalore. He employs a series of binomial logit models to determine the choice between each pair of energy carriers, to explain the shifts in and the pattern of consumption of different fuels used for cooking and water heating. Results of the study confirm the hypothesis that households ascend an energy ladder and the choice is largely determined by income. However, factors such as family size and occupation of the head of the household are also seen to play a role in fuel selection.
More recently, Gangopadhyay et al. (Reference Gangopadhyay, Ramaswami and Wadhwa2003) employ a multinomial logit framework to represent household fuel choice separately for rural and urban Indian households. They also employ data from the NSSO household expenditure survey, which we use in this paper. However, they model household decisions concerning the choice of both cooking and lighting fuels together and therefore consider a choice set that consists of all the key alternatives of different energy carrier combinations used by households. The objective of that study was to evaluate the effectiveness of the existing price subsidies in facilitating a shift to the cleaner and more efficient fuels – kerosene and LPG. Their results indicate that the existing subsidies are fiscally unsustainable and also of little help in meeting social policy objectives as they are seriously misdirected and favor the rich disproportionately.
Given the limited area and country-specific empirical evidence that is available on this topic, this research aims to augment the knowledge in this field. The present paper differs from the previous studies described above in three important regards. First, we analyze choices only in urban households, as we believe an analysis of choice of household fuels within rural areas would require additional information on nearness of source of biomass or time required for collection. Second, the analysis focuses on cooking fuels, which still comprise the largest part of household energy needs in India, and are quite separate and disparate from the energy needs for either lighting or powering appliances. Finally, we assume that there is a natural order of progression in terms of the choice of fuels based on their efficiency, ease of use, and cleanliness, and therefore employ an ordered discrete choice framework to model fuel choice.
3. Data source and descriptive statistics
The household micro budget data used in this study are from the household expenditure survey Round 55 covering the period July 1999 to June 2000 conducted by the National Sample Survey Organization, a part of the department of statistics of the Indian government (NSSO, 2002). We selected the 1999–2000 cross-section data to analyze fuel choices because they are the most recent quinquennial round of the survey available. The survey collects information on quantity consumed and value of household consumption for a wide variety of consumer goods and services. In addition, data on a host of other socio-economic and infrastructural variables are collected via the survey. The data are collected from a large nation-wide sampleFootnote 4 of households living in both rural and urban areas using the interview method. For the analysis presented in this paper, we make use of data only from the urban sampleFootnote 5 and the quantity and expenditure data for fuels/energy on a 30-day recall basis.
For the urban sector, the complete sample from Round 55 consists of 48,924 households representing 51.4 million households and a total urban population of approximately 314 million people. The information on cooking energy consumption is available for 46,918 households. Data pertaining to a few observations where there were missing or extreme values were excluded. We also excluded all observations where the household had no cooking arrangement or ‘other fuels’, that is fuels other than LPG, kerosene, or firewood were used as a cooking fuel. This comprised about 11 per cent of the total urban sample.Footnote 6 The final analysis was conducted using a sample of 41,593 household level observations.
Amongst urban households in India, the main cooking fuels in use are firewood (often commercially bought), kerosene, and LPG. The data indicate that in 1999–2000, 30 per cent of urban households still used firewood as a cooking fuel, while the percentage using kerosene was about 70 per cent and about 50 per cent used LPG. As different fuels vary in their efficiency, the main cooking fuel is defined as the fuel that provides the highest share of total useful cooking energyFootnote 7 used by the household. This does not necessarily correspond with the reported primary cooking fuel in the questionnaire. The rates for converting to useful energy for LPG, kerosene, and wood are calculated by assuming specific average levels of efficiency in the use of these fuels for cooking.Footnote 8 The reason for using useful energy as the basis for the analysis is that households in fact do not demand energy in itself, but in fact demand services such as a hot cooked meal that energy helps provide. While ideally we would like to capture demand at the level of energy services, this is not possible and thus useful energy proves to be the best approximation to the level of energy services.
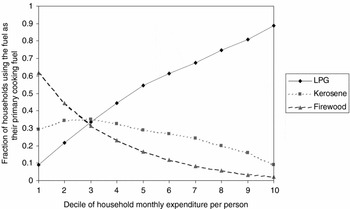
Both the choice of household cooking fuel and the amount consumed are related to the income (proxied by the per capita expenditure level) and the size of the household. The relationship between the primary fuel choice and income level is illustrated in figure 1. This figure shows that as income increases the likelihood of choosing wood drops, while that of LPG rises. As for kerosene, the likelihood first rises at low incomes, peaks at the third decile, and then declines. This suggests that while a higher income is likely to be associated with a switch from wood to kerosene/LPG among moderate-income groups, in high-income groups the likely effect is a switch from wood/kerosene to LPG.
Main cooking fuel by income.

The data also show that about 54 per cent of households use two or more fuels. The incidence of single-fuel use is about 50 per cent among LPG users and as high as 74 per cent among households using kerosene. However, this is not the case for firewood users, most of whom use kerosene as well. Finally, there are few households that use a combination of LPG and firewood or who use all three fuels. Thus, we see that multiple fuel use is more frequent in poorer households that are more dependent on less efficient biomass fuels (see Pachauri et al., Reference Pachauri, Mueller, Kemmler and Spreng2004, for more on energy poverty in India).
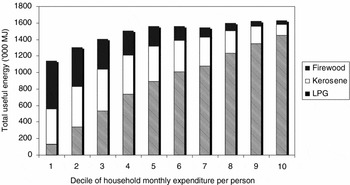
Figure 2 plots total useful energy use for cooking across income decile groups. We observe an increase in the amount of energy use with income, but this levels off among the highest income deciles. The share of different fuels used varies significantly across deciles, with a larger share of firewood and kerosene among lower deciles and a predominate share of LPG among higher-income groups. The observed pattern seems to suggest that among households in the lower-income groups, fuels are used more as complements and there is a greater degree of fuel stacking in evidence. It is only among those in the higher-decile groups that some cases of complete fuel switching occur, with one fuel dominating total energy needs for cooking, and additional fuels possibly only used occasionally as back-up.
Total cooking energy by income (41,593 households).

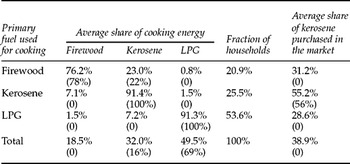
The distribution of households by their main fuel choice is given in table 1. This table shows that for the majority of the urban LPG using households, more than two thirds (69 per cent) of cooking energy needs is met from LPG. Kerosene and firewood are used as the main energy source in a considerable number of urban households (26 and 21 per cent of the sample respectively). Even in households that mainly use LPG, the share of kerosene is, on average, about 7 per cent of total cooking energy. In the case of LPG and kerosene users, the median share of secondary fuels drops to zero, suggesting that the supplemental fuel might be used only as a back up. Table 1 also shows the average share of kerosene purchased from the private market as opposed to the subsidized public distribution system. These numbers show that households that use kerosene as their primary fuel purchase more than half of their fuel from the market, whereas the majority of those who use kerosene as a secondary fuel tend to purchase the subsidized kerosene. This suggests that both market and subsidized prices may affect the choice probabilities.
Average and median share of household's useful cooking energy by primary cooking fuel

Note: Median shares are given in parentheses.
The above descriptive analysis suggests that the observed patterns in the data are consistent in part with the ‘energy ladder’ theory. In other words, there is a clear order in the distribution of energy shares by the primary fuel (see table 1). Firewood and LPG at the two extremes are more likely to be used with kerosene in the middle, than with each other. Moreover, at the bottom of the ladder, households are more likely to use two fuels. In contrast, at the top of the ladder (LPG), single fuel choices are more likely. The econometric model used in this paper is in line with the ordered preferences observed in the data.
Table 2 presents the descriptive statistics of the household characteristic variables included in the model specification. As seen in the previous discussion, household income (proxied by the household's per capita monthly expenditure) has a considerable effect on the fuel choice. Dummy variables for the level of education of the head of the household, occupation, female headed households, season, and geographic location (state dummies and a dummy for households residing in metropolitan areas) are included in the model, in addition to variables relating to household size, fuel prices, and age of the head of the household.Footnote 9 While the dataset includes a wide variety of information on household-level characteristics, expenditure and consumption information, one area where the data are lacking is regarding independent and reliable information on fuel prices. For this reason, fuel prices are calculated as the median value of individual prices for each one of the 78 regions (sub-states) in the sample. Unit or average values calculated by dividing expenditures on each fuel type by the corresponding quantities for each household are used as a proxy for individual prices. By including dummies relating to state regions and seasons,Footnote 10 we hope to capture some of the unexplained variation on account of the lack of direct price data in addition to any spatial and geo-climatic differences that might exist. Finally, the table also includes descriptive statistics relating to the number of LPG dealers per 100,000 households. This variable is included in the model so as to capture differences on account of LPG availability and accessibility at the state level.
Descriptive statistics (41,593 urban households)

Notes: *Median prices at the district level (78 districts).
**Calculated at the state level (32 states).
***Cities with more than a million habitants.
4. Model and estimation methods
As discussed in the previous sections, the observed patterns in the data suggest that the fuel choice in urban households is consistent with an ordered discrete choice framework. These models such as ordered logit and probit are often used for ordered categorical response variables that represent groups of continuous variables, such as income groups. However, the application of these models can be extended to categorical variables that have an ‘assessed’ order, such as ‘the extent of pain relief after treatment’ (Anderson, Reference Anderson1984). These variables are referred to as assessed, ordered variables. In many of these response variables, the ordering is not obvious at first sight. We contend that the cooking fuel type in an Indian household can be considered as an ordered variable, in that the three fuel types can be clearly ordered in terms of efficiency, comfort and ease of use.
In this paper we report results of the estimation of an ordered probit model (see Greene, Reference Greene2003) and Wooldridge (Reference Wooldridge2002) for more details). In this model it is assumed that the individual's choices are based on a latent variable, which can be considered as a measure of random utility. This latent variable is defined as a linear function of explanatory variables

where Xi is the vector of alternative fuel prices faced by household i; Zi is the vector of household characteristics; β and γ are the parameter vectors to be estimated; and ɛi is an iid stochastic error term that represents the unobserved heterogeneity. The probability of choosing alternative j is defined as

where kjs are the threshold parameters.
The error term ɛi is assumed to follow a normal distribution with mean zero and variance σ2. In this model, the probability of choice j can be written as

where Φ is the CDF of a standard normal variable.Footnote 11 The model in equation (3) can be estimated using the maximum likelihood estimation method. As seen in equation (2), the choice probabilities are assumed to be a function of a continuous latent variable (y*) that can be considered as the household's ‘energy status’ or the position of the household on the energy ladder.
The model described above requires that the alternatives be ordered, namely j = 1, 2, 3 correspond to firewood, kerosene, and LPG respectively. This assumption implies that households are more likely to substitute two fuels that are adjacent on the specified ordering. For instance, if a wood user is to choose another alternative, kerosene is more likely to be chosen as opposed to LPG. In order to explore if such an assumption is realistic, we also considered two non-ordered discrete choice models, namely a multinomial probit model in line with Geweke et al. (Reference Geweke, Keane and Runkle1994) and a multinomial logit specification.Footnote 12 Comparing the prediction results between ordered and non-ordered models indicates a slightly better prediction rate for primary fuel choice in non-ordered models. However, when we consider the secondary fuel choices, the situation gets reversed with the ordered probit model making correct predictions in about 63 per cent of the cases, compared to 51 per cent for the non-ordered models.Footnote 13 The results also suggest that all models, especially the ordered ones, are weak in predicting the primary fuel for kerosene users. However, when we consider both primary and secondary choices among multiple fuel users, the ordered models have a clear advantage. Given that fuel switching is a transitional and gradual behavior, correct prediction of the preferences of multiple fuel users is necessary for understanding the substitution possibilities of single fuel users as well.
As for the estimated marginal effects, the results for ordered and non-ordered models are comparable for almost all the socio-economic factors and the LPG prices.Footnote 14 Overall, these comparisons show that the ordered models have a better performance especially considering that these models include only half as many parameters as the non-ordered models. Therefore, we retain the ordering assumption and focus on the ordered probit model in the rest of the paper.
5. Results
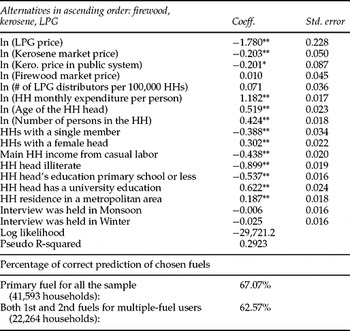
The maximum likelihood results from the estimations of the ordered probit model described in section 4 are presented in table 3. These results indicate that most of the explanatory variables included in the model have significant effects and show the expected signs. The results clearly show that there are a number of factors, other than income, influencing the choice of household cooking fuels in urban India. The coefficients listed in table 3 can be interpreted as the effects on the households’ energy status, that is the position of the household on the energy transition line (ladder). As expected, income and education have a positive and significant effect.
Regression results

Notes: *significant at .05; **significant at .01.
State dummies (18 groups) are included in the model (see table A1).
Table 3 also indicates that LPG and kerosene prices have negative effects, suggesting that higher prices can result in a lower energy status, with LPG price having the greatest and kerosene price having the least effect. This can be explained by the combination of an effect on purchasing power (income effect) and a substitution effect. While the income effect for a price increase is always downward (away from LPG), the substitution effect is upward for wood prices, downward for LPG, and ambiguous for kerosene prices. Therefore, the resulting effect is relatively high for LPG prices, whereas for wood prices the two effects cancel out, hence resulting in an insignificant overall effect. The negative effect for kerosene prices suggests that the resulting effect of a price increase is toward inferior fuels and away from LPG. Similarly, we can conclude that a decrease in kerosene prices might be effective in raising the energy status and encouraging adoption of cleaner fuels. The price of wood is statistically insignificant for fuel switching. This might be explained by the fact that wood-users are mainly the low-income people who cannot afford other alternative fuels that are considerably more expensive especially in terms of fixed costs of appliances.
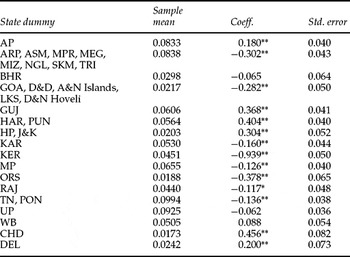
The size of the household and the age of the head of the household have a positive effect on the probability of choosing cleaner fuels, as does the household being headed by a female. Living in larger cities or metros also increases the probability of choosing cleaner fuels, as does having more LPG distributors and hence easier accessibility. The seasonal dummies have no significant effects, suggesting that urban households do not significantly change their cooking energy choices across different seasons. A number of state dummies are also included in the model and the coefficients on these are mostly significant, suggesting that there are differences in the choice behavior of households living in different regions of the country (see table A1 in the appendix for the estimated effects of the state dummy variables). The rates of correct prediction of the household's main fuel are given at the bottom of table 3.
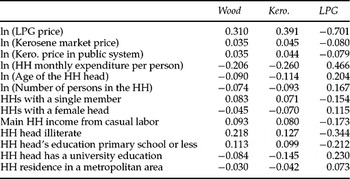
In order to better understand the nature of the substitution patterns between the three main cooking fuels amongst different households, the marginal effects of the significant variables at sample means are also calculated and presented in table 4. The numbers in this table show the effect of a one-unit change in a given explanatory variable (or a switch in the case of dummy variables) on the probability of choosing each one of the three fuels. As all the continuous variables are in logarithms, the corresponding marginal effects can be interpreted as the effect of a relative change, and thus can be used for a direct comparison of the magnitude of different effects. The first observation from these results is that, among the continuous explanatory variables, LPG price and household income have the most important effects and, among the dummy variables, those associated with the household head's education have the greatest effects.
Marginal effects at the sample mean

Notes: Only the statistically significant effects are listed.
For dummy variables the effects are obtained from probability differences.
The household head being illiterate or only having primary education increases the probability of choosing firewood or kerosene as a cooking fuel, whereas those households where the head has a higher level of education are more likely to use LPG. For instance, households with illiterate heads are on average about 22 per cent more likely than those with a secondary school education (base category) to use wood and about 34 per cent less likely to use LPG. These results also indicate that a 10 per cent increase in income will raise the share of LPG users by 4.7 per cent, while decreasing the share of wood and kerosene users by 2.6 and 2.1 per cent respectively.
The results in table 4 also suggest that higher LPG prices are associated with a significant negative shift away from LPG, as we might expect. According to the model results, a 10 per cent decrease in LPG price, for instance, will increase the average share of LPG users by about 7 per cent, while decreasing the share of wood and kerosene users by 3.1 and 3.9 per cent respectively. The effect of kerosene price is much smaller and more ambiguous. For instance, a 10 per cent increase in the kerosene market price will decrease the share of LPG users by about 0.8 per cent, while increasing the users of kerosene and wood by about 0.4 per cent. Such a positive effect on wood demand can be explained by the behavior of moderate- and low-income households in substituting kerosene with wood, whereas the positive effect on kerosene demand and the negative effect on LPG demand can be explained by the ambiguous effect of kerosene prices on households that use LPG and kerosene together. These households, accounting for about 24 per cent of the sample, when faced with high kerosene prices, in some cases might tend to substitute kerosene with LPG, but in other cases are subject to an income effect resulting from higher kerosene prices, which might push them towards inferior fuels and consuming less energy. The results suggest that the latter effect dominates the former. Hence, an increase in kerosene prices could cause a higher share of kerosene consumption for these households.
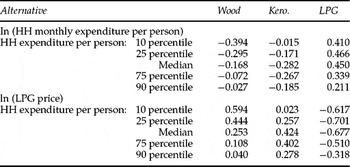
In addition, the marginal effects for the variables household income and price of LPG calculated for different income tiles of the population are listed in table 5. Differences in the marginal effects of the price and expenditure variables are evident for households belonging to different income tile groups. As expected, the marginal effect of income on the probability of using wood is much greater for low-income households. For instance a 10 per cent increase in household income decreases the probability of using wood by 0.03 to 0.04 in low-income households, while the decrease is only about 0.003 to 0.007 for high-income households (see upper panel of table 5). A contrasting pattern can be observed for the use of LPG that is subject to a relatively low marginal effect for income among high-income households.
Marginal price and income effects at the sample median by income category

Similar patterns can be seen regarding the effects of LPG prices among different income groups. As the lower panel of table 5 indicates, higher LPG prices push households away from LPG use, but this effect is greater for moderate and median-income groups and relatively low for high-income households. For instance a 10 per cent increase in LPG prices can decrease the LPG share by 7 per cent among the first quartile income group, but by only 5 per cent among the third quartile income group. Another interesting pattern observed in table 5 is that being in a lower income group increases the probability of choosing wood over kerosene when LPG price increases. Conversely, when facing higher LPG prices, the moderate- and high-income households are more likely to substitute LPG with kerosene than with wood.
6. Conclusions
The paper provides results of the estimation of an ordered discrete choice model on fuel choices and patterns of cooking fuels in urban Indian households using a large database consisting of 46,918 observations. The analysis is used to determine the responsiveness of fuel choices to own price, income, price of alternate fuels and variables relating to socio-demographic and geographic characteristics of households.
From a methodological point of view, this paper differs from previous literature in that we assume that there is a natural order of progression in terms of the choice of fuels based on their efficiency, ease of use, and cleanliness and, therefore, we employ an ordered discrete choice framework to model fuel choice. Our analysis shows that, in the Indian context, such ordered models can be as useful and instructive as non-ordered multinomial models. Our work suggests that ordered models that have fewer parameters and are easier to interpret provide a better performance in predicting the choice of multiple fuel users.
The descriptive analysis and the econometric results reported in the paper suggest that the observed patterns in the data are consistent with the stylized ‘energy ladder’ theory. In other words, there is an order in the distribution of energy shares by the primary fuel that depends to a large extent on the level of income of the household. Firewood and LPG at the two extremes are more likely to be used with kerosene in the middle, than with each other. However, the results also show that, in addition to income, there are several socio-demographic factors such as education and sex of the head of the household, which are important in determining the choice of fuels in urban Indian households. Our results thus corroborate those of other recent studies (Heltberg, Reference Heltberg2005; Masera et al., Reference Masera, Saatkamp and Kammen2000) that suggest that fuel choice is not determined purely by economic factors and that a more general interpretation of the energy ladder theory is needed.
Overall, fuel choice decisions in urban Indian households appear to be flexible and dynamic with many households maintaining the ability to use two or more different fuels for cooking at any given point in time. Our results seem to suggest several reasons why households shift to the use of modern fuels. In urban areas, where firewood is often bought and opportunity costs for collecting wood are high, economic considerations and availability are crucially important in determining fuel choices. Higher incomes increase the ability of households to afford both the equipment and fuel costs of modern fuels like LPG, which are also more widely available in urban areas. Better education increases the awareness of households of the negative health impacts associated with the use of firewood and also the advantages of modern fuel use, in terms of efficiency and convenience. In larger cities and areas where modern fuel supplies are more regularly and reliably distributed, households are more likely to choose modern fuels and less likely to require back-up or supplemental use of other fuels. In addition, households where women are more empowered are less likely to use less efficient wood. Other reasons, such as tastes, customs, and status, may also influence fuel choice and require further investigation.
From a policy point of view, our results suggest that in order to encourage households to make fuel substitutions that will result in more efficient energy use and less adverse environmental, social, and health impacts, subsidization of LPG gas provision, promotion of higher levels of education, greater empowerment of women, and promotion of general economic development could be effective instruments. Given the high fiscal costs associated with LPG fuel price subsidies, however, it may be more sustainable to promote policies that promote rebates on the purchase of LPG stoves and easier access to credit or purchase on installment plans for the equipment needed to use cleaner fuels such as LPG in a more targeted fashion. In addition, since multiple fuels are more likely to be used by the poor and the share of secondary fuels in total cooking fuel consumption is higher for households in lower-income decile groups, a LPG fuel subsidy policy is likely to benefit richer rather than poorer households and may not result in a complete transition away from the use of inferior fuels like wood and kerosene. As the results of the analysis presented in this paper highlight, several other variables in addition to fuel price affect fuel choice. This points to the importance of exploring policy options other than pricing alone.
Appendix
Regression coefficients and sample means for state dummies

Note: The omitted state: MHR; *significant at .05; **significant at .01.