INTRODUCTION
As a primary component of microperiphyton fauna, periphytic ciliates play an important role in the structuring and functioning of microbial food webs, especially by importing bacteria, microalgae and other organic particles into benthos in many aquatic ecosystems (Eisenmann et al., Reference Eisenmann, Letsiou, Feuchtinger, Bersker, Mannweiler, Hutzler and Arnz2001; Fischer et al., Reference Fischer, Sachse, Steinberg and Pusch2002; Weitere et al., Reference Weitere, Schmidt-Denter and Arndt2003; Kathol et al., Reference Kathol, Norf, Arndt and Weitere2009; Norf et al., Reference Norf, Arndt and Weitere2009a, Reference Norf, Arndt and Weitereb; Xu et al., Reference Xu, Zhang, Jiang, Zhu, Al-Rasheid, Warren and Song2011a, Reference Xu, Zhang, Jiang, Min and Choib; Zhang et al., Reference Zhang, Xu, Jiang, Zhu and Al-Resheid2012). They generally colonize the submerged natural and artificial substrata with high abundance and richness (Railkin, Reference Railkin1995; Strüder-Kypke, Reference Strüder-Kypke1999; Coppelotti & Matarazzo, Reference Coppellotti and Matarazzo2000; Xu et al., Reference Xu, Min, Choi, Jung and Park2009a, Reference Xu, Min, Choi, Kim, Jung and Limb). With their rapid responses to environmental changes, easy sampling, relative immobility, increasing availability of easily used taxonomic references and allowing standardization for temporal and spatial comparisons, periphytic ciliates have widely been accepted as a useful indicator to assess water quality in aquatic ecosystems (Norf et al., Reference Norf, Arndt and Weitere2007; Mieczan, Reference Mieczan2010; Tan et al., Reference Tan, Shi, Liu, Xu and Nie2010; Xu et al., Reference Xu, Zhang, Jiang, Zhu and Al-Resheid2012a, Reference Xu, Zhang, Jiang, Zhu and Al-Rasheidb; Zhang et al., Reference Zhang, Xu, Jiang, Zhu and Al-Resheid2012).
Protozoan community-based structural (e.g. richness, diversity and evenness of species) and functional parameters (e.g. colonization rate constant) have commonly been used to discriminate water quality status in aquatic environments (Tan et al., Reference Tan, Shi, Liu, Xu and Nie2010; Jiang et al., Reference Jiang, Xu, Hu, Zhu, Al-Rasheid and Warren2011; Shi et al., Reference Shi, Liu, Liu, Sun and Xu2012; Xu et al., Reference Xu, Zhang, Jiang, Zhu and Al-Resheid2012a, Reference Xu, Zhang, Jiang, Zhu and Al-Rasheidb; Zhang et al., Reference Zhang, Xu, Jiang, Zhu and Al-Resheid2012). In order to use these biotic measures as bioindicators and to track the effects of pollution and recovery of the biotic components, it is necessary to know the specific community structures and colonization features. Such studies, however, have yet to be carried out in marine environments, although they have been well-reported in freshwater ecosystems (Xu et al., Reference Xu, Choi, Yang, Lee and Lei2002, Reference Xu, Cao, Xie, Deng, Feng and Xu2005, Reference Xu, Zhang, Jiang, Zhu and Al-Resheid2012a, b; Norf et al., Reference Norf, Arndt and Weitere2007; Mieczan, Reference Mieczan2010; Zhang et al., Reference Zhang, Xu, Jiang, Zhu and Al-Resheid2012). Additionally, the vertical variations of ciliate colonization are especially poorly investigated, although it is important to confirm the optimal colonizing position in a ciliate community study (Coppelotti & Matarazzo, Reference Coppellotti and Matarazzo2000; Gong et al., Reference Gong, Song and Warren2005; Xu et al., Reference Xu, Min, Choi, Jung and Park2009a, Reference Xu, Min, Choi, Kim, Jung and Limb).
A one-month baseline survey of ciliate colonization dynamics was conducted using an artificial substratum (glass slides) in coastal waters of the Yellow Sea, near Qingdao, northern China from May to June 2010. Our aims were: (1) to analyse the colonization features of the periphytic ciliate communities in coastal waters; (2) to compare the temporal dynamics of the ciliate colonizations between different water depths; and (3) to determine an optimal sampling strategy to collect the ciliate communities within shorter exposure time for monitoring water quality in marine ecosystems.
MATERIALS AND METHODS
Study site and period
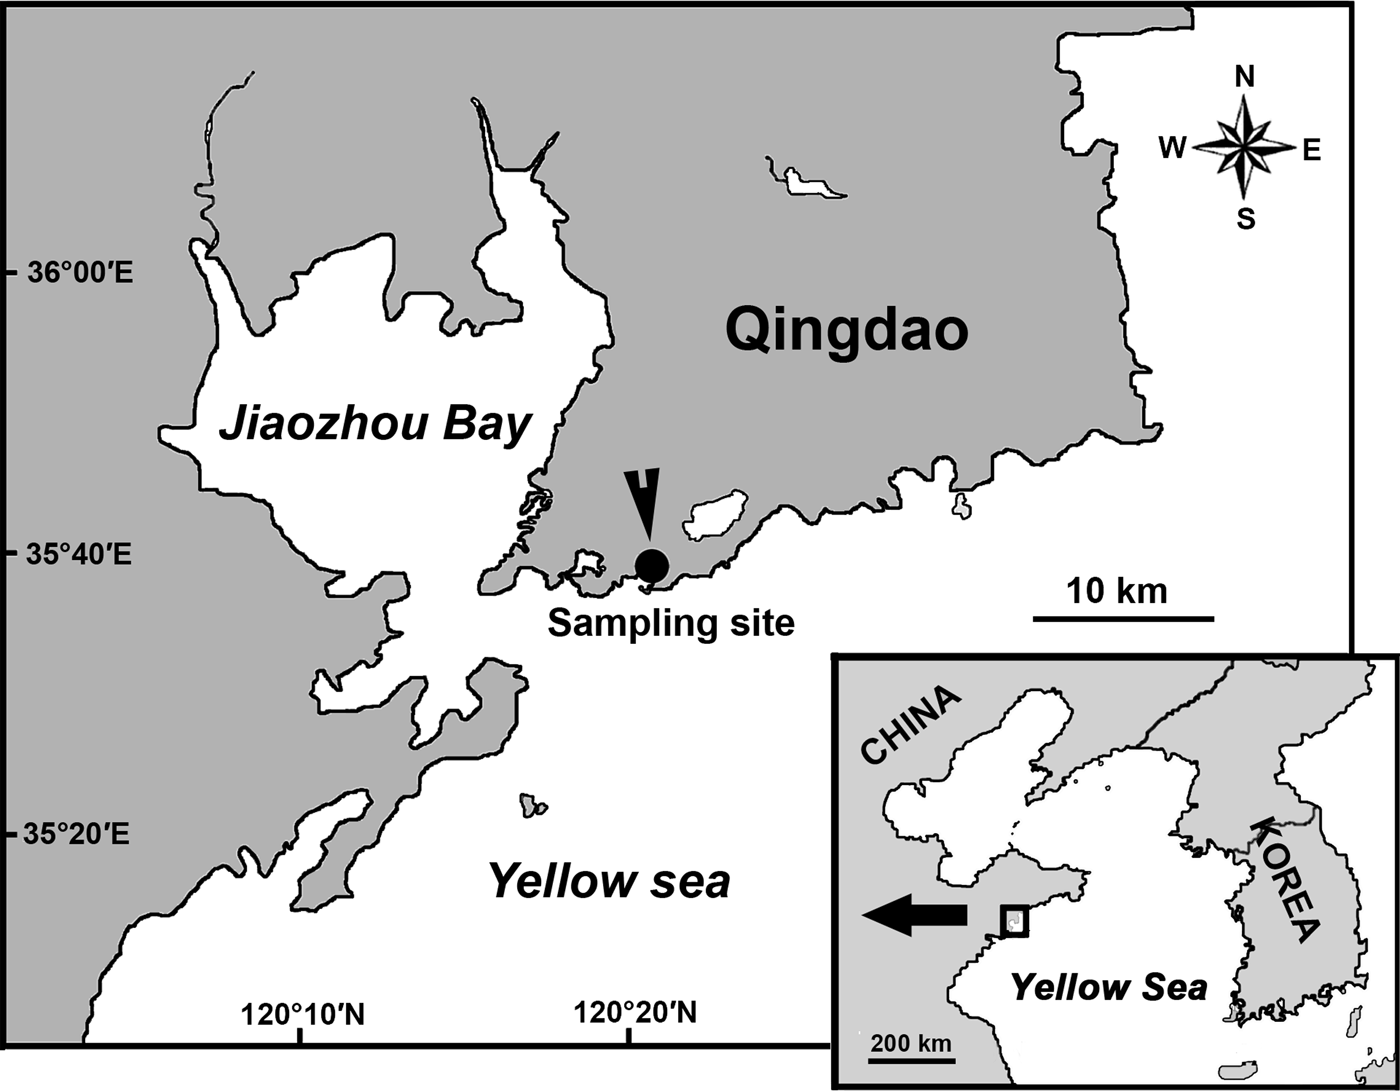
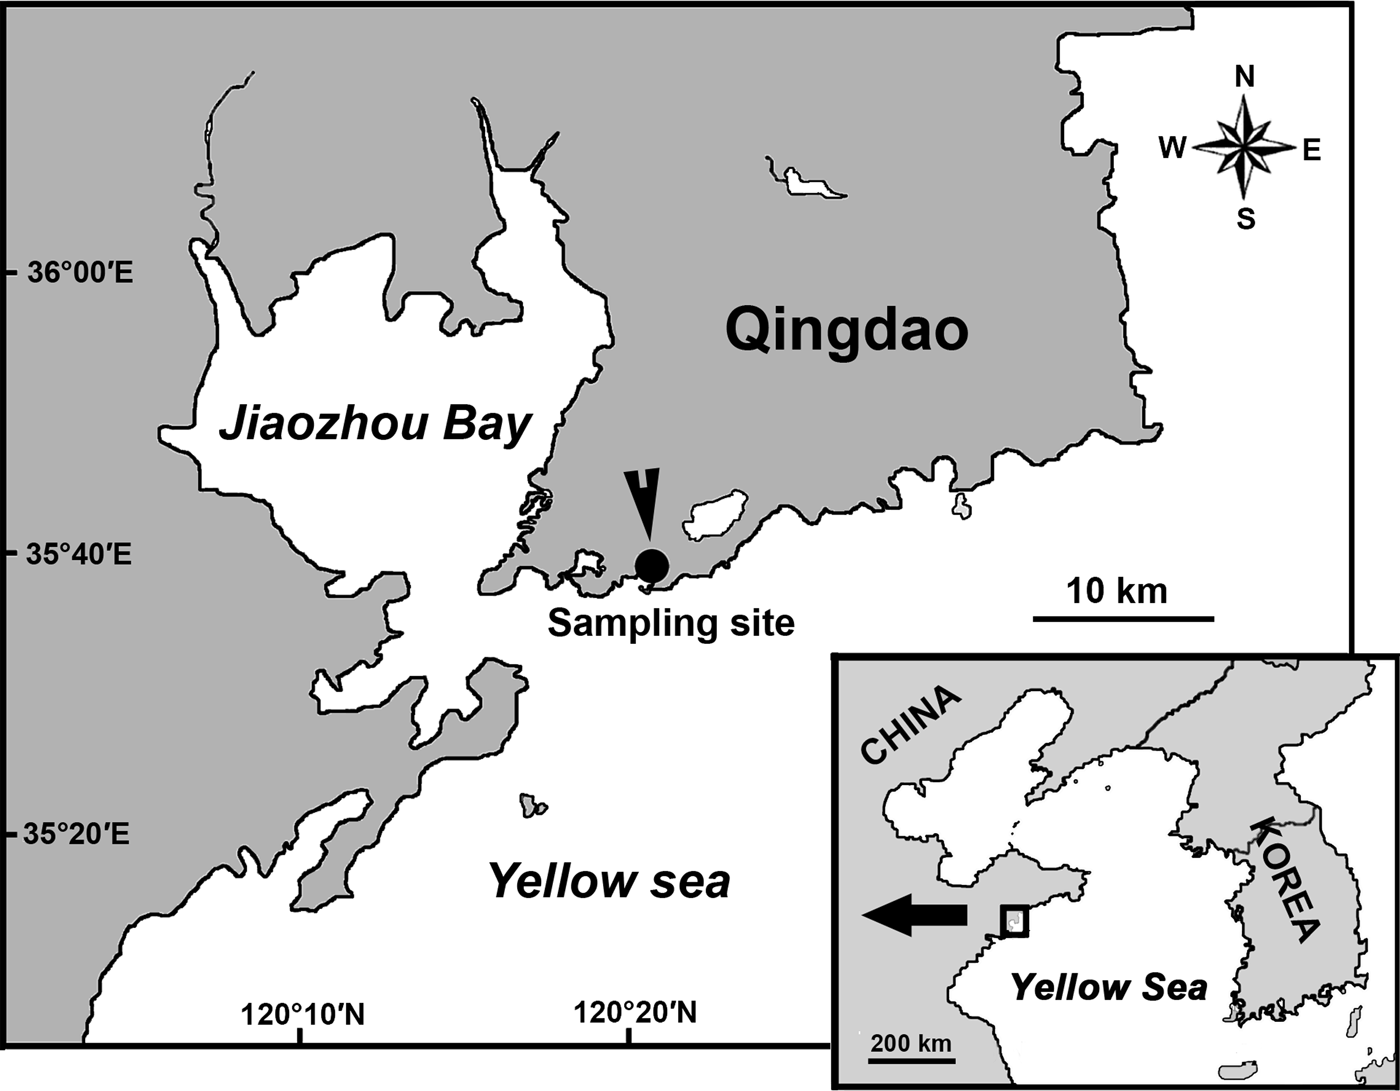
The study site was located at the coastal waters, near the Olympic Sailing Center of Qingdao, northern China (Figure 1). This is a typical coastal area of the Yellow Sea with an average depth of ~8 m (average tidal range: 3 m), having a high diaphaneity of ~3 m. Our survey was carried out during the period 18 May–16 June 2010 (water temperature: 14–19°C; pH: ~8; salinity: 30–31 psu; dissolved oxygen: 6–7 mg l−1).
Map of the sampling station, which was located at coastal waters near Qingdao, northern China.
The glass slide systems were designed, deployed, anchored, and sampled as described by Xu et al. (Reference Xu, Min, Choi, Jung and Park2009a, Reference Xu, Min, Choi, Kim, Jung and Limb). A total of 280 glass slides (2.5 × 7.5 cm) were used as artificial substrata for collecting periphytic ciliates at depths 1 and 3 m below the water surface. For each depth, a total of seven polyvinyl chloride (PVC) frames were used to hold the 140 slides, which were used as two replicates. For each replicate, 10 were randomly collected from each PVC frame at the time intervals of 1, 3, 7, 10, 14, 21 and 28 days, during the study period. At both depths, samples were collected simultaneously.
Identification and enumeration
Ciliate identification and enumeration were conducted following the methods outlined by Xu et al. (Reference Xu, Min, Choi, Jung and Park2009a, Reference Xu, Min, Choi, Kim, Jung and Limb). Protargol staining was performed for species identification (Berger, Reference Berger1999). Taxonomic classification of ciliates was based on the published references to keys and guides such as Song et al. (Reference Song, Warren and Hu2009).
The enumeration of ciliates in vivo was conducted at a 100-fold magnification under an inverted microscope as soon as possible within 4–8 hours after sampling in order to prevent significant changes in species composition (Xu et al., Reference Xu, Min, Choi, Jung and Park2009a, Reference Xu, Min, Choi, Kim, Jung and Limb). For recovering all species colonizing the glass slides, a whole slide (17.5 cm2) was examined to record both occurrences and individual abundances, using bright field illumination. After 14-days exposure time, for counting the numbers of dominant ciliates, 20 fields of view per slide were randomly chosen. The ciliate abundances were calculated from two replicates with 10 glass slides each to confirm the average abundance of ciliates (ind cm−2).
Data analysis of samples
Species diversity (H′), evenness (J′) and species richness (D) of samples were calculated as follows:
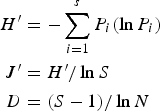 $$\eqalign{H^{\prime}&= -\sum_{i=1}^s {P_i\lpar \ln P_i\rpar } \cr J^{\prime}& =H^{\prime} / \ln S \cr D& =\lpar S - 1\rpar / \ln N}$$
where H′ = observed diversity index; P i = proportion of the total count arising from the i th species; S = total number of species; and N = total number of individuals (Xu et al., Reference Xu, Min, Choi, Jung and Park2009a, Reference Xu, Min, Choi, Kim, Jung and Limb).
The colonization process of periphytic ciliate communities can be followed by sampling replicate glass slides over time to follow the rate and magnitude of the species accrual process. Data can thus be fitted to the colonization equilibrium model developed by MacArthur & Wilson (Reference MacArthur and Wilson1967):
 $$S_{t} = S_{\rm eq} \lpar 1- e^{-Gt}\rpar$$
where S t = the species number at time t; S eq = the estimated equilibrium species number of ciliate colonization; G = the constant value of colonization rate; T 90% = the time taken for reaching 90% S eq.
Three functional parameters (S eq, G and T 90%) were calculated using the SIGMAPLOT. Fitness tests were conducted to assess if the species numbers observed according to days fit with the MacArthur–Wilson model at the 0.05 significance level.
The increase of individual abundance over total experimental phase was tested if it was fitted to the logistic model:
 $$A_{t} = A_{\max}/\lsqb 1-e ^{\lpar {a}-{rt}\rpar }\rsqb$$
where A t = the individual abundance at time t; A max = the carrying capacity of individual abundance (maximum abundance); r = the growth rate constant; and a = the coefficient constant of initial individual abundance; T 50% = the time to 50% A max. All parameters (e.g. A max and T 50%) were estimated using the SIGMAPLOT. Fitness tests were to determine whether the individual abundance recorded at each time interval fit with the logistic model at the 0.05 significance level (Zhang et al., Reference Zhang, Xu, Jiang, Zhu and Al-Resheid2012).
The community structures of samples were analysed using the PRIMER 6.1 package (Clarke & Gorley, Reference Clarke and Gorley2006). The multivariate analyses of cluster were used to summarize species distribution, using Bray–Curtis similarities from the fourth-root transformed/standardized species–abundance data, while the clustering analyses for samples in abundance and species composition were computed based on Bray–Curtis and Sørensen similarities from the fourth-root transformed species–abundance and presence/absence data, respectively (Clarke & Gorley, Reference Clarke and Gorley2006; Xu et al., Reference Xu, Min, Choi, Jung and Park2009a, Reference Xu, Min, Choi, Kim, Jung and Limb). The SIMPROF test was used to determine the significant difference among samples for clustering analyses, while differences in ciliate communities between the two water depths were tested by the submodule analysis of similarities (ANOSIM) at the 0.05 level. The contribution of each species to the average Bray–Curtis dissimilarity between groups of samples, as well as to the similarity within a group was examined by the submodule similarities of percentages (SIMPER) (Xu et al., Reference Xu, Min, Choi, Jung and Park2009a, Reference Xu, Min, Choi, Kim, Jung and Limb).
The non-parametric Kolmogorov–Smirnov test was used to evaluate the differences in the species number and colonization rates between depths of 1 m and 3 m at the 0.05 level, using the software SPSS (version 16.0). Data were log-transformed before analysing them.
RESULTS
Taxonomic composition
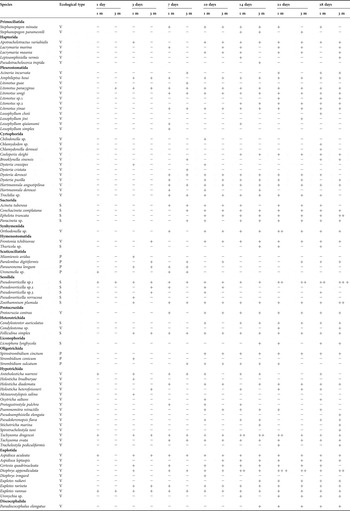
A total of 80 ciliate species were identified in ciliate communities of the 1 m (73) and the 3 m (65) samples in the coastal waters during the whole study period. The vagile taxa mainly belonged to Euplotida, Pleurostomatida, Cyrtophorida, Hypotrichia and Heterotrichida, while other ciliates represented sessile and planktonic forms, with species mainly belonging to Sessilida and Suctorida, and Scuticociliatida and Oligotrichida, respectively (Table 1). It should be noted that the planktonic taxa detected may be generally transported to the slides from the water.
List of the species of periphytic ciliates recorded in a total of 40 (20 1-m and 20 3-m) samples collected from coastal waters during the period May–June 2010, including ecological type and degree of average abundances.

Se, sessile; V, vagile; P, planktonic; + = 0–10 ind cm−2; ++ = 10–100 ind cm−2; ++ + = 100–400 ind cm−2; ++ + + = over 400 ind cm−2.
The taxonomic compositions of ciliate colonization showed similar patterns between the two water depths. Of the total 80 ciliate taxa, 17 orders and 19 genera were found from the two layers (Table 1).
The ecological compositions of ciliate colonization showed the same patterns between the two water depths. The vagile ciliates represented the majority of species number, accounting for 74% of the cumulative total species number, and the sessile and planktonic taxa accounted for 18% and 8%, respectively (Table 1).
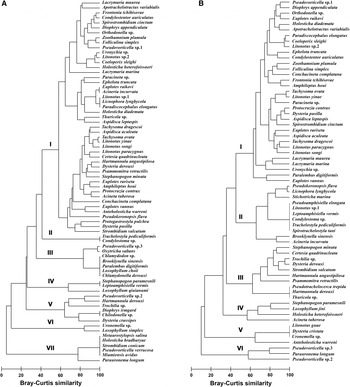
Two dendrograms of the species distribution in the samples of both the 1 m and the 3 m samples were plotted using group-average clustering from the Bray–Curtis similarities on fourth-root transformed abundances (Figure 2). The cluster analysis resulted in the 73 ciliates of the 1-m samples falling into seven groups (I–VII) at a 50% similarity level: the ciliates of group I were composed of 49 dominant ciliates with high abundance and/or occurrence, and the other 6 groups (II–VII) represented the assemblages with low abundance and/or occurrence (Figure 2A). In the 3 m samples, 65 ciliate taxa were assigned to 6 groups (I–VI), but group I included 32 same species to group of the 1-m samples in a total of 33 dominant species, the other groups (II–VI) also represented assemblages with low abundance and/or occurrence (Figure 2B).
Dendrograms of the species distribution using group-average clustering on Bray–Curtis similarities on fourth-root transformed/standardized abundance data of each species within the ciliate communities at depths of 1 m (A) and 3 m (B) in coastal waters of the Yellow Sea, northern China during the study period.

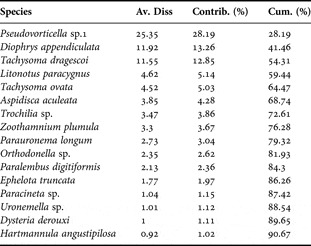
SIMPER analysis revealed that the species distributions were greatly different at an 89.90% dissimilarity level with regard to both abundance and occurrence between the 1 m and the 3 m samples (Table 2). There were 16 ciliate taxa at 90% level of the cumulative contribution percentage between the 1 m and the 3 m samples involving most species of both groups I above (Table 2). Pseudovorticella sp. 1 (29.19%), Diophrys appendiculata (13.26%) and Tachysoma dragescoi (12.85%) were the most primary contributors to the dissimilarity of the two groups in abundance and/or occurrence.
Contribution of the top 16 species with a cumulative contribution of 90% to the average Bray–Curtis dissimilarity (89.90%) between the 1 and 3 m-ciliate communities in both occurrence and abundance.

Av. Diss. (%), average dissimilarity; Contrib. (%), contribution; Cum. (%), cumulative contribution.
Temporal dynamics of ciliate colonization
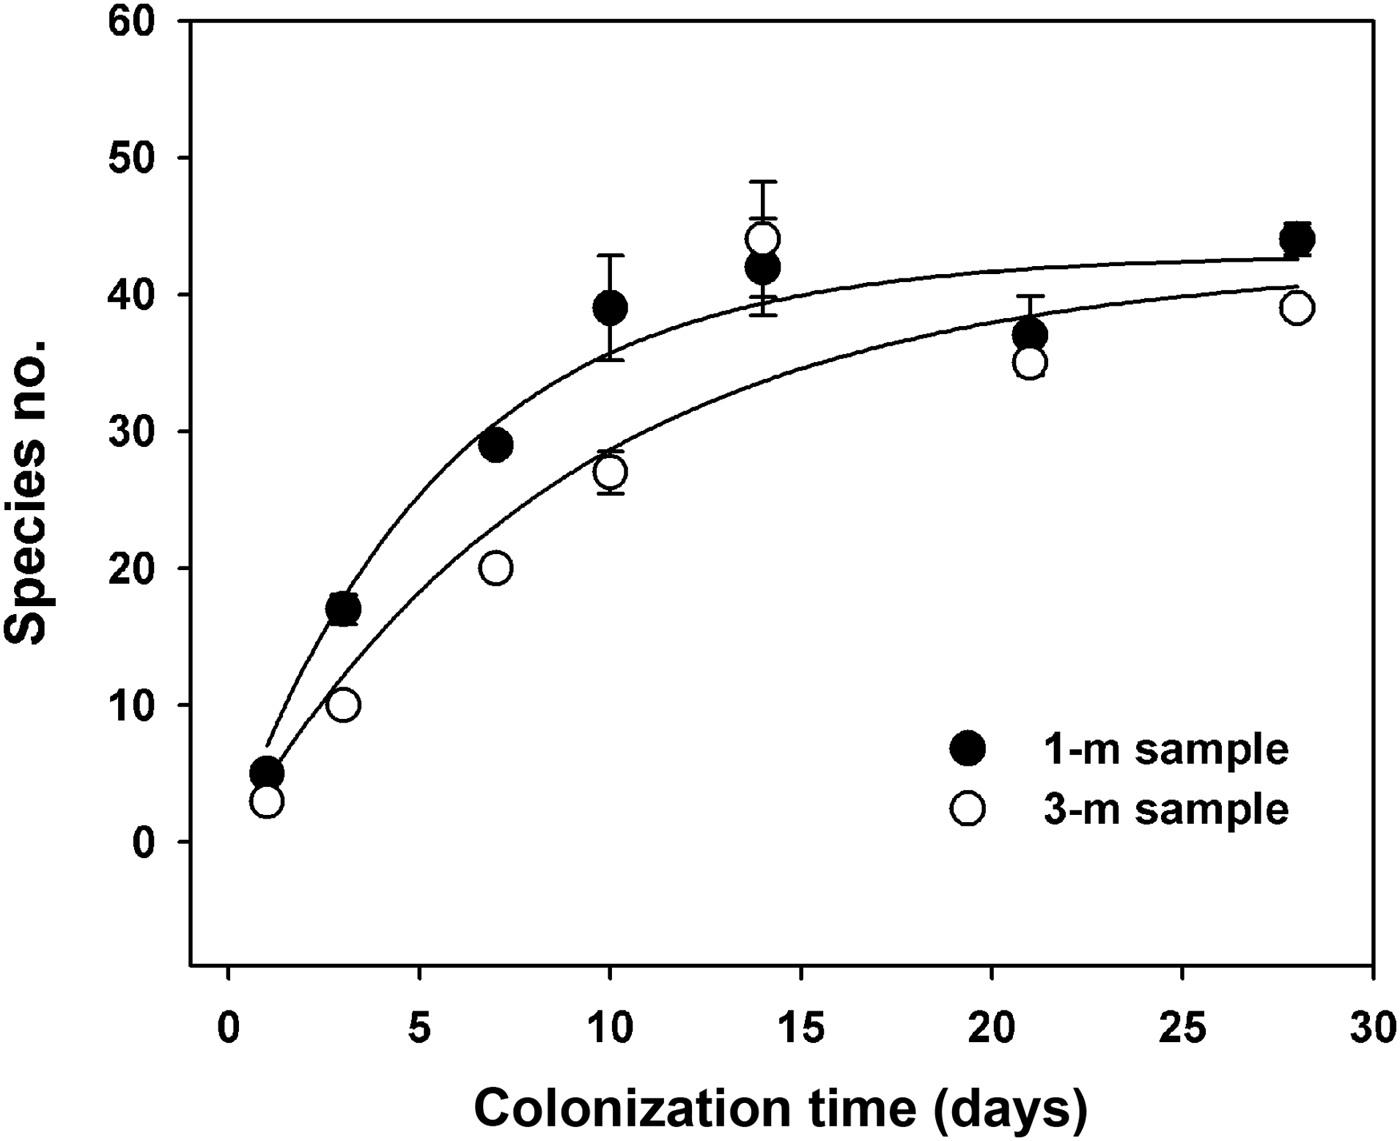
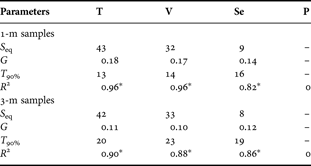
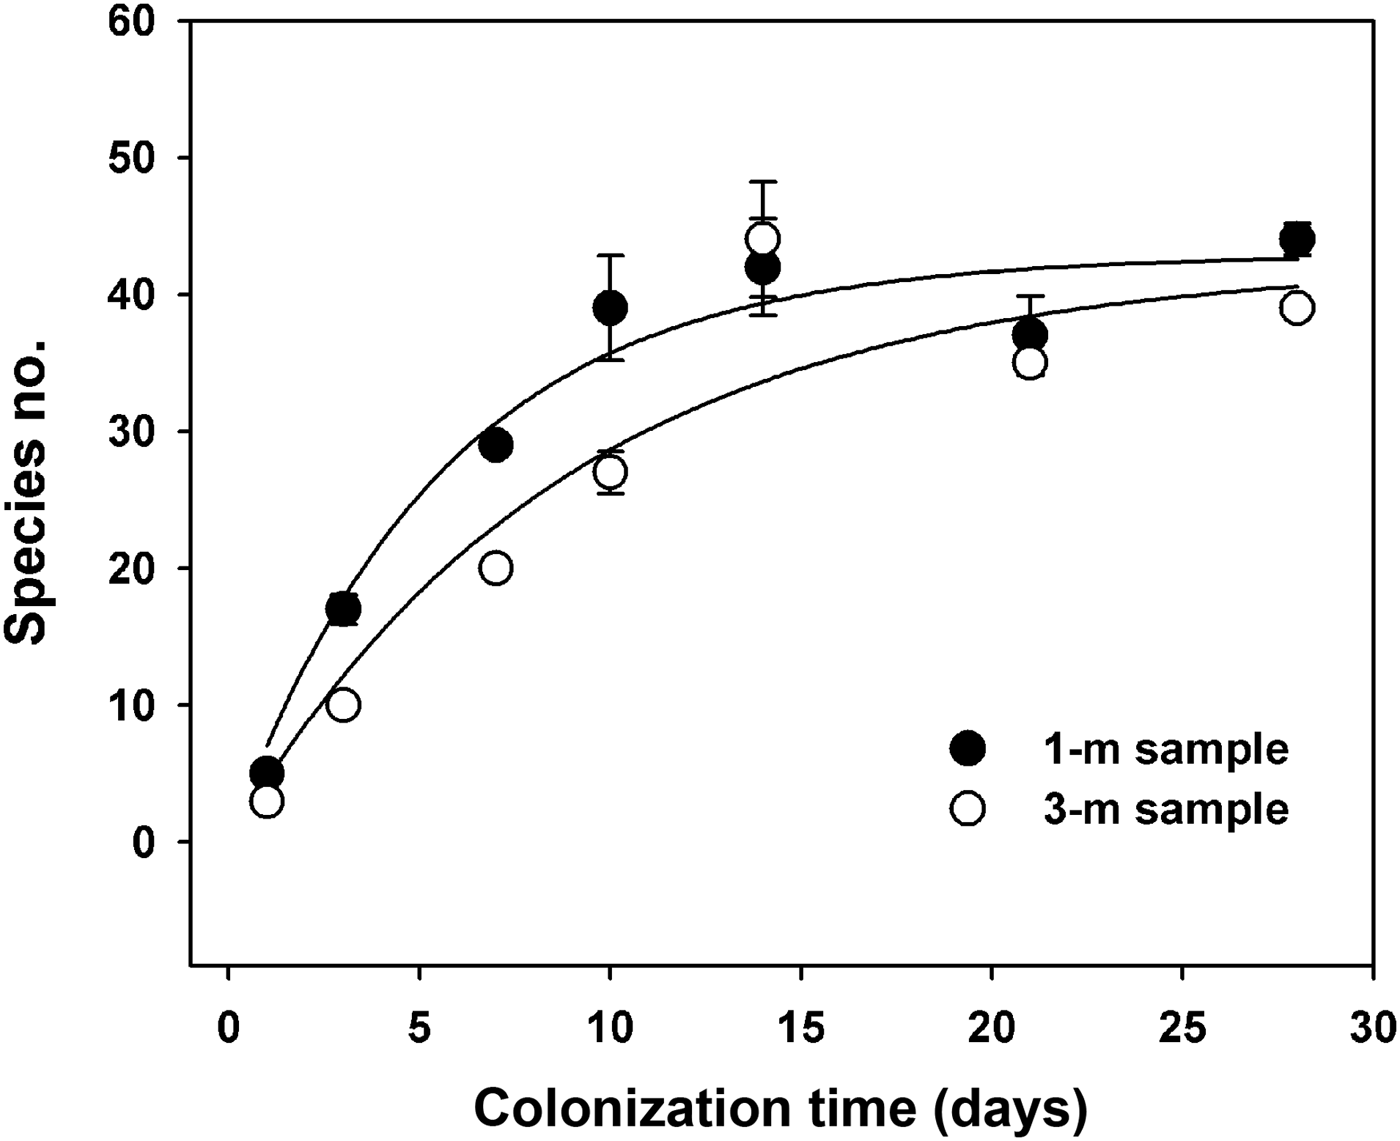
Colonization curves of the ciliate communities in both the 1 m and 3 m samples exposed for 1, 3, 7, 10, 14, 21 and 28 days are illustrated in Figure 3. The colonization rates expressed by the species number over time obtained from this study were comparably higher at the 1 m layer than those at the 3 m depth (Figure 3). Regression analyses demonstrated that the colonization curves of the ciliates at both depths were well fitted to the MacArthur–Wilson model (Table 3).
Colonization curves of periphytic ciliate communities at depths of 1 m and 3 m in coastal waters of the Yellow Sea, northern China during the study period. Species no., species number.
Colonization curve fitness to the MacArthur–Wilson model for total periphytic ciliate communities and each ecological (vagile, sessile and planktonic) assemblage at depths of 1 m and 3 m in coastal waters of the Yellow Sea.
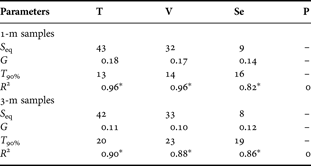
T, total ciliates; V, vagile; Se, sessile; P, planktonic; S eq, the estimated equilibrium species number of ciliate colonization; G, the colonization rate constant; T 90% (day), the days taken for reaching 90% S eq; R 2, coefficient of determination; *, significant difference at 0.05 level.
Estimates of three functional parameters, i.e. species number during the equilibrium (S eq), constant value of colonization rate (G), and time taken to reach 90% S eq (T 90%) were calculated for the colonization process based on fitting the MacArthur–Wilson species equilibrium model (Table 3). The G value, as a parameter that represents the colonization rate, was greatly higher in the 1 m samples than in the 3 m ones. The T 90% value that positively correlated with the G value was lower in the 1 m communities compared with the 3 m communities (Table 3).
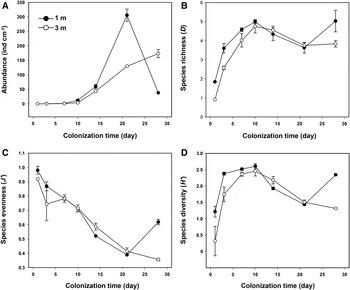
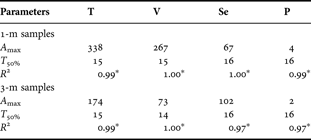
The ciliate abundances peaked in the periods of more than ~14 days at both depths (Figure 4A). The regression fitness test showed that the abundances well fitted the logistic model (Table 4). It should be noted that the estimated maximum abundances (A max) of the ciliates were higher at a depth of 1 m than at 3 m (P < 0.05) (Table 4).
Temporal variations of species abundance (A), richness (B), evenness (C) and diversity (D) of periphytic ciliate communities at depths of 1 m and 3 m in coastal waters of the Yellow Sea, northern China during the study period.

Increase curve fitness to the logistic model for total periphytic ciliates and each ecological (vagile, sessile and planktonic) assemblage at depths of 1 m and 3 m in coastal waters of the Yellow Sea.
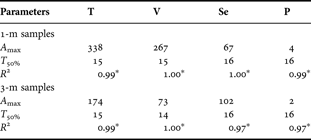
T, total ciliates; V, vagile; Se, sessile; P, planktonic; A max (ind cm−2), the carrying capacity of individual abundance (maximum abundance); T 50% (day), the days to 50% A max; R 2, coefficient of determination; *, significant difference at 0.05 level.
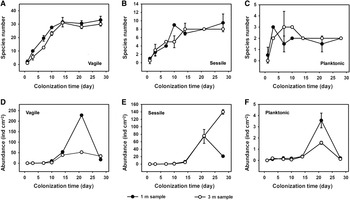
The colonization process and increase in abundance of three ecological assemblages are summarized in Figure 5. Except the planktonic assemblage, the colonization curves of both vagile and sessile forms also significantly fitted the MacArthur–Wilson model (Table 4). Otherwise, in terms of growth curves, all three ecological assemblages well fitted the logistic equation (Table 4). Although the S eq and T 50% values have similar values, the colonization rates (G) and A max values were definitely higher at a depth of 1 m than 3 m, respectively (Tables 3 & 4; P < 0.05).
Temporal patterns of sessile (A, D), vagile (B, E) and planktonic (C, F) ciliates in species number (A, B, C) and abundance (D, E, F) at two depths of 1 m and 3 m.

Structural parameters of ciliate communities
The temporal variations of structural parameters including the species number, richness, evenness and diversity as well as the abundance of ciliate communities colonizing the glass slides during study period are shown in Figure 4. Although the ciliate abundances represented an increasing trend at both depths with respect to the temporal scales, the numbers in the 3-m communities were significantly lower than those in the 1-m communities (Figure 4A).
All three diversity indices of ciliate communities basically showed temporal variation. The species richness and diversity levelled off at a relatively stable level after 10 exposure days, whereas the species evenness represented a decreasing trend over 28-days colonization period. It also showed that all three diversity indices of the 1-m communities represented higher values than those of the 3-m communities before 14 days (Figures 4C–D).
Temporal patterns of ciliate communities
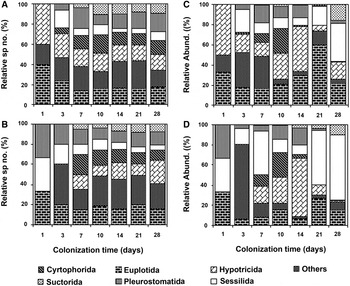
The temporal succession of ciliate community structures in terms of both relative species number and relative abundance is summarized in Figure 6. Results revealed a clear temporal pattern of ciliate community succession during the colonization period at both depths: (1) Euplotida, Hypotrichida and Pleurostomatida were the primary contributors to the ciliate communities over the whole colonization period, while the others (e.g. Cytophorida and Suctorida) represented low levels in relative species number and occurred in the late samples (e.g. Suctorida); and (2) Pleurostomatida and Sessilida colonize the slides later at a depth of 1 m rather than at 3 m, while the Hypotrichida represented a reverse case (Figure 6).
Temporal variations of relative species number (A, B) and relative abundance (C, D) of periphytic ciliate communities at depths of 1 m (A, C) and 3 m (B, D) in coastal waters of the Yellow Sea, northern China during the study period. Others include the ciliate orders with low species richness/abundance (e.g. Primociliatida, Synhymeniida, Hymenostomatida, Protocruziida and Liconophorida). Species no., species number; abund., abundance.

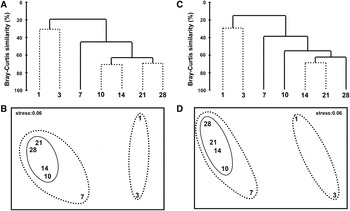
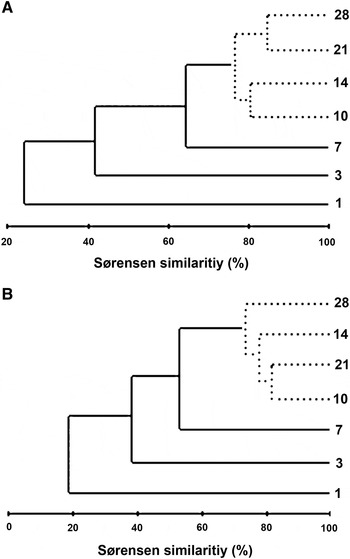
Clustering analyses with the SIMPROF test revealed that the colonization process of periphytic ciliate communities in coastal waters might be assigned into three stages with significant difference between each pair (P < 0.05): the initial (1–3 days); transitional (7 days or more); and the equilibrium (10–28 days) stages (Figure 7). It should be noted that at the equilibrium stage, no significant differences were found among samples in species composition (occurrence), although the ciliate communities showed significant difference in abundance (Figures 7 & 8).
Cluster analysis of 7 samples at depths of 1 m (A, B) and 3 m (C, D) on Bray–Curtis similarities from fourth-root transformed species–abundance data, showing the colonization dynamics of the ciliate communities in abundance. Dotted lines show no significant difference among samples.

Cluster analysis of 7 samples at depths of 1 m (A) and 3 m (B) on Sørensen similarities from presence/absence data, showing the colonization dynamics of the ciliate communities in occurrence (species composition). Dotted lines show no significant difference among samples.

DISCUSSION
Periphytic ciliate colonization, which commonly initiates after bacteria, diatoms and autotrophic flagellates colonize a new artificial substratum surface, generally follows the succession: at first, bacterivorous, vagile species of ciliates occur, followed by larger species with a broader feeding spectrum and sessile feeders in freshwater biotopes (Railkin, Reference Railkin1995; Franco et al., Reference Franco, Esteban and Téllez1998; Strüder-Kypke, Reference Strüder-Kypke1999). Previous studies have demonstrated that during the primary colonization process, the number of species generally increases and then equilibrates, following the MacArthur & Wilson (Reference MacArthur and Wilson1967) equilibrium model (Xu et al., Reference Xu, Cao, Xie, Deng, Feng and Xu2005, Reference Xu, Min, Choi, Jung and Park2009a; Zhang et al., Reference Zhang, Xu, Jiang, Zhu and Al-Resheid2012). Once equilibrium of immigration ends, the decline phases follow, during which internal factors such as competition and predation pressure become more important (Cairns & Henebry, Reference Cairns, Henebry and Cairns1982; Railkin, Reference Railkin1995; Zhang et al., Reference Zhang, Xu, Jiang, Zhu and Al-Resheid2012).
It should be noted that the classic MacArthur–Wilson model not only summarizes an asymptotic curve of accumulated species number, but also presupposes that number of species is determined by a dynamic balance between immigration and extinction, which rates depend on the richness achieved to the moment. In addition, it also should be noted that the diversity indices generally decreased as the species number increased during the colonization process in our study. This may be due to the increasing competitive exclusion among the ciliate species as more species colonized the substrata.
In terms of the temporal dynamics of the ciliate communities within our study, multivariate analysis demonstrated that the colonization process of periphytic ciliate communities in coastal waters might be assigned into the initial, transitional, exponential and the equilibrium stages. This finding was similar to the previous investigations on the colonization process of the benthic ciliate fauna in an estuary of the White Sea (Azovsky, Reference Azovsky1988; Have, Reference Have1993; Burkovskii & Mazei, Reference Burkovskii and Mazei2001; Brukovskii et al., Reference Burkovskii, Mazei and Esaulov2011). During the equilibrium stages, the periphytic ciliate communities in terms of species composition (i.e. presence/absence matrices) showed significantly high similarities, but represented a significant difference compared to those during the initial/exponential stage. However, it should be noted that the abundances in 28-days samples collected at 1 m dropped sharply to low level, mainly due to the intensive immigration of metazoan consumers (e.g. copepods, coelenterates, annelids and barnacles). This implies that the ciliate community structure changes significantly after 28-days exposure time. Thus, it is suggested that the colonization ages of 10–21 days might be considered sufficiently mature communities of periphytic ciliates in coastal waters of the Yellow Sea.
Functional parameters features are usually used to assess the loading capacity or assimilative capacity of an aquatic ecosystem for contaminant inputs (Wang et al., Reference Wang, Yuan and Shen1985; Xu et al., Reference Xu, Choi, Yang, Lee and Lei2002, Reference Xu, Cao, Xie, Deng, Feng and Xu2005; Zhang et al., Reference Zhang, Xu, Jiang, Zhu and Al-Resheid2012). Among the parameters, the S eq value (estimated equilibrium of species number) is generally negatively correlated with concentrations of organic pollutants and toxic levels, while the G value (colonization rate constant) is generally high in the waters with lower environmental stress (Cairns & Henebry, Reference Cairns, Henebry and Cairns1982; Xu et al., Reference Xu, Choi, Yang, Lee and Lei2002, Reference Xu, Min, Choi, Kim, Jung and Lim2009b). Based on our data, the colonization curves and the increase in abundance of the ciliates significantly fitted the MacArthur–Wilson model and a logistic equation, and showed a definite difference in functional parameters (e.g. G, T 90% and A max) between different depths in the water columns. These findings were consistent with the previous reports (Xu et al., Reference Xu, Cao, Xie, Deng, Feng and Xu2005, Reference Xu, Min, Choi, Kim, Jung and Lim2009b, Reference Xu, Zhang, Jiang, Zhu, Al-Rasheid, Warren and Song2011a; Norf et al., Reference Norf, Arndt and Weitere2007; Zhang et al., Reference Zhang, Xu, Jiang, Zhu and Al-Resheid2012).
It should be noted that the species numbers and colonization rates were definitely higher at a depth of 1 m than at 3 m, although the periphytic ciliate communities showed no significant difference in community structure. This may be mainly due to the weak sunlight conditions and less food supply at a depth of 3 m in the water columns with a transparency of ~3 m. This may be also the reason that both accumulative species number and individual abundance were higher at a depth of 1 m than 3 m during the study period. Additionally, this study was conducted based on one dataset collected from coastal waters of the Yellow Sea in summer. Thus, further studies on a range of marine waters and over extended time-periods are needed in order to verify this conclusion.
In summary, the temporal patterns of ciliate colonization had similar dynamics and fitted the MacArthur–Wilson and logistic models in colonization and growth curves at both depths, respectively. The ciliate communities reached equilibrium in species composition within at least 10-days exposure time. However, they differed in both structural and functional parameters between the two layers, despite similar species composition. The species diversity, evenness, the colonization rate (G) and the maximum abundance (A max) were distinctly higher, but the time for reaching 90% equilibrium species number (T 90%) was shorter at the depth of 1 m than those at a deeper layer. Results suggest that it is an optimal strategy to collect the ciliate communities within shorter exposure time at 1 m for ecological research and a monitoring programme in marine ecosystems.
ACKNOWLEDGEMENTS
This work was supported by ‘The Natural Science Foundation of China’ (project number: 41076089), and funded by the Research Group Project No. RGP-VPP-083, King Saud University Deanship of Scientific Research. Our special thanks are due to Professor Weibo Song, Laboratory of Protozoology, Institute of Evolution and Marine Biodiversity, Ocean University of China, for his helpful discussion with preparing the manuscript.