Introduction
Various infectious diseases have been reported as the results of natural disasters. Earthquakes are catastrophic natural events that cause mass casualties and contribute to the transmission of infectious diseases.Reference Linscott1 The loss of infrastructure, including the loss of power, water supply, and wastewater networks, are factors that may facilitate the spread of microorganisms. Overcrowding and sub-standard hygiene and sanitation are also factors that contribute to the spread of infection.Reference Sever, Erek and Vanholder2 Earthquake-related infections may be a result of trauma, inoculation by debris, or disruption of the soil (eg, exposure to liquefaction).Reference Linscott1
The majority of the literature studies Wang (2010), Linscott (2007), Keven (2003)) have focused on the immediate health care problems and hospital-acquired infections (HAI) with little focus on disaster-associated community-acquired infections which may present at longer time scales.Reference Linscott1, Reference Sever, Erek and Vanholder2, Reference Keven, Ates and Sever4
On February 22, 2011, the Christchurch earthquake (6.3 magnitude on the Richter scale) affected the central area and surrounding suburbs of the city. One hundred eighty-five people died, and 6,245 people were injured. Christchurch's central business district was characterized by the collapse of buildings, and infrastructure (water, sewage and power) remained damaged for weeks in residential zones, particularly in the eastern suburbs. Significant liquefaction also affected the eastern suburbs, with 580,000 tons of silt reported. Residents of these “earthquake” zones were required to use chemical or portable toilets until infrastructure was restored.Reference Ardagh and Richardson5
Routine monitoring of blood stream infections (BSI) by the laboratory serving Canterbury District Health Board's (CDHB) hospitals, Canterbury Health Laboratories (CHL), showed an increase in the number of people acquiring Escherichia coli (E. coli) sepsis compared with years 2009 and 2010. The most significant increase in these types of infections was observed in months following the February 2011 earthquake. It has been proposed that this sudden increase in E. coli BSIs may have been associated with the loss and damage of infrastructure and exposure to liquefaction following the earthquake.
Escherichia Coli is a gram-negative bacterium commonly found in the gastrointestinal tract. It is well documented that E. coli can cause bacteremia and sepsis in association with urinary tract infection (UTI), biliary tract infection, gastrointestinal infection or other intraperitoneal infection.Reference Wang, Hao and Lu3 Hospital-acquired infections can also occur, and are related to intravenous lines. Urosepsis (sepsis caused by infection of the urinary tract) is usually the predominant form of sepsis.Reference Wagenlehner, Pilatz and Weidner6
The aim of this research was to determine the influence of the Christchurch/Canterbury earthquakes on E. coli bacteremia. More specifically, the aim was to determine whether the increase in E. coli blood stream infections (BSI) in 2011 were related to the February 2011 earthquake period, and whether there was a relationship between E. coli BSI incidence and earthquake-damaged areas.
Methods
This was an epidemiological cohort study of all patients identified to have E. coli sepsis before and following the 2011 Christchurch Earthquake. This project was approved by Upper South B Regional Ethics Committee of the Ministry of Health New Zealand.
The Canterbury Health Laboratories (CHL) computer records were searched for isolates of E.coli from positive blood cultures recorded at the CDHB through the three-year period (2009-2011). Canterbury Health Laboratories processes all blood cultures in the Christchurch area. Urinary isolates, aspirates and other laboratory data related to the time of the blood culture isolates were also recorded.
Patient management records were searched for clinical data that placed the source of the sepsis into the following categories:
(1) Urinary (catheterized (CSU));
(2) Urinary (non-catheterized (MSU));
(3) Biliary tract infection (BIL);
(4) Gastrointestinal (GI); or
(5) OTHER (eg, IV line-related or other nosocomial infections, and neutropenic sepsis).
Urinary sepsis was identified based on a positive urine culture with E. coli as well as positive blood cultures. The other categories were obtained from discharge letters and a negative urine culture when such a culture result was available.
Using Geostan NZ geocoding software (Critchlow, Ltd., Wellington, New Zealand), this information was plotted to make it possible to analyze the possible clinical source of infection which resulted in the increase E. coli bacteremia. Other patient data collected for analysis were age, gender, national health index (NHI) number, post number of the patient's address, name of long-term care facility if applicable, and address of the patient's general medical practitioner. This information was collected to be able to analyze which area of Christchurch, if any, was responsible for the increase in infected patients.
Results were analyzed according to source of sepsis and the BSI group with the highest increase of E. coli bacteremia post earthquake (dominant group) was plotted against the New Zealand Index of Socio-Economic Deprivation 2006 (NZ Deprivation 2006) for 2009-2011 and for March-June 2011 using ESRI ArcGIS ArcMap 10 Geographic Information Systems Software (ESRI, Redlands, California USA).
The NZ Deprivation 2006 Index is derived from analysis of nine census variables: (1) income (benefits); (2) income (below threshold); (3) people not living in own home; (4) people <65 years of age in single-parent family; (5) unemployed people 18-64 years of age; (6) people 18-64 years of age with no qualifications; (7) home living space (below threshold); (8) people with no access to telephone; and (9) people with no access to an automobile. The NZ Deprivation 2006 index indicates that the lower the decile rating, the lower the level of deprivation; the higher the decile rating, the higher the level of deprivation.Reference Salmond, Crampton and Atkinson7
From the dominant source of sepsis group, the E. coli bacteremia rates by NZ Deprivation 2006 were calculated for the period 2009-2011, and for the period March-June 2011. Christchurch E. coli bacteremia rates by census area unit for March-June were plotted for 2009, 2010 and 2011, to compare and determine whether there was a change in the rate of E. coli bacteremia.
Investigation into the non-catheter related UTI-acquired E. coli BSIs was performed for the period March-June in 2009, 2010, and 2011 after this infection source was found to represent the increase in BSI. This period included the influence of the February earthquake on non-catheter UTI-acquired E. coli BSIs. Descriptive statistics were used to investigate the age of patients who had acquired non-catheter UTI-acquired E. coli BSIs during this period, as well as for the complete calendar year for 2009, 2010 and 2011. The gender of patients who had acquired E. coli bacteremia was also investigated for the same study period.
A map of E. coli transgressions from water testing samples in Christchurch following the February earthquake to post-June aftershocks was provided by Community and Public Health to offer a comparison with the spatial distribution of E. coli bacteremia cases post-February earthquake.
Results
All E. coli Blood Stream Infections 2009-2011
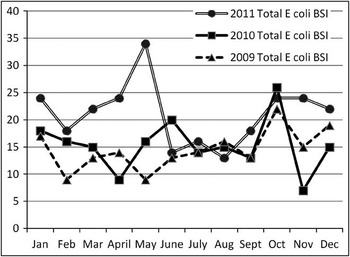
The data showing the increase in E. coli bacteremia that initiated the research is shown in Figure 1. The increase in E. coli bacteremia in 2011 started in March and peaked in May, returning to 2009 and 2010 levels in June 2011.
E. coli Bloodstream Infections, Canterbury District Health Board 2009-2011

Five hundred thirty patients had blood cultures positive for E. coli during the three years 2009-2011. There were 143 patients from the year 2009, 159 from 2010 and 228 from 2011.
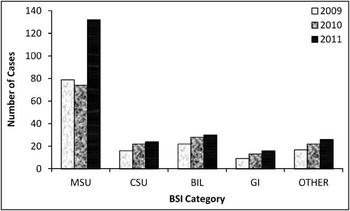
Urosepsis accounted for 60.3%-68.4% of all E. coli Blood stream infections during this study period (Table 1). All categories of E. coli bloodstream infections increased in 2011 compared with 2009 and 2010. The data in Figure 2 show that the major numerical increase in E. coli bacteremia in 2011 over the two preceding years was due to increase in urosepsis of the non-catheterized bladder, while the other categories of urosepsis originating from the catheterized bladder (CSU), biliary tract (BIL), gastrointestinal tract (GI) and OTHER showed only small numerical increases each year. Further analysis therefore concentrated on BSI related to infection of the non-catheterized bladder.
Patients with E. coli Bacteremia per Bloodstream Infection Category (Source) in Canterbury District Health Board, 2009-2011

Abbreviations: BIL, biliary tract infection; CSU, catheterized urine specimen; GI, gastrointestinal infection; MSU, midstream urine (non-catheterized urine specimen); OTHER, infection related to all sites other than GI, CSU, MSU, BIL or hospital- acquired infection
E. coli Bloodstream infections recorded at the CDHB 2009-2011. Bloodstream infection categories include: non-catheter UTI ((Mid-Stream Urine/MSU)), catheter related UTI (CSU), biliary tract infection (BIL), CDHB, Canterbury District Health Board; gastrointestinal (GI), and OTHER (eg, IV line infection, neutropenic sepsis).

E. coli BSI Related to Infection of the Non-Catheterized Bladder
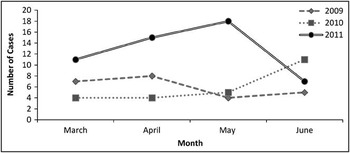
The number of E. coli BSIs decreased by five cases from 2009 to 2010, and increased by 58 cases from 2010 to 2011 (Table 1). The most substantial increase in the E. coli BSIs occurred in the months of March-May 2011, with the start of a decline in June 2011 (Figure 3). There was no significant difference in E. coli BSIs during the same period in 2009 and 2010 (Figure 3).
Patients with Non-catheter UTI-acquired E. coli Bacteremia During the Months of March-June, 2009-2011

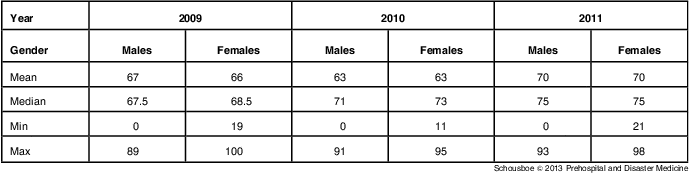
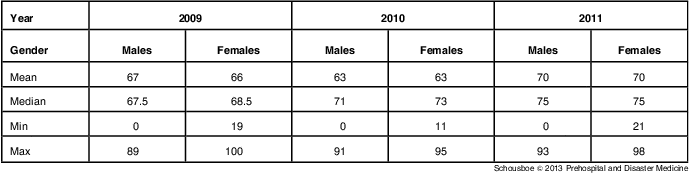
The median age of patients was 68 years in 2009, 71 years in 2010 and 75 years in 2011. The median age was lower in males than that of females in all three years (Table 2).
Age of Patients With E. coli Bacteremia Acquired from Non-catheter UTI 2009-2011, by gender
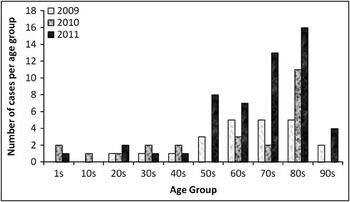
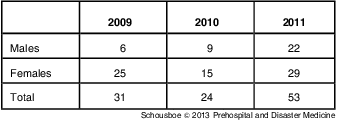
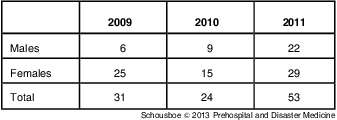
The majority of patients fell within the 50-80 years of age group (Figure 4). Seventeen patients (12.9%) with E. coli bacteremia were <50 years of age; 115 patients (87.1%) were ≥50 years of age. There were more BSI incidents in this age group in 2011 than in 2009 or 2010. The gender analysis demonstrated that, in all three years, females had a higher frequency of non-catheter UTI-acquired E. coli BSI than males. However, in 2011 there was a substantial increase in the number of males with non-catheter UTI-acquired E. coli bacteremia during the March-June period (22 patients) compared with 2009 (six patients) and 2010 (nine patients) (Table 3). The percentages of female and male patients with non-catheter UTI-acquired E. coli bacteremia were 78% and 22% respectively in 2009, 63% and 37% in 2010, and 53% and 47% in 2011.
Number of E. coli Bacteremia Related to Non-catheter Related UTI, 2009-2011, by Age Group

Cases of Non-catheter UTI-acquired E. coli Bacteremia During the Months of March-June, 2009-2011, by Gender
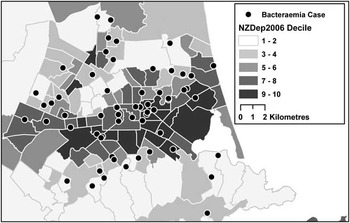
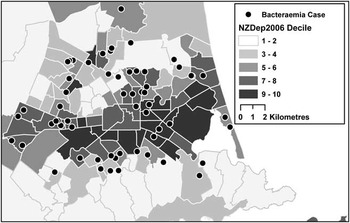
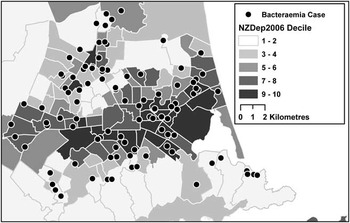
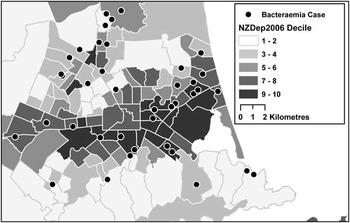
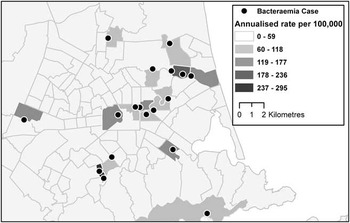
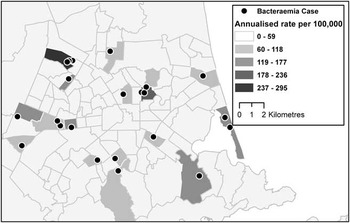
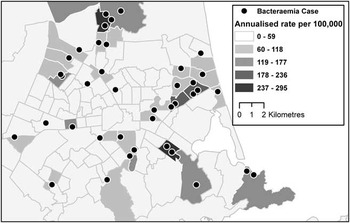
The number of patients with E. coli bacteremia acquired from non-catheter UTIs was plotted against the NZ Deprivation 2006 for 2009, 2010, 2011, and for March-June 2011 (Figures 5-8). The E. coli bacteremia rates were also plotted by census area unit (per 100,000) in the analysis periods March-June 2009, 2010 and 2011 (Figures 9 and 11).The analyses showed that there were more cases overall in 2011 compared with 2009 and 2010. The E. coli bacteremia cases in March-June 2011 (Figure 8) also appear to be distributed in two distinct zones: the eastern suburbs, and northwest suburbs.
Distribution of non-catheter UTI-acquired E. coli bacteremia cases, January-December 2009. Case points are placed at randomly selected coordinates a short distance from actual residential location. Weighted NZ Deprivation 2006 deprivation deciles are presented by Census Area Unit, decile 1 = least deprived, decile 10 = most deprived.

Distribution of non-catheter UTI-acquired E. coli bacteremia cases, January-December, 2010. Case points are placed at randomly selected coordinates a short distance from actual residential location. Weighted NZ Deprivation 2006 deprivation deciles are presented by Census Area Unit, decile 1 = least deprived, decile 10 = most deprived.

Distribution of non-catheter UTI-acquired E. coli bacteremia cases, January-December, 2011. Case points are placed at randomly selected coordinates a short distance from actual residential location. Weighted NZ Deprivation 2006 deprivation deciles are presented by Census Area Unit, decile 1 = least deprived, decile 10 = most deprived.

Distribution of non-catheter UTI-acquired E. coli bacteremia, March-June 2011. Case points are placed at randomly selected coordinates a short distance from actual residential location. Weighted NZ Deprivation 2006 deprivation deciles are presented by Census Area Unit, decile 1 = least deprived, decile 10 = most deprived.

Distribution of non-catheter UTI-acquired E. coli bacteremia rates by Census Area Unit, March-June 2009. Case points are placed at randomly selected coordinates a short distance from actual residential location. Weighted NZ Deprivation 2006 deprivation deciles are presented by Census Area Unit, decile 1 = least deprived, decile 10 = most deprived. Equal interval class breaks are presented based upon the highest annualized rate per 100,000 by census area unit in the analysis periods March-June 2009, 2010, and 2011.

Distribution of non-catheter E. coli bacteremia rates by Census Area Unit, March-June 2010. Case points are placed at randomly selected coordinates a short distance from actual residential location. Weighted NZ Deprivation 2006 deprivation deciles are presented by Census Area Unit, decile 1 = least deprived, decile 10 = most deprived. Equal interval class breaks are presented based upon the highest annualized rate per 100,000 by census area unit in the analysis periods March-June 2009, 2010, and 2011.

Distribution of non-catheter E. coli bacteremia rates by Census Area Unit, March-June 2011. Case points are placed at randomly selected coordinates a short distance from actual residential location. Weighted NZ Deprivation 2006 deprivation deciles are presented by Census Area Unit, decile 1 = least deprived, decile 10 = most deprived. Equal interval class breaks are presented based upon the highest annualized rate per 100,000 by census area unit in the analysis periods March-June 2009, 2010, and 2011.

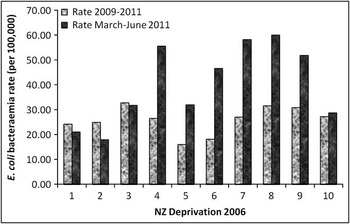
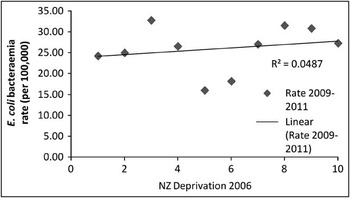
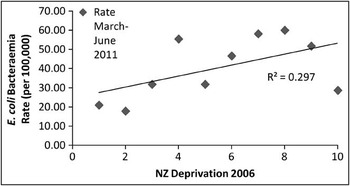
The rate of E. coli bacteremia cases acquired from urosepsis during the period March-June 2011 in the higher deciles zones was substantially greater than the rate for the entire three year period (Figure 12). There was a positive increasing trend towards association of E. coli bacteremia rate and NZ Deprivation 2006, with a correlation coefficient (R2) value of 0.0487 (Figure 13). However, the rate of E. coli bacteremia acquired from non-catheter UTIs for the March-June 2011 had a correlation coefficient (R2) value of 0.297 (Figure 14).
Rate of E. coli Bacteremia by NZ Deprivation (2006) for 2009-2011 and March-June 2011

Rate of E. coli Bacteremia Acquired from Non-catheter UTIs, 2009-2011

Rate of E. coli Bacteremia Acquired from Non-catheter UTIs, March-June 2011

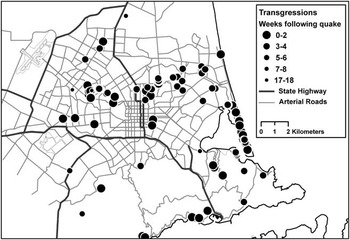
Monitoring of E. coli in the portable water showed some contamination in the period post February 2011 Earthquake (Figure 15). Contamination with E. coli had almost disappeared five weeks after the Earthquake.
Christchurch Post-earthquake Drinking Water E. coli Transgressions Post-February Earthquake to June 19, 2011, Including the Period of June Aftershocks

Discussion
The primary objective of this study was to determine the influence of Christchurch earthquakes on E. coli BSI, more specifically, to determine whether the 2011 increase in E. coli BSI was related to the period after the February 2011 earthquake.
In the period after the 2011 Christchurch earthquake, the number of bloodstream infections (BSI) acquired from a non-catheter related UTI substantially increased compared with a similar period in 2009 and in 2010. There may be a relationship between the February 2011 earthquake and the increase of BSIs acquired from an UTI. For a period after the earthquake, many Christchurch residents had little or no access to clean water supply or sewage and power networks. During that period, sub-standard hygiene and sanitation may have predisposed residents to acquiring this type of infection.
It is well documented that the incidence rate of E. coli BSI acquired from non-catheter UTIs increases with age, and that older age is a risk factor for acquiring an UTI.Reference Dairiki Shortliffe and McCue8 A urinary tract infection is the most frequent cause of bacteremia in elderly people.Reference Chin, Kim and Han9 All three years (2009-2011) recorded a higher incidence rate of non-catheter UTI-acquired E. coli BSI in females compared with males. However, during March-June 2011, a period following the February earthquake, there was a substantial increase in the number of males acquiring such infections. Offner (1999) recorded increased sepsis in males after major trauma or surgery, and concluded that “male gender is associated with a dramatically increased risk of major infections following trauma and the effect most significant following injuries of moderate severity.”Reference Offner, Moore and Biffl10 In this study, none of the patients with urosepsis were hospitalized for major trauma or surgery, as all patients with infections acquired during hospital admission were not included. However, none of the records searched included information on moderate trauma not requiring medical intervention or psychological trauma in the patients with urosepsis.
The spatial distribution of E. coli bacteremia acquired from non-catheter UTI related BSI with socioeconomic zone (NZ Deprivation 2006) for all three years, and for the four months following the February 2011 earthquake, did not appear to be only in the area with the most extensive liquefaction-related land damage, including the red-housing zone (defined by Canterbury Earthquake Recovery Authority as “an area where land repair would be prolonged and uneconomic”) and chemical toilet distribution zone, as hypothesized. If liquefaction was responsible for the increase observed in E. coli bacteremia cases, then it would be expected that the majority of cases would have been distributed in the east and southeast of Christchurch, which was not the case, as there also was an increase in the northwestern area. Minor liquefaction and broken water pipes were reported in the northwestern suburbs, but the area did not have the same extent of infrastructure damage as the eastern suburbs. Therefore, the timing of the increase in E. coli bacteremia related to UTI following the February earthquake and its relationship to liquefaction exposure cannot be ruled out. However, the peak increase in E. coli BSI occurred in May, approximately three months after the earthquake, by which time most of the heavily contaminated silts in the liquefaction-exposed suburbs had been removed. It is also unknown whether the E. coli BSIs were due to immediate infections of the urinary tract, or were a result of longer-standing bladder infections (eg, “asymptomatic bacteriuria”).
The rates of E. coli bacteremia by census area unit (per 100,000) for March-June 2009-2011 indicate that there was an association with socioeconomic status for bacteremia cases in 2011 which was not present in the previous two years. There was no obvious gradient or relationship between bacteremia rate and socioeconomic status in 2009-2011, whereas in 2011 the gradient was more pronounced. This correlates with the comparatively higher incidence of bacteremia post-earthquake in the eastern suburbs, which also tended towards a higher level of socioeconomic decile rate (more deprivation). However, this does not correlate with the incidence of E. coli BSI observed in the northwest suburbs of the city, nor with the age group of people acquiring these infections.
No spatial correlation was observed between the occurrences of E. coli transgressions from drinking water post-earthquake and E. coli BSI. If exposure to E. coli water contamination was the explanation for the increase in bacteremia cases, then it may have been expected that most of the cases would have been distributed in the east or southeast of the city. The majority of E. coli transgressions from drinking water occurred within the first four weeks following the February earthquake, which does not coincide with the peak increase in E. coli BSI after the 2011 earthquake.
It could also be hypothesized that the increased incidence of E. coli BSI acquired from non-catheter related UTI might relate to post-earthquake behavior of people in older age groups, rather than environmental contamination, such as E. coli water contamination or liquefaction-related land damage. At the time of the earthquake, the City Council and Civil Defense released public messages encouraging residents to conserve water due to infrastructure damage. It has been suggested that older people may have undertaken stricter water conservation practices, including reducing drinking water consumption which decreases the amount of urine output, and reducing the amount of water used for maintaining personal hygiene (bathing/showering). Both these actions could have predisposed these older residents to acquiring an UTI.
During the post-earthquake period, the sewage system was damaged in many areas. Portable toilets were distributed to the worst-affected areas, and chemical toilets were provided later. Potangaroa (2011) describes in detail the distribution and limitations of the provision of these facilities in the post-earthquake Christchurch.Reference Potangaroa, Wilkinson, Zare and Steinfort11 Portable toilets were placed on footpaths on the street, and emptying had to be carried out with a special suction system attached to a sewage truck. Chemical toilets were distributed to each house within a zone east of Christchurch. Once these toilets were filled, they had to be emptied into collection tanks by users; typically only one or two tanks were placed on each street. These ablution systems could have been very difficult and inconvenient for the elderly population to use. If the older persons had to pass urine during the night, which is not uncommon, using a portable toilet outside on the street or a low chemical toilet might not have been easy. This difficult system might have compelled some of the affected population to reduce water intake to avoid using portable toilets or to postpone emptying chemical toilets. Dehydration leads to a reduction in urine output, which increases bladder dwelling times, and some researchers have hypothesized that this may increase the risk of developing a UTI and pyelonephritis. It has been documented that the effectiveness of the bladder defense mechanism is, in part, dependent on urine output and voiding frequency.Reference Beetz12 At a university teaching hospital, it was found that UTI is frequently diagnosed among patients ≥65 years of age undergoing hip fracture surgery, and is linked to the number of days patients were kept off oral intake post-surgery.Reference Kamel Hosam13 Sung (2003) investigated patients admitted to the Korean University Hospital for acute pyelonephritis to investigate the predisposing related factors. The patients with acute pyelonephritis and renal failure demonstrated the tendency towards older age, more dehydration, more inflammation, more frequent abdominal abnormalities and frequency of chronic systematic disease than those patients without renal failure.Reference Sung, Kang and Lee14 Animal experiments may provide a rationale for the prevention and treatment of upper UTI, and may aid understanding in human cases. Andriole (1970) investigated the effect of water restriction on the course of E. coli pyelonephritis in the non-obstructed kidney of the rat. E. coli pyelonephritis was induced in the normal kidney of the rat through a decrease in daily water intake, which increases the osmolality of medullar tissue and its susceptibility to infection.Reference Andriole15 Therefore, voluntary dehydration leading to UTI and pyelonephritis may be an explanation for the high incidence of E. coli bacteremia acquired from non-catheter UTI observed in the older/elderly age groups during the period after the February 2011 earthquake.
Limitations
The main limitation of this study is its retrospective nature. Given the data available, it was possible to separate the increase in urosepsis from the expected increase based on previous years’ prevalence.
The address of the patient given at the time of admission to hospital might not have been the same as the address at the time of exposure risk during or immediately after the earthquake. Many moved from their damaged homes in the eastern suburbs to other areas of Christchurch with less damage, and their previous addresses were not available. This has implications for the study if the BSI related to the UTI was not immediate.
Conclusion
Following the February 2011 Earthquake in Christchurch, an increase in E. coli bloodstream infections was observed. An epidemiological cohort study of all patients with E. coli bloodstream infections during 2011 and the preceding two years confirmed that the increase was mainly in the four months after the earthquake, and that bacteremia acquired from non-catheter urinary tract infection (UTI) was the predominant form. The study also found that compared with the same period in the two previous years; there was a relative increase in the number of affected males, as well as an increase in the median age.
Possible factors contributing to the observed increase in E. coli BSI were considered, with no specific source found. Compared with previous years, an increased number of individuals from the eastern suburbs of Christchurch were affected. These suburbs trend towards a higher degree of socioeconomic deprivation, and the area suffered the most severe destruction and breakdown of infrastructure, including disruption to the sewage system necessitating widespread and prolonged need for portable toilets.
These findings have important implications in natural disaster situations, and justify development of strategies to identify UTI and pyelonephritis risk factors and manage E. coli bacteremia incidence rates. The strategy needs to consider periods beyond the acute phase of the disaster.
Acknowledgements
The authors thank the Canterbury Health Laboratories (CHL) and CHL Quality Manager for hosting the research and managing the student employment.