



Brain deterioration is a particularly debilitating and age-related physiological phenomenon. Reference Elliott1 In schizophrenia, extra-psychiatric features such as telomere shortening and inflammation exhibit signs of accelerated ageing, which has led to its classification as an accelerated ageing disorder. Reference Fernandez-Egea, Bernardo, Heaphy, Griffith, Parellada and Esmatjes2,Reference Kirkpatrick, Miller, García-Rizo and Fernandez-Egea3 In line with this, neuroimaging studies have shown that patients with schizophrenia undergo more rapid structural brain ageing compared with healthy controls. Reference Kirkpatrick, Messias, Harvey, Fernandez-Egea and Bowie4,Reference Reynolds, Jeste, Sachdev and Blazer5 Several reviews have highlighted that ageing in specific brain regions involves complex interactions between chronological age and cortical ageing, as well as between illness duration and cortical ageing Reference Ballester, Romano, de Azevedo Cardoso, Hassel, Strother and Kennedy6,Reference Stone, Phillips, Yang, Kegeles, Susser and Lieberman7 ; however, the spatiotemporal variability of accelerated cortical ageing in schizophrenia remains insufficiently understood. Moreover, a recent review emphasised that schizophrenia does not follow the trajectories of known neurodegenerative disorders such as Alzheimer’s disease. Reference Reynolds, Jeste, Sachdev and Blazer5 Neuropathological examinations of patients with schizophrenia who died in old age reveal no specific or observable degenerative changes. Reference Reynolds, Jeste, Sachdev and Blazer5 These findings underscore the need to explore alternative perspectives on the spatiotemporal variability of accelerated ageing in schizophrenia. Given that brain structure constrains and partially determines functional activity, Reference Fotiadis, Parkes, Davis, Satterthwaite, Shinohara and Bassett8 functional activity may similarly show signs of accelerated decline in schizophrenia. However, investigations into the decline of functional activity associated with disease progression remain limited. Elucidating the spatial and temporal variability of ageing in human cortical activities among healthy controls and subjects with schizophrenia is crucial for understanding the mechanisms driving decline due to typical ageing and disease.
Sydnor et al used resting-state functional magnetic resonance imaging (rs-fMRI) to demonstrate that neurodevelopmental plasticity in the cortical region of healthy individuals unfolds along the sensorimotor–association cortical axis, which represents a principal hierarchical axis of human brain organisation and shows region-specific differences. Reference Sydnor, Larsen, Seidlitz, Adebimpe, Alexander-Bloch and Bassett9,Reference Sydnor, Larsen, Bassett, Alexander-Bloch, Fair and Liston10 Using generalised additive models (GAMs), these authors captured both linear and non-linear features of intrinsic (i.e. spontaneous or non-evoked) cortical activity during development, showing that fluctuation amplitude predominantly exhibits asynchronous decline along the sensorimotor–association axis during adolescence. Reference Sydnor, Larsen, Seidlitz, Adebimpe, Alexander-Bloch and Bassett9 Interestingly, studies investigating the dynamics of cortical ageing similarly suggest that intrinsic activity in transmodal association cortices is more sensitive to ageing than in primary cortical regions. Reference Vieira, Rondinoni and Garrido Salmon11 Compared with healthy participants, intrinsic activity in transmodal association cortices, including the frontal lobe, shows even greater reduction in schizophrenia. Reference Sui, Qi, van Erp, Bustillo, Jiang and Lin12 These findings highlight regional differences in ageing. Additionally, emerging geroscience models conceptualise ageing not as an isolated life stage but as a lifelong process, driven by the gradual accumulation of organ system damage over the lifespan. Reference Elliott1 This has led to the development of brain age prediction models focusing on global brain characteristics, which have demonstrated that individuals with schizophrenia tend to have a relatively older brain. Reference Xi, Wu, Cui, Bai, Gan and Jia13 However, the pronounced spatiotemporal variability of cortical ageing remains undercharacterised.
It is undeniable that current research on accelerated ageing in schizophrenia exhibits heterogeneity. Some studies have failed to find evidence of accelerated ageing while others, particularly those with small sample size or first-episode subjects, have reported only modest changes. Reference Harvanek, Boks, Vinkers and Higgins-Chen14 These findings underscore the complexity of the disease process of schizophrenia, and the limitations of studies based on small sample size. Therefore, region-specific models built on large-scale data, capable of capturing both linear and non-linear features, may provide a more effective framework for elucidating typical ageing and schizophrenia progression.
In this work, we aimed to examine how spontaneous brain activity evolves across the lifespan in schizophrenia by employing fluctuation amplitude. Reference Lencz, Moyett, Argyelan, Barber, Cholewa and Birnbaum15,Reference Fortier, Dumais, Boisvert, Zouaoui, Chung and Potvin16 We hypothesised that both age- and disease-related changes in brain activity are organised along the sensorimotor–association axis, and that these patterns are associated with neurotransmitter systems. By testing these hypotheses, the current work helps to clarify the mechanisms of accelerated ageing and regional vulnerability in schizophrenia.
Method
Participants
Magnetic resonance imaging (MRI) data were acquired from individuals participating in the following consortia studies: the Cambridge Centre for Ageing Neuroscience data-set (controls, 652); the Center of Biomedical Research Excellence (schizophrenia, 80; controls, 84); the Japanese Strategic Research Programme for the Promotion of Brain Science project (schizophrenia, 92; controls, 234); the Depression Imaging Research Consortium (DIRECT; controls, 1104); the Clinical Hospital of Chengdu Brain Science Institute (schizophrenia, 207; controls, 56); the University of Electronic Science and Technology of China (schizophrenia, 84; controls, 126); and the affiliated hospital of University of Electronic Science and Technology of China (schizophrenia, 83; controls, 97). Reference Shafto, Tyler, Dixon, Taylor, Rowe and Cusack17–Reference Jiang, Luo, Li, Duan, He and Chen23 Taken together, 2353 healthy controls and 546 individuals diagnosed with schizophrenia were included in the present study. The supplementary material provides details on the participant characteristics of individuals with schizophrenia and healthy controls (Supplementary Tables 1–7 available at https://doi.org/10.1192/bjp.2025.10364).
Ethics statement
Data collection of all study cohorts was approved by their local institutional review boards. Written informed consent was obtained from all subjects/patients. The authors assert that all procedures contributing to this work comply with the ethical standards of the relevant national and institutional committees on human experimentation, and with the Helsinki Declaration of 1975 as revised in 2013.
Data preprocessing
fMRI data were preprocessed using a toolbox for data processing and analysis for brain imaging (DPABI) in MATLAB (MathWorks, Inc., Natick, MA, USA), Reference Yan, Wang, Zuo and Zang24 while the DIRECT project provides preprocessed data. Reference Yan, Chen, Li, Castellanos, Bai and Bo20 Briefly, after discarding the first five volumes, remaining images were slice-time corrected and spatially realigned to the first volume and co-registered to a standardised template of echo-planar imaging. Nuisance signals (including 24-parameter motion correction, white matter and mean cerebrospinal fluid signals) were removed.
Fractional amplitude of low-frequency fluctuation
In this study, fractional amplitude of low-frequency fluctuations (fALFF) was employed to assess spontaneous brain activities, Reference Lencz, Moyett, Argyelan, Barber, Cholewa and Birnbaum15,Reference Fortier, Dumais, Boisvert, Zouaoui, Chung and Potvin16 which were calculated by DPABI and parcellated according to the Schaefer-400 atlas. Reference Schaefer, Kong, Gordon, Laumann, Zuo and Holmes25 fALFF values were harmonised using Combat to control for site variation, which demonstrated high efficacy in removal of site effects and retaining biological variability. Reference Fortin, Cullen, Sheline, Taylor, Aselcioglu and Cook26 Age, gender and diagnostic status were included as biological covariates in the harmonisation. Reference Fortin, Cullen, Sheline, Taylor, Aselcioglu and Cook26
Construction of ageing trajectory
We applied the robust GAM method to quantify the age dependency of cortical activity across different brain regions. GAM is effective at capturing flexibly model linear and non-linear relationships between brain activities and ageing effects. The model parameters were derived from a published work. Reference Sydnor, Larsen, Seidlitz, Adebimpe, Alexander-Bloch and Bassett9 Briefly, we implemented GAMs using the mgcv package in R 4.3.1, with thin-plate regression splines as the smooth-term basis set (maximum basis complexity, k = 3) and the restricted maximal likelihood approach for smoothing parameter selection. Reference Sydnor, Larsen, Seidlitz, Adebimpe, Alexander-Bloch and Bassett9,Reference Wood27 Models were fit separately for each brain region in each group, with fALFF as the dependent variable, age as a smooth term, gender as covariate and sites as random effect. Regional age–ageing trajectories were obtained. The model constructed, based on healthy controls, was regarded as the normative distribution.
Construction of schizophrenia disease progression trajectories
Ageing deviation, defined as the z-scored difference between a patient’s actual value and the model-predicted normative value at their age based on normative distribution, quantifies the extent of deviation from typical ageing. Ageing deviation was computed after controlling for age effects, enabling exploration of its association with schizophrenia-specific parameters (i.e. disease duration). Reference Marquand, Rezek, Buitelaar and Beckmann28 Schizophrenia disease progression trajectories were fit by GAM, with the deviation as the dependent variable, duration as a smooth term, gender as covariate and sites as random effect.
Assessment of age and disease duration effects
The significance of the smooth term was assessed using the Wald test. The results highlight the significance of the age/duration smooth terms in models (P false detection rate (P FDR) < 0.05). To establish the overall magnitude and direction of the association between fALFF and age or deviation and duration, which we refer to throughout as a region’s overall age/duration effect, we calculated partial R 2 (effect magnitude) between the full GAM model and the reduced model (the smooth term is removed). The first derivative of the smooth function was calculated using finite differences, and partial R 2 was signed by the sign of the average derivative (effect direction).
Alignment with the sensorimotor–association axis
To test the overarching hypothesis that the impact of ageing and disease progression follows the sensorimotor–association axis, a principal hierarchical axis of human brain organisation (Supplementary Fig. 1), Reference Sydnor, Larsen, Seidlitz, Adebimpe, Alexander-Bloch and Bassett9,Reference Sydnor, Larsen, Bassett, Alexander-Bloch, Fair and Liston10 we assessed the correlation between the first derivative of regional trajectories and the sensorimotor–association axis by Spearman’s correlation. The corresponding 95% credible intervals were constructed based on sampling distribution from the posterior distribution of each GAM (10 000 times). Moreover, principal component analysis (PCA) was applied to progression trajectories. The first principal component explained 88% of the variance and can therefore be conceptualised as the principal spatial axis of schizophrenia disease progression trajectories, and it explains the greatest variance in how ageing deviation changed with duration. We quantified the similarity between the first principal component and the cortex sensorimotor–association axis via Spearman’s correlations. In addition, we quantified the similarity among the first principal component and anatomical hierarchy, functional hierarchy and evolutionary hierarchy as supplementary validation, and employed the Hittner et al (2003) test to assess correlation differences with the aid of the cocor package in R 4.3.1. Reference Sydnor, Larsen, Bassett, Alexander-Bloch, Fair and Liston10,Reference Benkarim, Paquola, Lariviere, Royer and Tavakol29,Reference Diedenhofen and Musch30
Dominance analysis with neurotransmitters
We assessed whether changes in ageing trajectories were spatially and temporally related to neurotransmitters. A total of 19 cortical maps of neurotransmitter receptor densities were collected from public data-sets (Supplementary Table 8) across nine different neurotransmitter systems, including dopamine, norepinephrine, serotonin, acetylcholine, glutamate, GABA, histamine, cannabinoid and opioid. Reference Hansen, Shafiei, Markello, Smart, Cox and Nørgaard31 These maps were then parcellated according to the Schaefer-400 atlas. Dominance analysis was adopted to associate the first derivative with density maps, which is a multivariate linear regression model designed to determine relative contributions (the ‘dominance’ of each independent variable to the overall fit). Reference Hansen, Shafiei, Markello, Smart, Cox and Nørgaard31 This quantified the contribution of different neurotransmitters at each age/duration increment and made dominance fully comparable both within and across models. Spin tests (5000 repetitions) were applied to assess the statistical significance of models. Reference Paquola, Park, Royer, Wang and Benkarim32
Sensitivity analysis
We utilised seven methods to assess the stability of the current results, including different parcellation atlases; global amplitude effects; individual differences in blood oxygen level-dependent (BOLD) signal intensity; potential impact of symptoms and interaction effects between disease duration and symptoms interaction effects between disease duration and chlorpromazine equivalent; and the potential impact of varying age distribution. Under different constraints, we reconstructed the regional ageing trajectories and re-quantified the correlation with the sensorimotor–association axis. For details, see Supplementary Methods.
Results
Sample characteristics
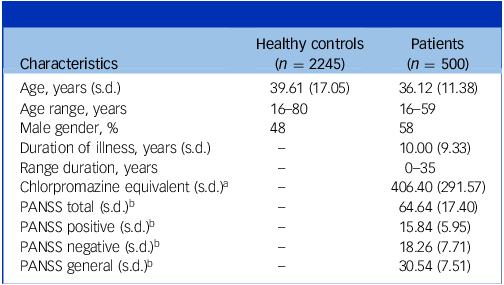
Due to insufficient data quality, 108 healthy controls and 46 patients with schizophrenia were excluded from the analysis; further details are available in the supplementary material. The final data included 2245 healthy controls and 500 patients with schizophrenia. Demographic and clinical characteristics are provided in Table 1.
Demographic characteristics

Table 1 Long description
A table comparing demographic and clinical characteristics of healthy controls and patients with schizophrenia. The table has 2 rows and 10 columns. The columns are Characteristics, Healthy controls (n = 2245), and Patients (n = 500). The rows are Age, years (s.d.), Age range, years, Male gender, percent, Duration of illness, years (s.d.), Range duration, years, Chlorpromazine equivalent (s.d.), PANSS total (s.d.), PANSS positive (s.d.), PANSS negative (s.d.), and PANSS general (s.d.). Row 1: Characteristics, Healthy controls (n = 2245), Patients (n = 500). Row 2: Age, years (s.d.), 39.61 (17.05), 36.12 (11.38). Row 3: Age range, years, 16-80, 16-59. Row 4: Male gender, percent, 48, 58. Row 5: Duration of illness, years (s.d.), -, 10.00 (9.33). Row 6: Range duration, years, -, 0-35. Row 7: Chlorpromazine equivalent (s.d.), -, 406.40 (291.57). Row 8: PANSS total (s.d.), -, 64.64 (17.40). Row 9: PANSS positive (s.d.), -, 15.84 (5.95). Row 10: PANSS negative (s.d.), -, 18.26 (7.71). Row 11: PANSS general (s.d.), -, 30.54 (7.51).
a Chlorpromazine equivalent information for 334 patients is available.
b Positive and Negative Syndrome Scale (PANSS) scores for 457 patients are available.
Ageing effect of intrinsic fMRI activity varies across the cortex
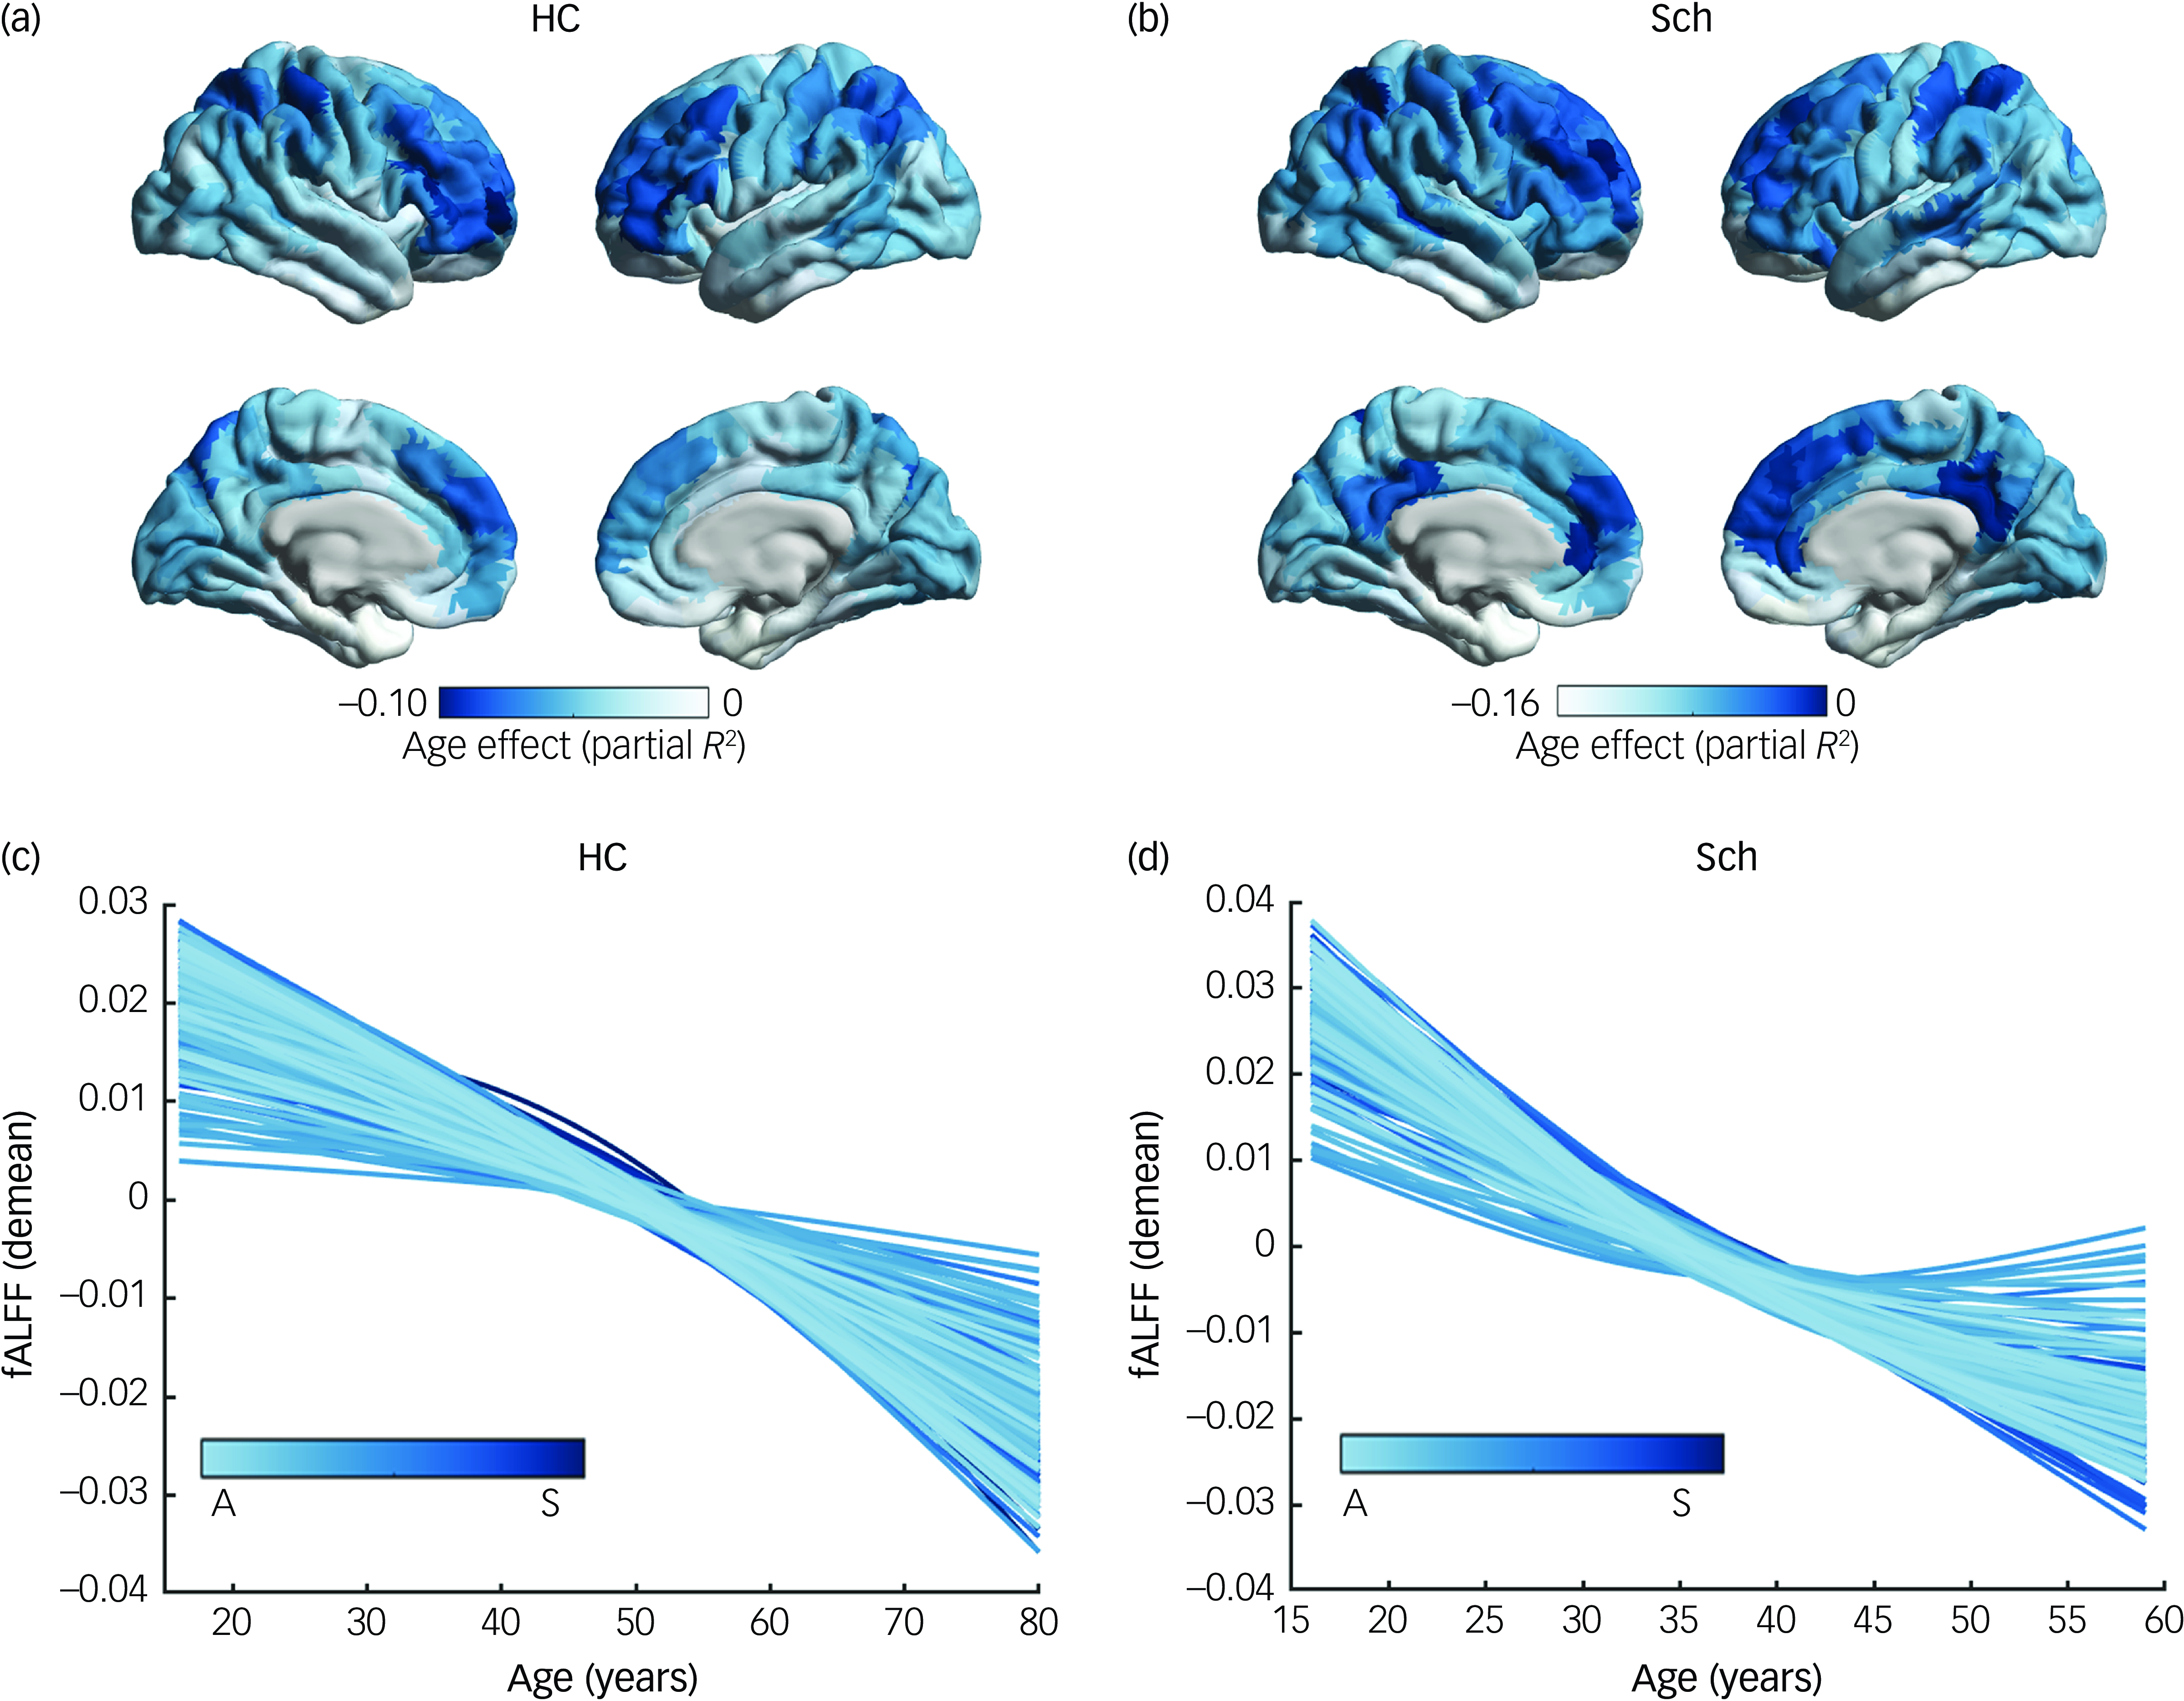
In both controls and patient groups, the age effect varied across the cortex (Fig. 1 and Supplementary Figs 2–5). Prefrontal regions exhibited stronger age effects, while sensorimotor areas demonstrated weaker age effects. Significant age-related alterations in fALFF were observed across nearly all cortical regions within the ageing range. In controls, fALFF followed a non-linear age trajectory – initially showing a slow decrease, which transitioned into a steeper decline with advancing age. In contrast, patients exhibited an earlier and more pronounced decline during adulthood.
Age effects (partial R 2 ) across cortical regions in (a) healthy controls (HC) and (b) subjects with schizophrenia (Sch). Intrinsic functional magnetic resonance imaging activity trajectories (zero-centred) of the left hemisphere of the brain in (c) healthy controls and (d) subjects with schizophrenia. The left hemisphere of the brain is divided according to the Schaefer-400 atlas; trajectories are coloured along the sensorimotor–association (S–A) cortical axis. Demean, the curves are zero-centred; fALFF, fractional amplitude of low-frequency fluctuations.

Ageing variability is patterned along the sensorimotor–association axis
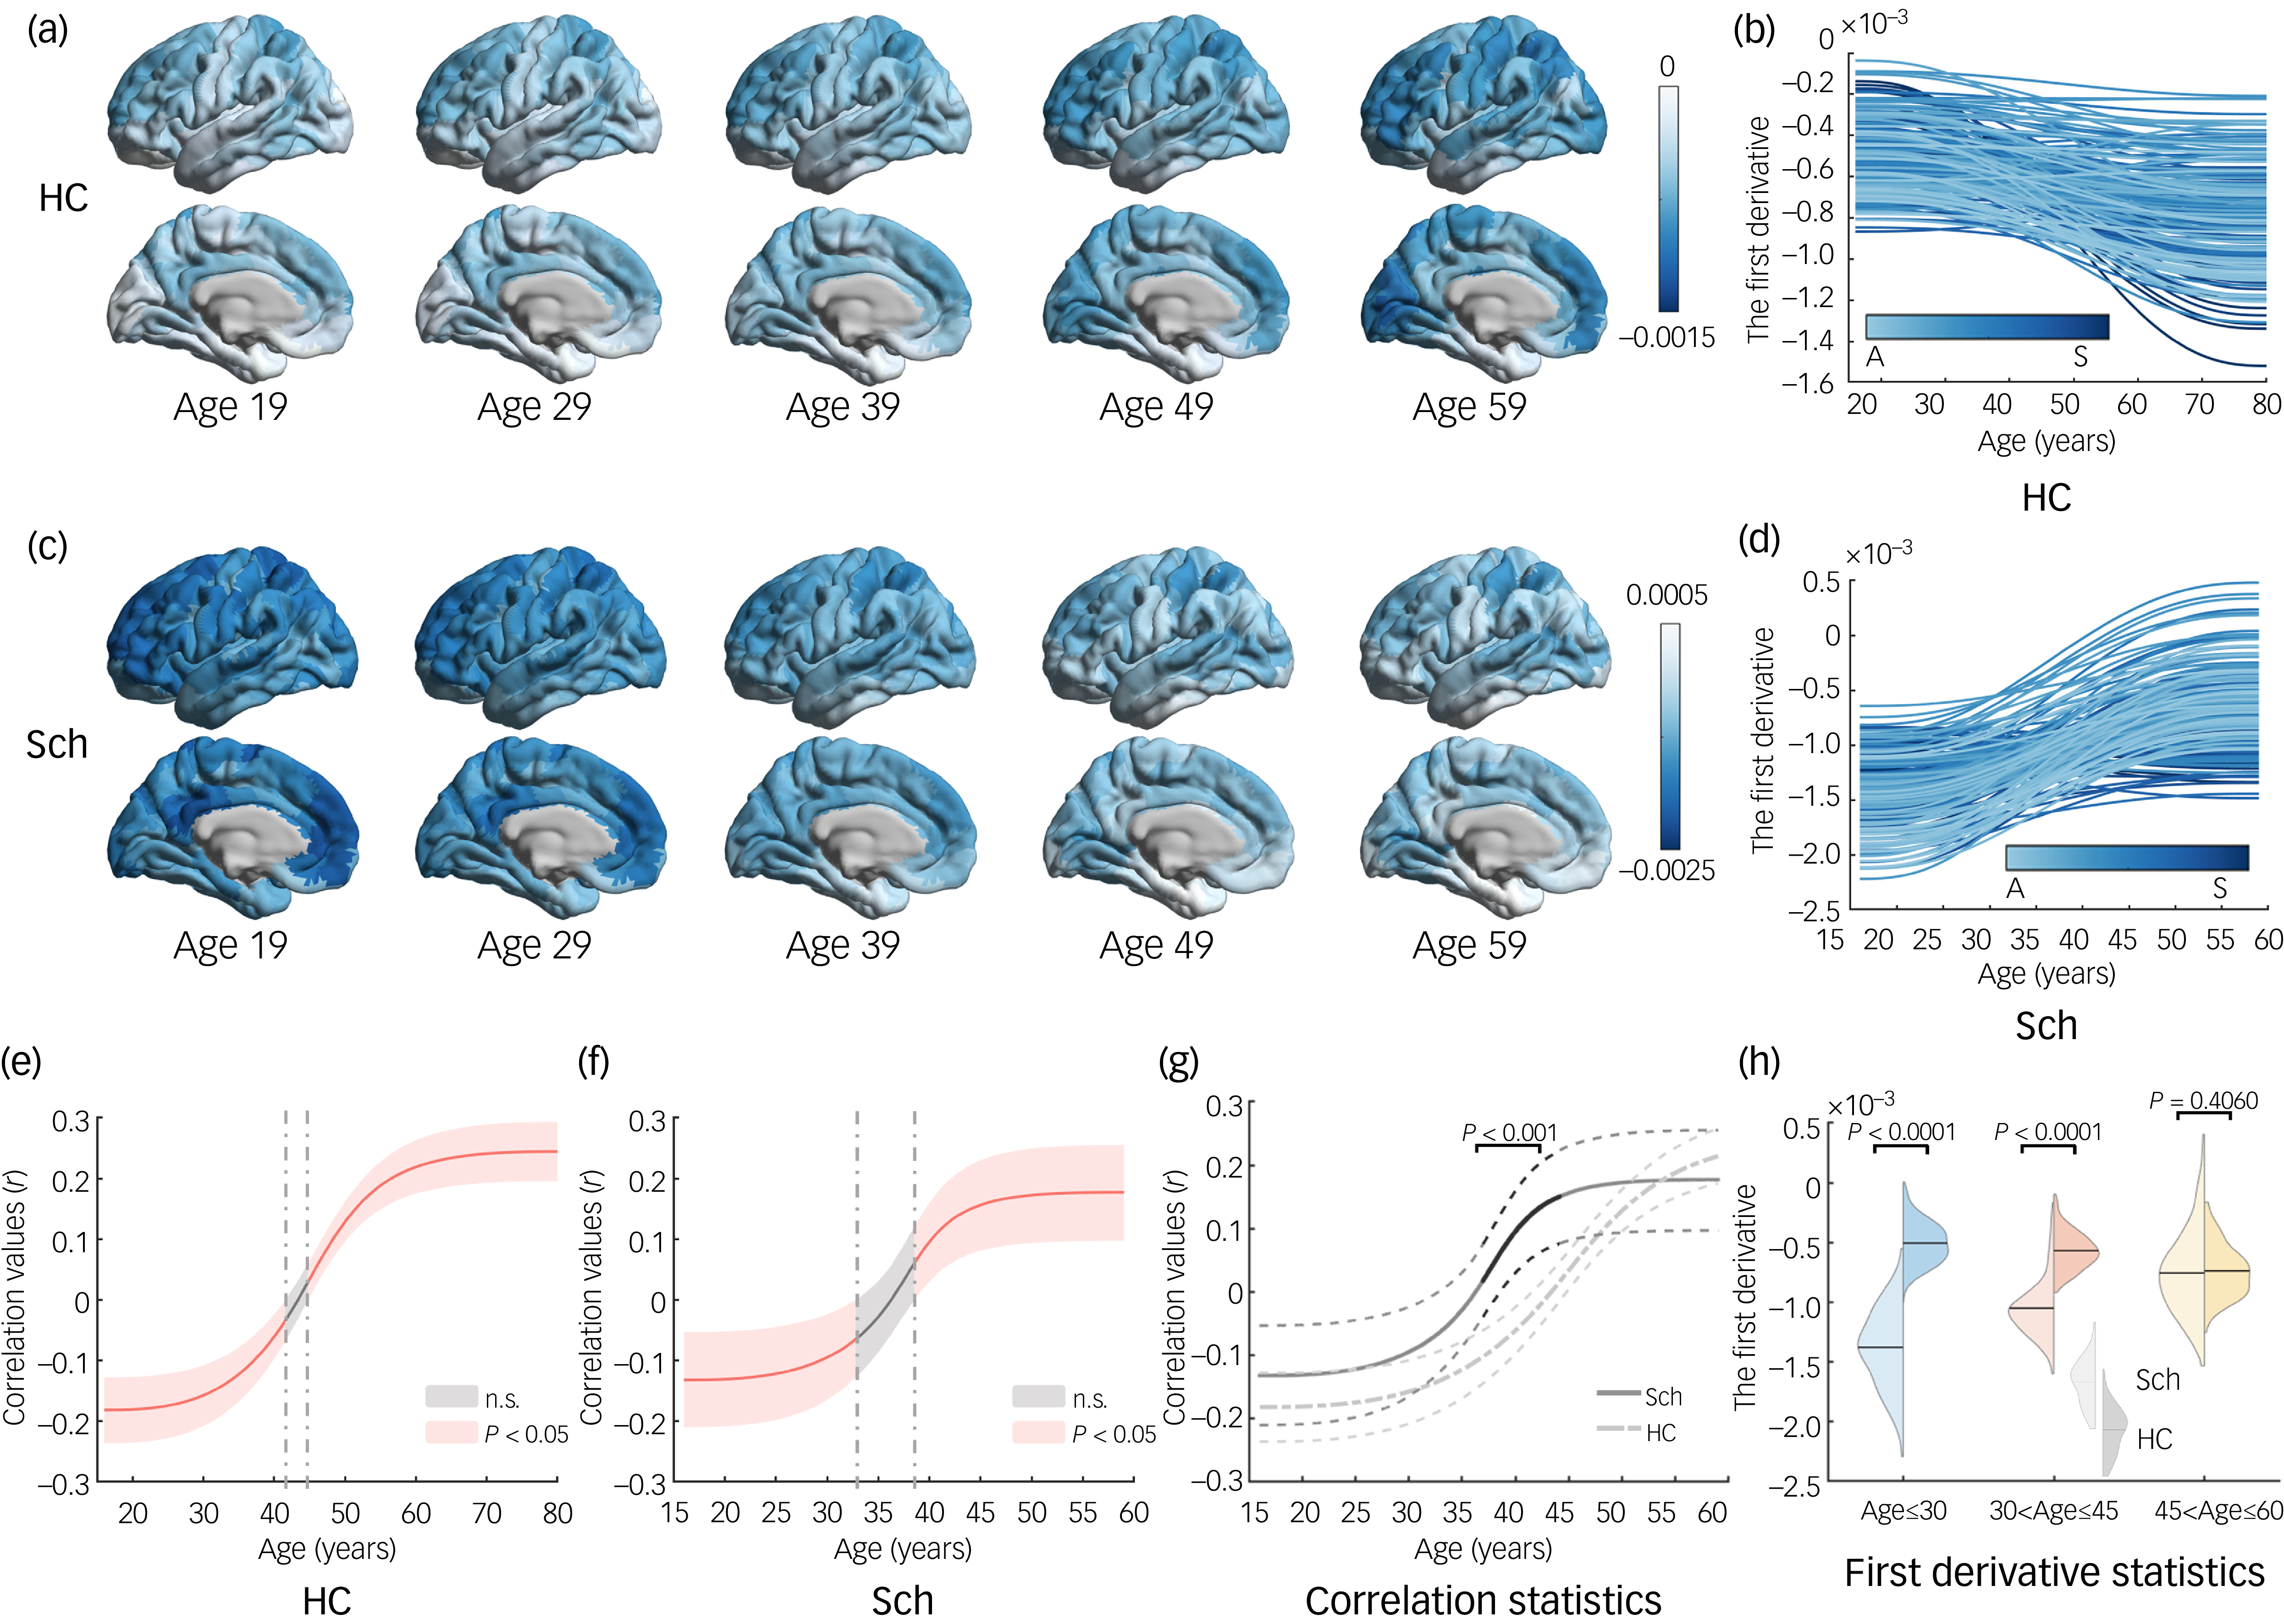
Spatiotemporal variability associated with ageing is illustrated in Fig. 2. A biphasic relationship was observed between fALFF decline and the sensorimotor–association axis in controls (Fig. 2b,e), characterised by an early transmodal association cortex-predominant decline (negative correlation) and followed by a later sensorimotor cortex-predominant phase (positive correlation). In individuals with schizophrenia (Fig. 2d,f) this transition occurred earlier and early decline was more pronounced, particularly in transmodal association regions. As ageing progressed, the rate of decline slowed in the transmodal association cortex but accelerated in primary sensory regions (Fig. 2c). Notably, the correlation differed significantly in the 36- to 48-year age range (Fig. 2g). The data were further divided into three age periods, and regional-level values were averaged for each period. In adolescence, patients showed a significantly steeper slope across the entire cortex (Fig. 2h; P < 0.0001).
(a,c) age-specific first derivative maps visualised on the cortical surface at age 29–59 years for (a) healthy controls (HC) and (c) subjects with scizophrenia (Sch); (b,d) age-specific first derivative trajectories of the left hemisphere from (b) HC and (d) Sch; trajectories are coloured along the sensorimotor–association (S–A) cortical axis; (a) and (c) represent the results of (b) and (d), respectively, at specific age ranges; (e,f) ageing change in intrinsic functional magnetic resonance imaging activity aligns with the S–A axis in both the (e) HC and (f) Sch groups; the line represents age-specific correlation values between regional first derivation and S–A axis ranks; the median correlation value, which was obtained by sampling and recalculating correlations, is represented by the red line, with the 95% credible interval around this value; (g) median correlation value and 95% credible interval in the HC and Sch groups; the red-shaded area represents the significant difference (P < 0.001) of correlations in Sch compared with HC; (h) the difference between HC and Sch across three distinct age ranges; within each age range, the slopes were averaged across brain regions and the average values of the slopes of the two groups were compared for the same timespan. n.s., no statistically significant difference.

Schizophrenia disease progress along the sensorimotor–association axis
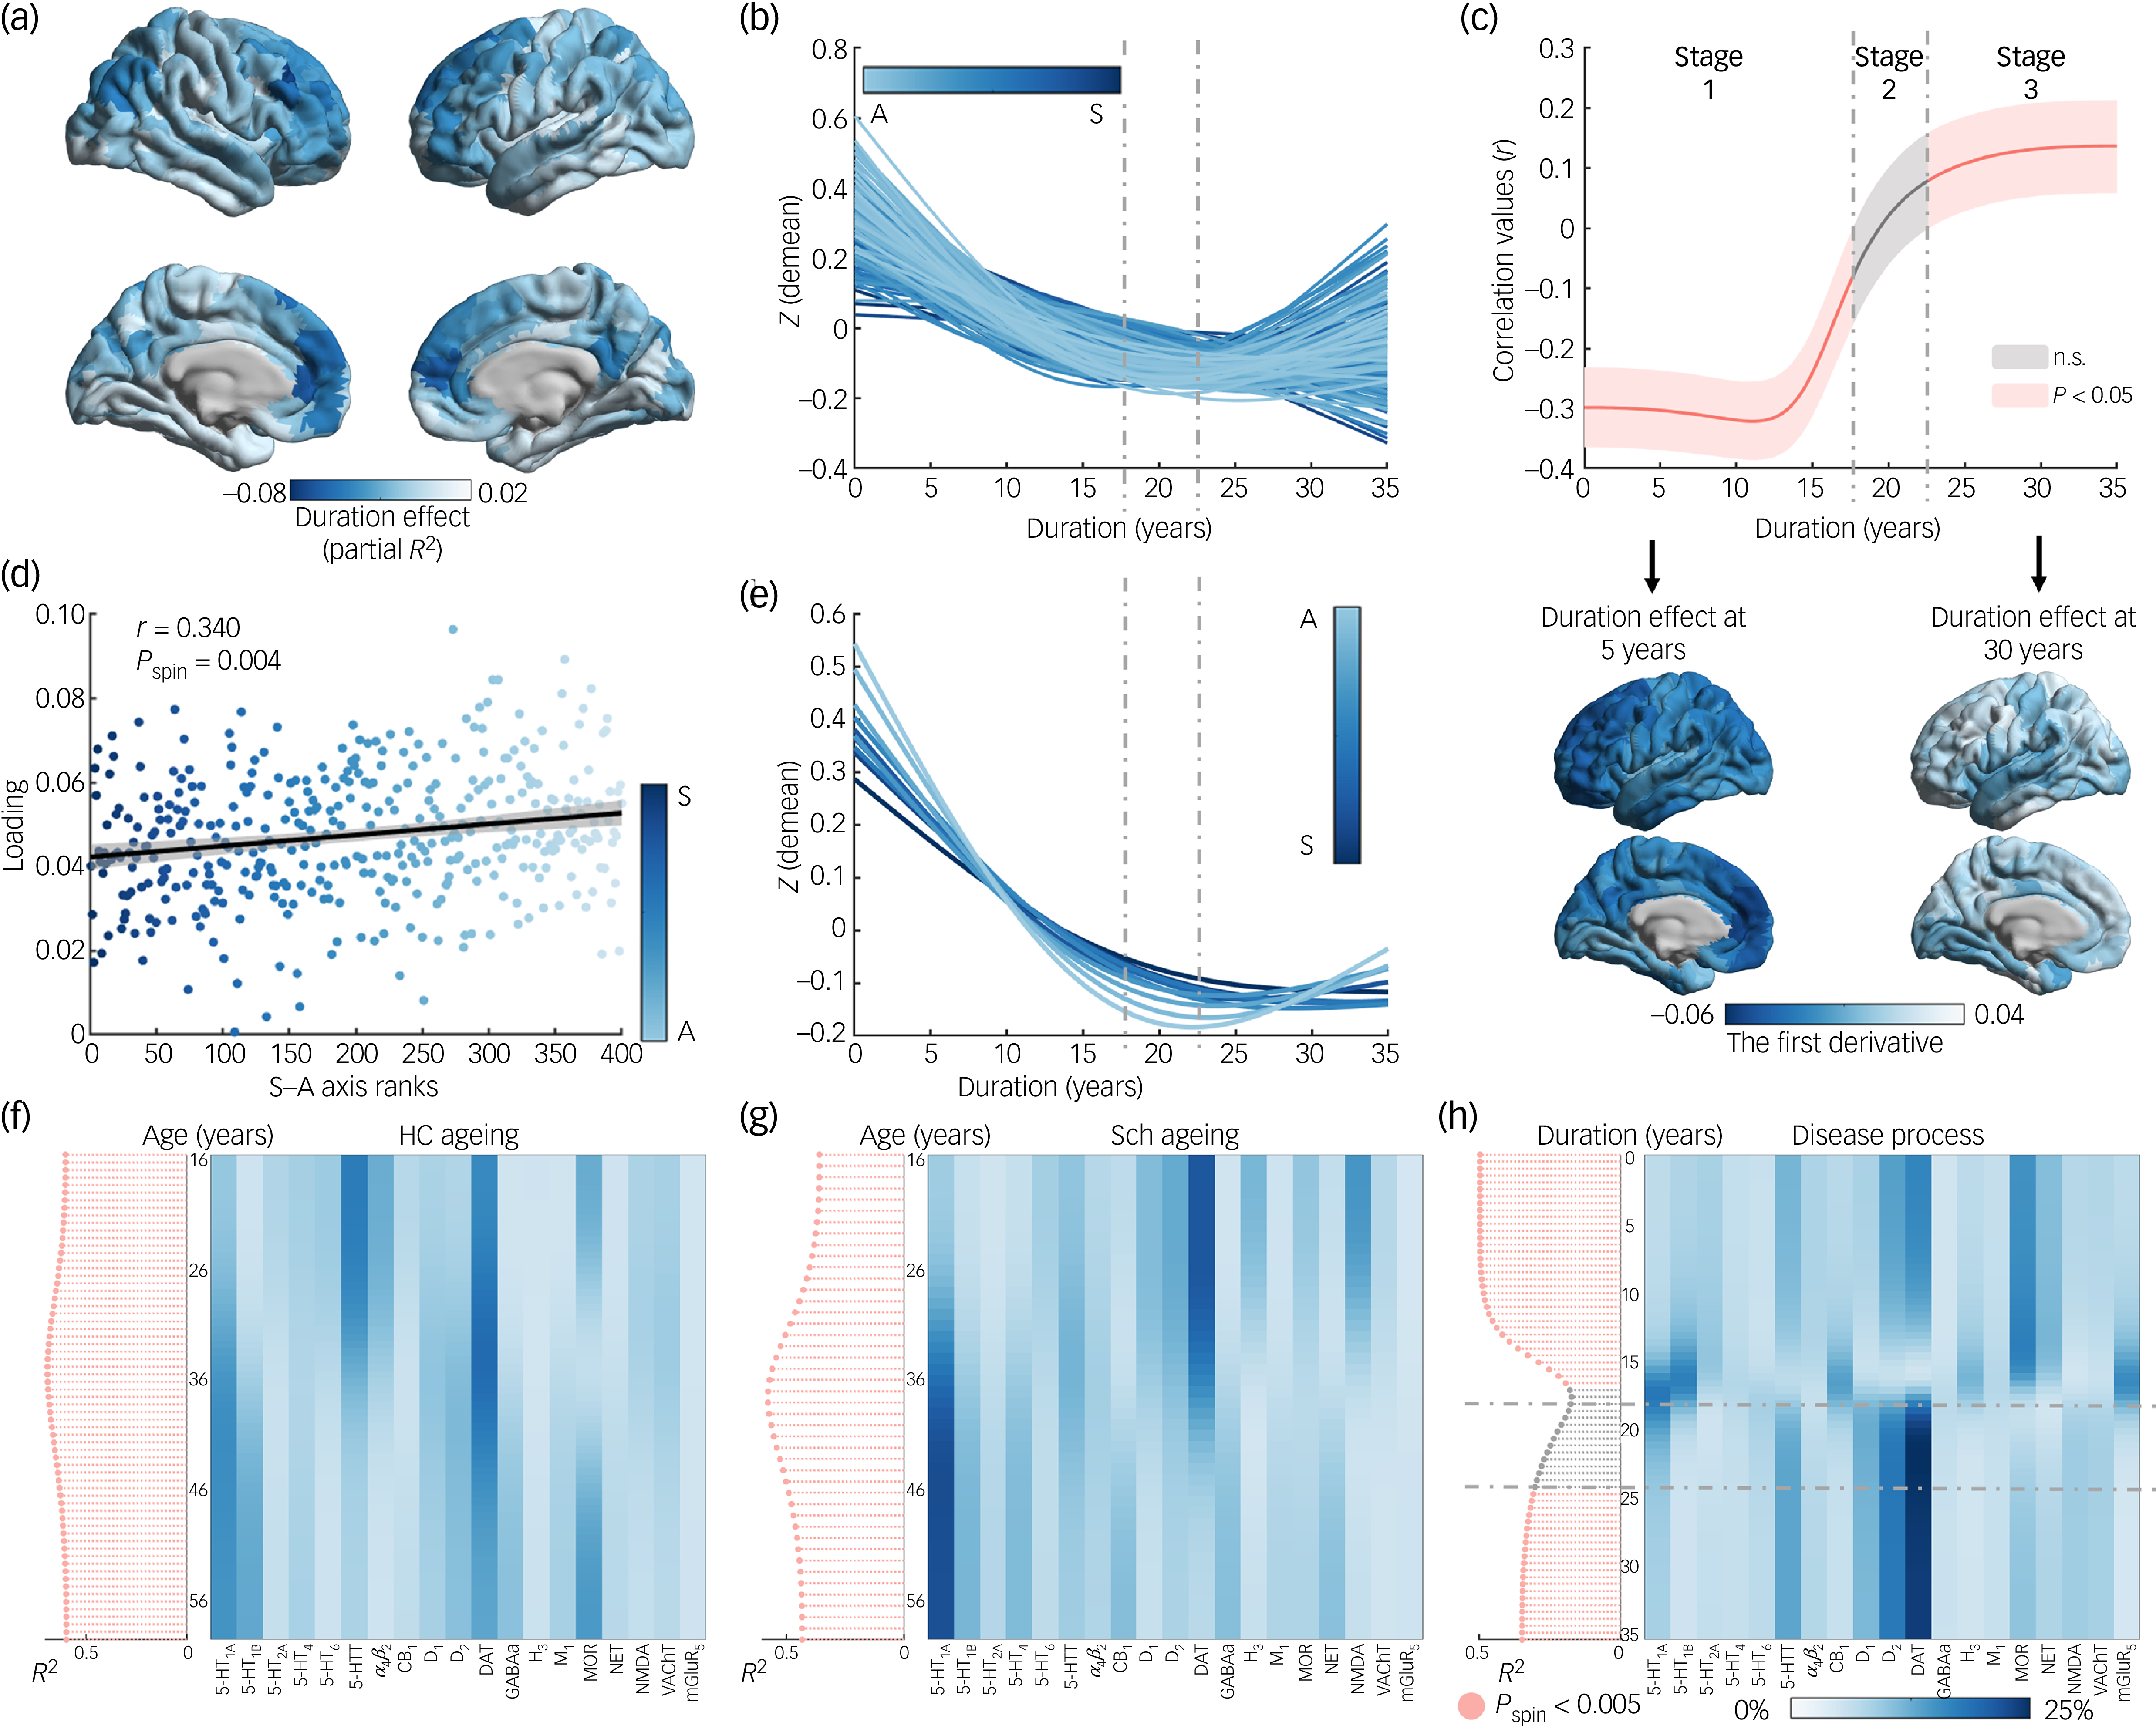
Deviation from the normative range was modelled as a function of disease duration in the patient group, with age effects controlled for (Fig. 3a,b and Supplementary Figs 2–5). Duration effects varied across cortical regions, with the strongest effects occurring in transmodal association cortices (Fig. 3a). To characterise the temporal heterogeneity of cortical activity deviation, illness duration was divided into three stages based on the relationship between deviation change rate and the sensorimotor–association axis. In stage 1 (short-duration stage), rapid increases in deviation were predominantly observed in transmodal association areas, especially the prefrontal cortex (Fig. 3c and Supplementary Table 9). In stage 2 (moderate-duration stage), this spatial pattern showed minimal correlation with the sensorimotor–association axis and was thus defined as a transitional stage. In stage 3 (long-duration stage), a distinct pattern emerged: deviation in primary sensory areas, such as the visual cortex, continued to increase while deviation in transmodal association regions began to decrease. Additionally, the first principal component of disease trajectories was significantly correlated with the sensorimotor–association axis (Fig. 3d). After dividing cortical regions into ten areas along the sensorimotor–association axis, we further visualised how the disease progress trajectory evolved from the sensorimotor to the association end of the sensorimotor–association axis (Fig. 3e and Supplementary Figs 7 and 8).
(a) the duration effect (partial R 2) across cortical regions in patients; (b) intrinsic functional magnetic resonance imaging (fMRI) activity trajectories (zero-centred) in subjects; the left hemisphere of the brain is divided according to the Schaefer-400 atlas; trajectories are coloured along the sensorimotor–association (S–A) cortical axis; (c) magnitude of ageing deviation changes with the S–A axis; the median correlation value, which was obtained by sampling and recalculating correlations, is represented by the red line, with the 95% credible interval around this value; duration-specific first derivative maps are visualised on the cortical surface at 5 and 30 years; (d) across the cortex, principal loadings are strongly related to S–A axis ranks (linear association shown with 95% confidence interval; (r = 0.340, P spin = 0.004); trajectories are coloured along the S–A axis; (e) intrinsic fMRI activity trajectories (zero-centred) in subjects; the whole brain is divided into ten regions by the S–A axis; trajectories are coloured along the S–A cortical axis; (f,g) dominance analysis between neurotransmitter maps and first derivative maps from age-specific models in (f) HC and (g) Sch; (h) dominance analysis between neurotransmitter maps and first derivative maps from duration-specific models; the significance of each model was assessed through the use of the spin-test, and a needle plot was used to display partial R 2 values along with their significance levels (red, significant; grey, non-significant; P spin < 0.005); the grey dashed lines represent borders between the stages defined, based on the correlation results shown in (c). Demean, the curves are zero-centred; n.s., no statistically significant difference; P spin, P-value obtained from the spin test; HC, healthy controls; Sch, individuals with schizophrenia; 5HT1A, 5-hydroxytryptamine 1A receptor; 5HT1B, 5-hydroxytryptamine 1B receptor; 5HT2A, 5-hydroxytryptamine 2A receptor; 5HT4, 5-hydroxytryptamine 4 receptor; 5HT6, 5-hydroxytryptamine 6 receptor; 5HTT, 5-hydroxytryptamine transporter; α4β2, nicotinic acetylcholine receptor; CB1, cannabinoid receptor type 1; D1, dopamine D1, receptor; D2, dopamine D2, receptor; DAT, dopamine transporter; GABAa, gamma-aminobutyric acid type A receptor; H3, histamine H3; receptor; M1, muscarinic acetylcholine receptor M1; MOR, mu opioid receptor; NET, norepinephrine transporter; NMDA, N-methyl-D-aspartate receptor; VAChT, vesicular acetylcholine transporter; mGluR5, metabotropic glutamate receptor subtype 5.

Fig. 3 Long description
Panel A: Four 3D brain models show the duration effect (partial R squared) across cortical regions in patients, with color gradients indicating varying effects. Panel B: A line graph displays intrinsic functional magnetic resonance imaging (fMRI) activity trajectories (zero-centred) in subjects over a duration of 35 years, with trajectories colored along the sensorimotor-association (SA) cortical axis. Panel C: A line graph shows the magnitude of ageing deviation changes with the SA axis, with the median correlation value represented by a red line and the 95% credible interval around this value. Duration-specific first derivative maps are visualized on the cortical surface at 5 and 30 years. Panel D: A scatter plot illustrates the relationship between principal loadings and SA axis ranks across the cortex, with a linear association shown and trajectories colored along the SA axis. Panel E: A line graph presents intrinsic fMRI activity trajectories (zero-centred) in subjects, with the whole brain divided into ten regions by the SA axis and trajectories colored along the SA cortical axis. Panel F: A heatmap shows dominance analysis between neurotransmitter maps and first derivative maps from age-specific models in healthy controls. Panel G: A heatmap displays dominance analysis between neurotransmitter maps and first derivative maps from age-specific models in individuals with schizophrenia. Panel H: A heatmap illustrates dominance analysis between neurotransmitter maps and first derivative maps from duration-specific models, with the significance of each model assessed through the spin-test and partial R squared values displayed along with their significance levels.
When symptom (total, positive, negative or general Positive and Negative Syndrome Scale (PANSS) scores) severity or chlorpromazine equivalent was included as a covariate in the model, illness duration-related patterns remained consistent (Supplementary Figs 9–11) and no significant effects of symptom severity or medicine were observed. We tested for duration-by-gender, duration-by-symptom and duration-by-medicine (chlorpromazine equivalent) interactions, and found no significant effects (P FDR > 0.05 for all interactions). These results suggest that deviation from the normative range was not significantly modulated by either gender, symptom severity or medication dosage.
Mapping neurotransmitters and transporters to first derivative
In the controls (Fig. 3f and Supplementary Fig. 12), the dopamine transporter (DAT) consistently exerted a strong influence on the ageing trajectory slope, particularly during mid-adulthood. The serotonin transporter (5-HTT) demonstrated stronger effects earlier in adulthood, while 5-HT1A, 5-HT1B and the mu-opioid receptor (MOR) gradually became more influential later in life. In patients (Fig. 3g), DAT and 5-HT1A exhibited earlier and stronger contributions than in controls. During stage 1 of disease duration (Fig. 3h), multiple neurotransmitters, including 5-HTT, D2, DAT and MOR, significantly influenced the slope of the disease progress trajectory. In stage 3 of duration, the effects were predominantly driven by DAT and D2.
Sensitivity analysis
The potential influence of brain atlases, inter-individual differences and inter-scanner differences in global and region levels, and symptom-related factors, were examined. None of these factors had a significant impact on the stability of the findings (Supplementary Figs 6–9, 11, 13 and 14). In each of sensitivity analyses, region-specific schizophrenia disease progress trajectories were consistent with the primary analysis. Importantly, disease duration effect did not exhibit interactions with either gender, clinical symptoms or chlorpromazine equivalent. The correlation between the first principal component (the spatial axis) of disease progress trajectories and the sensorimotor–association axis was significantly greater than that with either anatomical (z = 2.3290, P = 0.0199), functional (z = 3.1894, P = 0.0014) or evolutionary hierarchy (z = 3.3808, P = 0.0007), indicating that the sensorimotor–association axis effectively captured the spatiotemporal variability of disease progression. All duration-resolved analysis confirmed a strong correlation between the sensorimotor–association axis and the rate of change in schizophrenia disease progress trajectories, characterised by rapid decline in transmodal association cortical regions. These analyses confirmed that the findings are robust and reproducible.
Discussion
By modelling the ageing trajectories of intrinsic brain activity, we found that subjects with schizophrenia exhibited markedly accelerated functional decline compared with healthy controls, while the ageing process remained spatially organised along the sensorimotor–association axis. Importantly, our findings further revealed two distinct stages of spatiotemporal variability within the disease process of schizophrenia. During the short-duration stage (stage 1), transmodal association cortices showed the most rapid deviations from the normative ageing pattern; however, during the long-duration stage (stage 3), this accelerated decline became more prominent in primary sensory and motor regions. These findings provide direct support for the view of schizophrenia as a disorder of accelerated ageing, Reference Schnack, van Haren, Nieuwenhuis, Hulshoff Pol, Cahn and Kahn33 and further highlight its complexity: the shift in cortical ageing patterns reflects dynamic changes in the rate of decline across different cortical hierarchies over time. Additionally, DAT and 5-HT1A showed earlier, stronger associations with ageing slopes in schizophrenia. These findings hold potential clinical significance – identifying brain regions at risk of accelerated ageing in both healthy controls and schizophrenia sujects, and implementing appropriate intervention strategies – may help mitigate brain function impairments associated with ageing.
Typical ageing progresses with asynchronous decline in higher-order and primary cortices, highlighting region-specific modulation of neuroplasticity. Reference Sydnor, Larsen, Seidlitz, Adebimpe, Alexander-Bloch and Bassett9,Reference Gawryluk, Cybulska-Klosowicz, Charzynska, Zakrzewska, Sobolewska and Kossut34,Reference Fjell, Westlye, Amlien, Espeseth, Reinvang and Raz35 In the current study, we further identified an earlier phase of accelerated decline in transmodal association cortical activity, followed by a later acceleration in primary cortical regions. The spatial variability of cortical activity decline rates continues to align along the sensorimotor–association axis, suggesting that the hierarchical axis of neuroplasticity may persist throughout the lifespan. The development of cortical microstructure and functional connectivity was organised by the sensorimotor–association axis, strengthening hierarchical topography Reference Sydnor, Larsen, Seidlitz, Adebimpe, Alexander-Bloch and Bassett9 which may, in turn, drive ageing to follow this hierarchy.
Accelerated ageing in schizophrenia is well documented. Reference Schnack, van Haren, Nieuwenhuis, Hulshoff Pol, Cahn and Kahn33 The spatiotemporal variability of cortical activity decline in schizophrenia continues to follow the sensorimotor–association framework, but shifts earlier from a pattern dominated by transmodal association cortices to one dominated by primary cortices. This supports the accelerated brain ageing hypothesis in schizophrenia and suggests a persistent cumulative effect throughout the disease process. Reference Elliott1,Reference Schnack, van Haren, Nieuwenhuis, Hulshoff Pol, Cahn and Kahn33 In patients with schizophrenia, accelerated ageing is observed in transmodal association cortices during early adulthood. However, the rate of decline in these regions slows with advancing age, consistent with previous findings on structural alterations. Reference Berthet, Haatveit, Kjelkenes, Worker, Kia and Wolfers36 In contrast, primary cortices demonstrate persistently elevated ageing rates across the lifespan, with more pronounced deviations in longer disease durations. This pattern is further confirmed by our disease progression model, in which prolonged illness is associated with increasing abnormality in primary sensory regions. These findings highlight a spatiotemporally dynamic reorganisation of cortical ageing in schizophrenia. Importantly, they underscore the critical vulnerability of primary sensory cortices in the later course of the illness. Understanding these differential trajectories may offer insight into the biological underpinnings of functional decline and potential windows for intervention.
Regional differences in ageing characteristics can be explained by the asynchronous patterns of ageing deviations along the sensorimotor–association axis in the progression of schizophrenia. The trajectory of disease-related ageing deviations develops continuously along the cortical hierarchical structure of the brain on this axis, which can be viewed as a framework for disease progression. This emphasises the role of the sensorimotor–association axis as the dominant spatial feature axis for ageing and disease effects, where spatial variability in the brain may arise partly from temporal ageing variability. The ageing disparity between the brains of patients with schizophrenia and those of age-matched healthy controls changes as the disease progresses. Reference Tian, Cropley, Maier, Lautenschlager, Breakspear and Zalesky37 A longitudinal study has shown that the accelerated ageing of grey matter, as observed in schizophrenia, is not constant but occurs more rapidly in the early stages of the disorder. Reference Schnack, van Haren, Nieuwenhuis, Hulshoff Pol, Cahn and Kahn33 Our findings support this perspective, demonstrating that, during the short-duration stage, patients exhibit a stable and rapid cortical activity decline, with the rate of decline distributed along the sensorimotor–association axis. Brain regions closer to the transmodal association cortex end deviate from the normative range more rapidly, especially in the prefrontal cortex, potentially representing a direct manifestation of disease effects in ageing. Hence, one main outcome of hierarchical ageing might be the rapid conclusion of the ageing phase, dominated by transmodal association cortices with a consequent dysfunction of these regions. Reference Menon, Palaniyappan and Supekar38 Existing studies have linked the decline in fMRI fluctuation amplitude to schizophrenia symptoms. Reference Fortier, Dumais, Boisvert, Zouaoui, Chung and Potvin16 Despite these associations, in the current study, incorporation of PANSS scores into the model did not affect the identified ageing characteristics associated with the disease, possibly because symptom manifestations may result from interactions across multiple brain regions or functional networks, Reference Jauhar, Johnstone and McKenna39 making it challenging to uncover a direct link between symptomatology and progress trajectories of ageing deviations when modelling is confined to single brain regions.
The disease progression model indicates that disease duration captures cumulative brain changes over time. Ageing deviations consistently unfold along the hierarchical axis of neuroplasticity. Although this non-invasive imaging study cannot establish a direct connection between these spatiotemporal variations and neuroplasticity, previous work suggests that the spatial variability of fMRI activity along the sensorimotor–association axis may arise from the hierarchical maturation of structural and chemical features that regulate plasticity. Reference Sydnor, Larsen, Seidlitz, Adebimpe, Alexander-Bloch and Bassett9 Biochemical changes associated with ageing in neural cells might lead to synaptic dysfunction, thereby affecting critical processes such as brain plasticity and learning. Reference Gawryluk, Cybulska-Klosowicz, Charzynska, Zakrzewska, Sobolewska and Kossut34 A growing body of evidence highlights the role of neurotransmitter systems, particularly dopamine and serotonin, in modulating neuroplasticity. Reference Lubec, Kalaba, Hussein, Feyissa, Kotob and Mahmmoud40–Reference Shi, Li, Todaro, Cao, Lynch and Detre42 The dopamine and serotonin, and mu-opioid receptor, systems contributed highly significantly to the fit of the disease duration–ageing deviation model. Moreover, the relationship between the dopamine and serotonin systems and the ageing trajectory slope appears earlier in schizophrenia. Supporting our proposed disease progression framework, accelerated brain ageing in schizophrenia may be linked to temporally asynchronous expression of these neurotransmitters. Longitudinal studies reveal that many patients with schizophrenia gradually improve in regard to cognition and behaviour with age; Reference Reynolds, Jeste, Sachdev and Blazer5,Reference Walker and Harrison43 this has been hypothesised to be associated with the activity of serotonin and dopamine. Reference Reynolds, Jeste, Sachdev and Blazer5 The finding that serotonin and dopamine contribute more strongly is consistent with this hypothesis, although causal links cannot be established from the current data. The premature involvement and stronger contribution of neurotransmitters may be associated with cortical activity changes along the sensorimotor–association axis in schizophrenia, thereby affecting cognition. The prominent role of the serotonin system in the short-duration stage may indicate a neurochemical window during which the serotonergic system exerts a greater influence on the brain’s typical ageing process. Future studies could further explore whether asynchronously targeting the dopamine and serotonin systems in treatment strategies could help restore more typical ageing patterns, either during the short-duration stage of the disease or in younger patients.
It is important to highlight the limitations and potential extensions of current work. First, while the current cross-sectional analysis controlled for individual differences in regional variability, whole-brain mean variability and symptom characteristics, longitudinal studies are necessary to reveal more convincingly how cortical structural features influence intrinsic activity over time, and to clarify the dynamic relationship between ageing and cortical activity in schizophrenia. Second, patient groups were not explicitly matched in terms of symptom severity or antipsychotic treatment. Although we explored the potential influence of symptoms using PANSS scores (positive, negative and general symptoms), future studies are needed to investigate more systematically how different symptom profiles may contribute to disease progression trajectories. Moreover, our analyses did not reveal a significant interaction between antipsychotic medication and illness duration within the disease progression model. It is important to note that complete medication information was available only for some participants. Therefore, more rigorous studies with comprehensive and standardised pharmacological data are needed to better clarify the potential effects of medication on the observed trajectories.
This study provides evidence for a hierarchical organisation of neuroplasticity changes during typical ageing and the disease progression of schizophrenia. In both groups, ageing rate variation aligns with the sensorimotor–association axis, showing asynchronous accelerated decline in transmodal and primary cortices. However, in schizophrenia, this shift occurs earlier along the hierarchy and is accompanied by globally faster cortical ageing, especially before the emergence of spatial reorganisation. The spatial pattern of disease progression remains organised along the sensorimotor–association axis, supporting the view that brain ageing is hierarchically structured but temporally altered in schizophrenia. Earlier and stronger associations between the dopamine/serotonin systems and ageing trajectories suggest a potential neurochemical basis for the atypical ageing pattern. This framework may inform future studies on cortical ageing, cognitive decline and schizophrenia symptoms. Identifying vulnerable stages and regions, and implementing timely interventions, are essential for reducing ageing-related brain dysfunction.
Supplementary material
The supplementary material is available online at https://doi.org/10.1192/bjp.2025.10364
Data availability
The Cambridge Centre for Ageing and Neuroscience data-set is available in data repository https://www.cam-can.com/index.php?content=dataset. The Centers of Biomedical Research Excellence (COBRE) data-set is available in data repository http://schizconnect.org/ . The Japanese Strategic Research Programme for the Promotion of Brain Science project data-set is available on the DecNef Project Brain Data Repository website (https://bicr-resource.atr.jp/decnefpro/). The Depression Imaging Research Consortium (DIRECT) data-set is available in data repository https://rfmri.org/REST-meta-MDD. Positron emission tomography data can be found in the open databases https://github.com/netneurolab/neuromaps and https://github.com/netneurolab/hansen_receptors. Study analyses additionally made use of publicly available cortical maps, including the Schaefer atlas (https://github.com/ThomasYeoLab/CBIG/tree/master/stable_projects/brain_parcellation/Schaefer2018_LocalGlobal), the sensorimotor–association axis, the anatomical hierarchy map, the functional hierarchy map and the evolutionary hierarchy map (downloaded from https://github.com/PennLINC/S-A_ArchetypalAxis). Data-sets from the Clinical Hospital of Chengdu Brain Science Institute and the University of Electronic Science and Technology of China are unsuitable for public deposition due to ethical restrictions and privacy regulation of participant data, but all data derivatives in the current study can be shared.
Acknowledgements
We thank members of the Cambridge Centre for Ageing Neuroscience data-set, the Center of Biomedical Research Excellence, the Japanese Strategic Research Programme for the Promotion of Brain Science project and DIRECT for collecting and sharing human functional magnetic resonance imaging (fMRI) data. A complete list of current and past members of DIRECT is available at https://rfmri.org/REST-meta-MDD and in the supplementary materials. The COBRE data were downloaded from the Collaborative Informatics and Neuroimaging Suite Data Exchange tool (http://schizconnect.org/), and data collection was performed at the Mind Research Network, funded by COBRE grant no. 5P20RR021938/P20GM103472 from the National Institutes of Health to Dr Vince Calhoun.
Author contributions
All authors had full access to all of data in the current study, and take responsibility for their integrity and the accuracy of data analysis. H.P., S.J. and C.L. contributed to study design, analyses and interpretation of the data, study supervision and critical revision of the manuscript for intellectual content. H.P. and S.J. contributed to drafting of the manuscript. H.P., S.J. and R.R.-L. contributed to revision of the manuscript and participated in related scientific discussions. C.H., H.L., Z.Y. and M.D. contributed to technical or material support. C.L. and D.Y. contributed to critical review of the manuscript for important intellectual content. C.L. contributed to supervision. The DIRECT Consortium provided some data on healthy controls.
Funding
This work was supported by National Key R&D Programme of China (no. 2024YFE0215100), the National Nature Science Foundation of China (nos 62201133, 62401124 and 82371560), the Project of Science and Technology Department of Sichuan Province (nos 2023NSFSC0037 and 22NSFSC0530) and the Fundamental Research Funds for the Central Universities (no. ZYGX2022YGRH017). This study was also supported by a grant from Chengdu Science and Technology Bureau (no. 2024-YF05-02056-SN), and from the CAMS Innovation Fund for Medical Sciences (CIFMS; no. 2019-I2M-5-039).
Declaration of interest
None.
Transparency declaration
The lead author and manuscript guarantor affirm that the manuscript is an honest, accurate and transparent account of the study being reported, that no important aspects of the study have been omitted and that any discrepancies from the study as planned (and, if relevant, registered) have been explained.
Analytic code availability
The preprocessing of fMRI data and calculation of fractional amplitude of low-frequency fluctuations were conducted using DPABI, version 8.2 (https://rfmri.org/DPABI) in MATLAB on a Linux system (CentOS 7). The data were harmonised using Combat code (https://github.com/Jfortin1/ComBatHarmonization) in MATLAB on a Windows system. The implementation of regional generalised additive model analysis is based on the mgcv package and open-source code (https://pennlinc.github.io/spatiotemp_dev_plasticity/), and codes are executed in R, version 4.3.1 on a Linux system (CentOS 7). The implementation of spatial autocorrelation-preserving permutation tests is based on the ENIGMA toolbox (https://enigma-toolbox.readthedocs.io/en/latest/) in MATLAB on a Windows system. The dominance analysis was implemented using custom code in MATLAB on a CentOS 7 system (https://github.com/HaonanPei-Study/Fronto-occipital-dyscommunication-associates-with-brain-hierarchy-in-schizophrenia/tree/main).




eLetters
No eLetters have been published for this article.