Plain language summary
The Antarctic region harbours the great ice sheets on Earth that are responsible for regulating the global radiative balance and the ocean levels and play an important role in marine biodiversity. In particular, the West Antarctic Ice Sheet (WAIS) has been recognized to be very sensitive to warmer periods, despite the impacts of other natural forcings such as El Niño. In the modern epoch, ground-based stations, atmospheric profile measurements and model-derived datasets have all provided evidence of a steep warming trend at the WAIS since the mid-twentieth century. Part of the dramatic environmental changes we observe at the WAIS (glacier retreats, increased ice flows and heatwaves) is associated with accelerated ocean evaporation and higher atmospheric water vapour transport. These conditions act as fuel for the development of atmospheric rivers that can have an impact at polar areas. Recurrent observations lead us to believe that atmospheric rivers endanger continental ice, sea ice and floating ice platforms. In this work, we report an important atmospheric river event that brought about a rapid increase in air temperature at the WAIS in the middle of winter, recorded by a remote automatic measurement platform Criosfera 1 located at 84°S latitude. The atmospheric band of water vapour and clouds brought warm air from the Pacific subtropics to the Antarctic continental ice surface at the WAIS, which drove air temperatures to reach 23°C over the course of a few days.
Introduction
At the beginning of winter 2022, the scientific community and the general public were caught off guard with the report of an impressive air temperature increase (by at least 32°C) above normal throughout much of the East Antarctic Ice Sheet's interior in March 2022 (Berkeley Earth 2022). Concordia and Vostok research stations recorded their highest temperatures for that month across their entire historical instrumental databases. The event was surprising due to the rarity of such a sudden and enormous temperature rise and its location. East Antarctica is considered to be a region with relatively high climatic stability, and cooling trends have been observed at coastal stations (Turner et al. Reference Turner, Marshall, Clem, Colwell, Phillips and Lu2019, Gutiérrez et al. Reference Gutiérrez, Jones, Narisma, Alves, Amjad, Gorodetskaya, Masson-Delmotte, Zhai, Pirani, Connors, Péan and Berger2021). This contrasts with West Antarctica, which has experienced multiple environmental changes from reduced sea ice to glacier retreat, as well as increasing continental ice flow down into the ocean and negative surface ice elevations and mass balances (Smith et al. Reference Smith, Fricker, Gardner, Medley, Nilsson and Paolo2020), in addition to an increasing frequency of summer melting days (Nicolas et al. Reference Nicolas, Vogelmann, Scott, Wilson, Cadeddu and Bromwich2017), among other indicators of instability. West Antarctica has been exhibiting a progressive inland change in air temperatures and in surface snow/ice, behaving in a highly sensitive manner to the El Niño Southern Oscillation (ENSO; Paolo et al. Reference Paolo, Padman, Fricker, Adusumilli, Howard and Siegfried2018), the Southern Annular Mode (SAM) and ocean warming (Liu et al. Reference Liu, Moore, Cheng, Gladstone, Bassis and Liu2015). The northern Antarctic Peninsula (AP) has also been impacted by heatwaves during recent years triggered by anomalous moisture and heat transport from the Pacific coupled with enhanced Föhn winds (Bozkurt et al. Reference Bozkurt, Rondanelli, Marin and Garreaud2018, González-Herrero et al. Reference González-Herrero, Barriopedro, Trigo, López-Bustins and Olivia2022). The surface melt generated during these events as well as ocean wave swells have been found to be responsible for the ice-shelf destabilization prior to major breakups and were attributed to events termed ‘atmospheric rivers’ (ARs; Wille et al. Reference Wille, Favier, Jourdain, Kittel, Turton and Agosta2022). ARs are narrow corridors of intense moisture and warm air transport from low to high latitudes characterized as short-term meteorological events having significant impacts on both precipitation and surface melt (Gorodetskaya et al. Reference Gorodetskaya, Tsukernik, Claes, Ralph, Neff and Van Lipzig2014, Terpstra et al. Reference Terpstra, Gorodetskaya and Sodemann2021, Wille et al. Reference Wille, Favier, Gorodetskaya, Agosta, Kittel and Beeman2021). They have been considered to greatly increase temperature and moisture in large regions of the troposphere of coastal Antarctica (Gorodetskaya et al. Reference Gorodetskaya, Silva, Schmithüsen and Hirasawa2020).
Recent satellite observations of surface ice-sheet melting together with synoptic-scale circulation analysis suggest that ARs, when established between the Southern Hemisphere extratropical region and the Maritime Antarctic, represent a key parameter leading to episodes of extreme air temperature, surface melt, sea-ice disintegration or large swells that destabilize the ice shelves of the AP (Wille et al. Reference Wille, Favier, Jourdain, Kittel, Turton and Agosta2022). It is estimated that nearly 90% of the poleward moisture transport may be delivered to Antarctica by ARs (Nash et al. Reference Nash, Waliser, Guan, Ye and Ralph2018).
Because of its relatively low elevation, its proximity to surrounding continental land masses and its history of collapses over geological time such as during previous interglacial periods (possibly in the Eemian; Hoffman et al. Reference Hoffman, Clark, Parnell and Feng2017) and during analogous periods of similar CO2 levels (such as the middle Pliocene; Yamane et al. Reference Yamane, Yokoyama, Abe-Ouchi, Obrochta, Saito, Moriwaki and Matsuzaki2015), the establishment of in situ meteorological and geophysical monitoring at the West Antarctic Ice Sheet (WAIS) has become a key issue for providing data that allow us to make reliable future climate and sea-level projections. In this context, the region enclosing the Ellsworth Mountains, Coats Land and Dronning Maud Land in the Weddell Sea and Indian Ocean sectors still has only limited long-term continuous climate monitoring. To cover part of that geographical gap, in January 2012 the Brazilian Antarctic Program launched an automatic and autonomous remote laboratory (Criosfera 1, Ellsworth Land; World Meteorological Organization code 89079) dedicated to atmospheric and snow-depth monitoring. Within the historical meteorological database developed so far, the 10 June 2022 extreme warm event was the strongest event recorded by Criosfera 1, affecting inland of West Antarctica and accompanying the East Antarctic episode of March 2022. In this work, we provide information on its origin, duration and characteristics.
Data and methods
Air temperature data
Meteorological data were provided by three research stations described below. First is Criosfera 1 remote laboratory (Brazil; 84°00′00″S; 79°29′39″W, elevation: 1200 m), an autonomous facility located approximately at the mid-point between the Ellsworth Mountains and the South Pole (600 km from the pole). It started operations in 2012 through the Brazilian Antarctic Program. At Criosfera 1, at 10 m aboveground the air temperature changes from -10°C in the summer to -50°C in the winter, reaching extremes of -4.5°C to -55.0°C, respectively. Wind intensity changes seasonally, reaching winter maxima of 25 m s−1 almost every year (https://www.criosfera1.com/). It is influenced by Antarctic Plateau katabatic winds and air mass advections from the Weddell Sea and Indian Ocean.
Second is Halley Station (UK; 75°34′05″S; 25°30′30″W, elevation: 130 m). It is located at Brunt Ice Shelf, which borders the Coats Land coast in the Weddell Sea sector of Antarctica. Halley Station is installed directly over the snow surface. Typical air temperatures at Halley Station rarely rise above 0°C, although temperatures of approximately -10°C are frequent on sunny summer days. Typical winter temperatures are < -20°C, with extreme low values near -55°C. At its location, ~1.2 m of snow accumulates each year.
Third is Marambio Station (Argentina; 64°14′27.65″S; 56°37′36.31″W, elevation: 196 m). It is installed over a rocky basement and is located in Marambio Island, Graham Land, AP. Marambio Station's location is characterized by a permafrost ecosystem. The temperature at Marambio Station varies between +10°C in summer to -30°C during winter. Wind speeds at Marambio Station may reach ~28 m s−1 during low synoptic systems advecting in the region, and the prevailing wind directions are south-west and north-west (González et al. Reference González, Toledano, Román, Mateos, Asmi and Rodriguez2020).
The in situ databases were compared with reanalysis data from NCEP/NCAR (Kalnay et al. Reference Kalnay, Kanamitsu, Kistler, Collins, Deaven and Gandin1996), ERA5 (Hersbach et al. Reference Hersbach, Bell, Berrisford, Hirahara, Horányi and Muñoz-Sabater2020) and JRA-55 (Kobayashi et al. Reference Kobayashi, Ota, Harada, Ebita, Moriya and Onoda2015). The complementary data used here are: 1) sea-ice variability from the National Snow and Ice Data Center (NSIDC) and 2) an air mass back-trajectory model, HYSPLIT/NOAA, which is a hybrid between the Lagrangian approach and the Eulerian methodology to compute air mass advections (Stein et al. Reference Stein, Draxler, Rolph, Stunder, Cohen and Ngan2015).
AR detection
Integrated water vapour (IWV) and integrated vapour transport (IVT) were computed for the period from 7 to 12 June 2022 using specific moisture, zonal and meridional winds and hourly pressure level data from the ERA5 reanalysis (Hersbach et al. Reference Hersbach, Bell, Berrisford, Hirahara, Horányi and Muñoz-Sabater2020), as in Gorodetskaya et al. (Reference Gorodetskaya, Silva, Schmithüsen and Hirasawa2020), from 1000 hPa (or from the surface for higher elevations) to 300 hPa as follows:
 $${\rm IWV} = {-}\displaystyle{1 \over {\rm g}}\mathop \smallint \nolimits_{1000{\rm \;hPa}}^{300{\rm \;hPa}} q( p ) {\rm d}p$$
and
 $${\rm IVT} = {-}\displaystyle{1 \over g}\mathop \smallint \nolimits_{1000{\rm \;hPa}}^{300{\rm \;hPa}} q( p ) V( p ) {\rm d}p$$
where q (kg/kg) is the specific humidity, p (hPa) is the atmospheric pressure, g (m/s2) is the gravity acceleration and  $V( p ) = \sqrt {u^2 + v^2} $, where u (m/s) is the zonal wind speed and v (m/s) is the meridional wind speed. In addition to ERA5, IWV and IVT were also calculated from the NCEP Climate Forecast System version 2 (CFSV2) reanalysis and the CFS reanalysis (CFSR). ARs were identified using the polar AR tracking algorithm of Wille et al. (Reference Wille, Favier, Gorodetskaya, Agosta, Kittel and Beeman2021), in which AR is detected if the meridional IVT component (vIVT) exceeds the 98th percentile computed for each month and grid box, and objects with IVT values above the threshold have an extension of at least 20° latitude.
Results
The 10 June extreme warm event
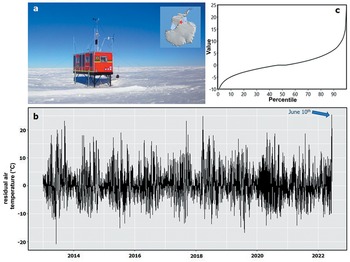
On 10 June 2022, Criosfera 1 (Fig. 1a) recorded the most intense warm event since the start of operations in 2012. This event showed an abrupt air temperature rise with respect to the 10 year median values for the corresponding days, defined by the daily median value of the 10 year historical database (2013–2022). By contrast to the event of 18–19 March (at the end of the summer) of 2022 in East Antarctica, the June heatwave occurred a few days before the winter season (Fig. 1b).
Criosfera 1 remote laboratory at West Antarctica. a. Measurement platform (photo credit: Heitor Evangelista) and its location (red star in the inset map). b. Near-surface air temperature anomalies (difference between daily air temperature and the median value of the corresponding day in the historical database from 1 January 2013 to 15 June 2022. c. Percentiles of temperature anomalies.

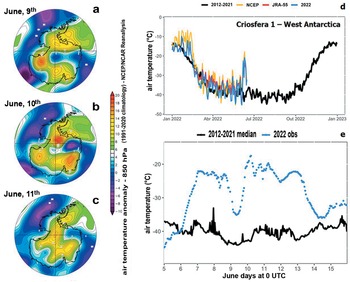
A comparison of the hourly resolved air temperature data for 2022 with median values from the Criosfera 1 database for 2013–2021 shows that air temperatures in mid-June (maximum of -17.4°C during the extreme warm event peak) reached values typically found in the summer as of February, contrasting to the historical June values of between -33°C and -45°C (mean of -40°C). Throughout our database, two other events were also detected: on 15 September 2013 (increase of 23.1°C) and on 23 March 2018 (increase of 24.6°C). Regarding the 10 June air temperature peak, both the NCEP and JRA-55 reanalyses have already captured the extreme warm event, although with overestimations of +2.86°C for NCEP and of +1.27°C for JRA-55 with respect the in situ measurement (Fig. 2d). The NCEP/NCAR air temperature map displayed a hotspot on 10 June over the location of the Criosfera 1 laboratory (Fig. 2b). The year 2022 has been warmer than the average for the 2012–2021 monitoring period at Criosfera 1, as shown in Fig. 2d.
a.–c. NCEP/NCAR reanalysis data of the air temperature anomaly at 850 hPa for 9–11 June 2022 relative to the 1991–2020 climatology. d. Median hourly air temperature for the period 2012–2021 and for 2022 time series together with modeled data from the NCEP/NCAR and JRA-55 reanalyses. e. Detail of before and after the 10 June air temperature change measured at the Criosfera 1 remote laboratory in the West Antarctic Ice Sheet.

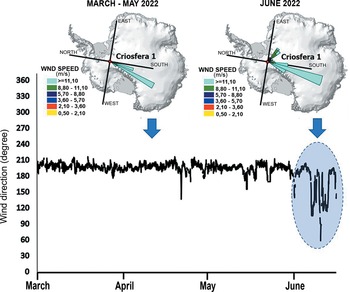
At the sampling site, the heatwave was also characterized by a significant change in the local wind direction with respect to the previous months. From the beginning of March to the end of May 2022, south-south-westerly katabatic winds originating from the Antarctic Plateau prevailed at Criosfera 1 (Fig. 3). The nature of the surface winds with high directional constancy indicates that they are dictated by the local orography (Parish & Bromwich Reference Parish and Bromwich2007). The month of June showed frequent occurrences of the north-easterly and south-easterly wind directions, indicating cyclonic origins.
Wind direction change at the Criosfera 1 remote laboratory in central West Antarctica during the extreme warm event in June 2022.

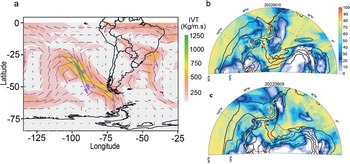
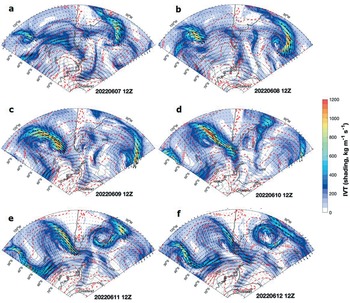
The anomalously warm period lasted from 10 June to early 13 June and was associated with continuous moisture and heat transport towards the AP/WAIS of varying intensity. These were favoured by a series of deep low-pressure systems forming west to south-west of the AP, with a stationary and extensive high-pressure ridge blocking anticyclone in the southern Atlantic (which later merged with another on the opposite side of the continent) at the eastern sector of the Weddell Sea. This atmospheric blocking promoted a strong and continuous northerly warm and moist air intrusion from the Pacific over the Weddell Sea and into the Criosfera 1 site, which, together with a strong cloud longwave forcing, promoted anomalously warm conditions (Fig. 4). Fig. 5 shows that two intense moisture intrusion events affected the Criosfera 1 site: the first medium-intensity moisture advection occurred on 7 June from the Atlantic Ocean via the Weddell Sea, while the second one on 10 June was stronger, originating from the Pacific Ocean and reaching the north-west AP (then continuing into the Atlantic and the Weddell Sea). Both moisture intrusions were identified as ARs according to Wille et al.'s (Reference Wille, Favier, Gorodetskaya, Agosta, Kittel and Beeman2021) vIVT-based algorithm applied to the ERA5 reanalysis.
a. Integrated vapour transport (IVT; kg m−1 s−1) on 10 June 2022, 12 UTC. b. Cloud longwave forcing at the surface (W m−2, shading) and maximum daily 2 m temperatures (°C, black contours) on 10 June 2022. c. The same for 9 June. Based on ERA5 reanalysis hourly data.

Integrated vapour transport (IVT; kg m−1 s−1, shading), 500 hPa geopotential height (m, black contours) and 1000–500 hPa thickness (dam, red dashed contours) for a. 7 June 2022, 12 UTC, b. 8 June 2022, 12 UTC, c. 9 June 2022, 12 UTC, d. 10 June 2022, 12 UTC, e. 11 June 2022, 12 UTC, and f. 12 June 2022, 12 UTC.

During the entire extreme warm event, increased lower-tropospheric heat content was observed over the AP and Weddell Sea, reaching the Criosfera 1 site (Fig. 5, dashed red contours showing the 500–1000 hPa thickness). While the trajectories show air parcels advecting from ocean sites, the moisture flux from the Atlantic was weaker and migrated along the edge of the sea ice.
Discussion
Two extreme warm events occurred in central Antarctica in the short period of only 3 months: one in mid-March in East Antarctica (this one could be classified as a heatwave as Dome C provides a 30 year database enabling the calculation of the 90th percentile of daily maximum air temperature as required to define a heatwave) and a second one at the beginning of winter (in West Antarctica, discussed in this paper). The causes of these abnormal events are under debate. Our knowledge so far points to different origins of the warm air incursions into Antarctica in 2022, expressed as heatwaves and extreme warm events, with one bringing warm air from the extratropical South American sector to West Antarctica and the other starting at southern Australian and heading towards East Antarctica. According to Liang et al. (Reference Liang, Wang, Luo and Yang2023), although anomalous warming periods associated with AR establishment are low-frequency events in all seasons, these events may give rise to intense sea-ice reduction at a rate of > 10%/day in marginal ice zones. However, the recent recurrent warm events at Criosfera 1 and Dome C in 2022, both in central Antarctica and characterized by rapid moisture and warm air incursions over the ice sheet, highlight that these impacts may extend to larger spatial scales, which points to the need for future inland meteorological monitoring.
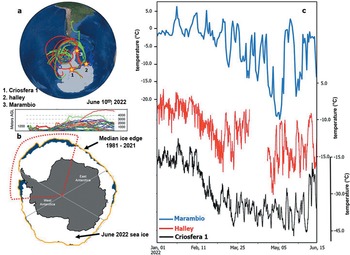
For the June 2022 event, we compared our air temperature data from Criosfera 1 to other meteorological stations affected by the same synoptic systems in the Maritime Antarctic region, located around the pathways of air masses at low levels. One is Marambio Station, located at the tip of the AP, and the other is Halley Station, south-east of the Filchner-Ronne Ice Shelf (Fig. 6a). In 2022, the three stations exhibited more variable seasonal temperature behaviour from autumn to winter. In contrast to the Criosfera 1 data, these two Antarctic stations recorded several important episodes of air temperature elevations in March, May and June (Fig. 6c). However, what stands out is the relative magnitude of air temperature increase in June at Criosfera 1, being far higher than other increases observed in previous months regarding summer-to-autumn events in 2022, making the 10 June temperature elevation at Criosfera 1 a unique event, while for the other Maritime Antarctic stations this date represented a significant increase but of a similar magnitude to previous such events within the same season. The sea-ice area from where most of the air masses have come during this period presented the smallest extension for June values since the beginning of the satellite era of monitoring in 1981, according to the NSIDC (Fig. 6b).
a. Air mass back-trajectories and altitudes for 10 June 2022, with the location of Criosfera 1 location as the end point: Hysplit/NOAA model (meteorological data used in the model were from the Global Data Assimilation System; GDAS). b. Sea-ice extent for June 2022 and contour for median 1981–2021 ice edge in Antarctica (dotted contour corresponds to the area of higher air mass incursions). c. Air temperatures during 1 January–15 June 2022 for three Antarctic stations: Marambio, Halley and Criosfera 1.

Conclusions and final remarks
In contrast to the Antarctic coast, where most scientific stations routinely operate, central Antarctica still has vast regions housing few year-round meteorological stations to provide near-real-time meteorological and synoptical data. The remote laboratory of Criosfera 1 at 84°S latitude was set up to improve our ability to gather such meteorological data and to reduce uncertainties in our understanding of the atmospheric dynamics of that region. One of its recent important records was the detection of an extreme warm event in June 2022 that occurred due to an AR originating from the subtropical Pacific Ocean and reached sites far from the Antarctic coast, where they have most often been reported to date. The event drove an air temperature elevation of 23°C in just a few days.
By comparing measured in situ meteorological data with reanalysis data, both NCEP and JRA-55 were able to capture the extreme warm event, presenting comparable air temperature elevations during the event.
The year 2022 (and now 2023) has been of special concern to climatologists and the cryosphere scientific community as two consecutive extreme warm events were recorded in the East and West Antarctic sectors and the sea ice reached historical low values (2.27 million km2 on 24 February 2022). These results highlight the importance of continental monitoring programmes through the efforts conducted under the Year of Polar Predictions (https://yopp.met.no/).
Data availability
The Criosfera 1 station database is available at https://www.criosfera1.com/. The Halley Station (UK) and Marambio Station (Argentina) database is available at https://legacy.bas.ac.uk/met/READER/surface/stationpt.html. Sea-ice variability data are made available by the National Snow and Ice Data Center (NSIDC) at https://nsidc.org/arcticseaicenews/antarctic-daily-image-update/.
Acknowledgements
This paper is a contribution to the Year of Polar Prediction in the Southern Hemisphere (YOPP-SH) international initiative and to the Scientific Committee on Antarctic Research (SCAR) scientific research programme AntClimNow. We thank PROANTAR and INCT-Criosfera/MCTI/CNPq (CNPq 465680/2014-3) for the scientific logistical support in Antarctica and the financial support. We acknowledge the grants under the FAPERJ Project E-26/201.218/2021, CNPq project 316162/2021-3 and Uerj/PROINFRA 2022 project for supporting the research. We thanks Climate Reanalyzer, Climate Change Institute, University of Maine (USA) for providing the air temperature map anomalies in Supplementary Information S3 (https://ClimateReanalyzer.org) and the British Antarctic Survey (BAS) meteorological service for providing data from Halley Station. IVG acknowledges the support provided by the strategic funding to CIIMAR (UIDB/04423/2020, UIDP/04423/2020), 2021.03140.CEECIND and Project ATLACE (CIRCNA/CAC/0273/2019) through national funds provided by FCT (Fundação para a Ciência e a Tecnologia). We thank the reviewer for their valuable inputs regarding the original manuscript.
Competing interests
The authors declare none.
Author contributions
All of the authors have made substantial contributions to this paper and approved the final version of the manuscript. The authors' contributions appear below: HE: conceptualization, methodology, validation, formal analysis, writing - original draft, review and editing; LFP: methodology, validation, formal analysis, writing, review and editing; IVG: methodology, validation, formal analysis, writing, review and editing; HRP: maintenance of meteorological sensors, loggers and renewable energy generators; FNV: meteorological data and transmissions; MS: electronic engineering and remote station operation; EAdS: use of the HYSPLIT/NOAA hybrid model for air mass back-trajectories during the warm event; CMCdB: computation of the meteorological database to model heatwave duration.