Implications
It is essential to provide dietary zinc efficiently to optimize animal's Zn status, limit environmental Zn load and to the sustainable use of resources. The provided data indicate that broilers have the capacity to use some native Zn, even bound to phytates, which limits the beneficial effect of phytase in improving Zn bioavailability. In contrast, piglets seem not able to efficiently use Zn bound to phytates. Therefore, low presence of the antagonist phytate or high phytase activity presents an appropriate way to maximize Zn bioavailability. As phytates did not interact with supplemental zinc in broilers and piglets, any protection of supplemental Zn from reacting with phytates seems not necessary. This also resulted in similar bioavailability of organic and inorganic Zn sources in broilers and piglets.
Introduction
As Zn is an essential element for the metabolism, a pollutant for the environment and a non-renewable resource, its use in animal nutrition needs to be efficient and sustainable.
Phytates are identified as the major dietary factor limiting Zn bioavailability in monogastrics, from the formation of insoluble phytate–zinc complexes. Their presence cannot be avoided in diets as phytate is the main storage form of phosphorus (P) in grains. Phosphorus in phytic form (PP) represents between 55% and 75% of total P in grains. Phytase hydrolyzes phytates and releases P to a similar extent in broilers and in piglets (Selle and Ravindran Reference Selle and Ravindran2007 and Reference Selle and Ravindran2008; Létourneau-Montminy et al., Reference Létourneau-Montminy, Narcy, Lescoat, Bernier, Magnin, Pomar, Nys, Sauvant and Jondreville2010 and Reference Létourneau-Montminy, Jondreville, Sauvant and Narcy2012). Phytase also releases Zn, but to a higher extent in piglets (Pallauf et al., Reference Pallauf, Höhler and Rimbach1992 and Reference Pallauf, Rimbach, Pippig, Schindler, Höhler and Most1994; Lei et al., Reference Lei, Ku, Miller, Ullrey and Yokoyama1993; Adeola, Reference Adeola1995; Jondreville et al., Reference Jondreville, Hayler and Feuerstein2005) than in broilers (Biehl et al., Reference Biehl, Baker and DeLuca1995; Mohanna and Nys, Reference Mohanna and Nys1999b; Jondreville et al., Reference Jondreville, Lescoat, Magnin, Feuerstein, Gruenberg and Nys2007). The dietary inclusion of 500 FTU of microbial phytase (Aspergillus niger) into a maize and soybean meal-based diet allows to replace the inclusion of about 30 (Jondreville et al., Reference Jondreville, Hayler and Feuerstein2005) and 5 mg (Jondreville et al., Reference Jondreville, Lescoat, Magnin, Feuerstein, Gruenberg and Nys2007) Zn from ZnSO4 in pigs and broilers, respectively. The vegetal phytase may also contribute to release Zn.
Native Zn concentrations in feedstuffs are generally too low to meet the Zn requirement. Inorganic (oxides, sulfates, etc.) and organic Zn sources (non-ionic chemical bond between the Zn atom and the ligand, mostly an amino acid or a peptide) are supplemented by the feed industry where the second one, supposed to protect Zn from any reaction with phytates, is associated with a higher bioavailability. Zinc bioavailability is defined as the maximal Zn utilization for the biological functions in the metabolism, based on the amount of ingested Zn (Windisch, Reference Windisch2001). First, Wedekind et al. (Reference Wedekind, Hortin and Baker1992) reported that Zn methionine was more available (+30%) than Zn sulfate to broilers. Later, two further broiler experiments reported an improved bioavailability for zinc with protein as ligand (Cao et al., Reference Cao, Henry, Davis, Cousins, Miles, Littell and Ammerman2002; Ao et al., Reference Ao, Pierce, Power, Dawson, Pescatore, Cantor and Ford2006), but a reduced bioavailability for zinc methionine (Cao et al., Reference Cao, Henry, Davis, Cousins, Miles, Littell and Ammerman2002). However, reviews on Zn availability for poultry and pigs estimated organic and inorganic Zn sources as equivalent (Ammerman et al., Reference Ammerman, Baker and Lewis1995; Jongbloed et al., Reference Jongbloed, Kemme, De Groote, Lippens and Meschy2002).
The aim of this meta-analysis on broiler and piglet experiments was to investigate (1) the bioavailability of inorganic and organic Zn sources; (2) the bioavailability of Zn in response to dietary phytate content and phytase activity in diets supplemented or not with ZnSO4.
Material and methods
Databases
Experiments on Zn availability in broilers and piglets published between 1986 and 2010 were selected. The experiments were selected separately for two purposes: the comparison of supplemented Zn sources (Analysis I); the investigation of Zn bioavailability in interaction with dietary phytate content and phytase activity (Analysis II). One broiler and one piglet database that included general information (e.g. author name, institute), qualitative data (e.g. diet type) and quantitative data (e.g. diet composition, dietary Zn concentration, Zn contents in animal tissues) were then created. To select relevant observations for the subsequent analyses, each selected publication, experiment and treatment was encoded (Sauvant et al., Reference Sauvant, Schmidely, Daudin and St-Pierre2008). The data represented the treatment mean value within an experiment.
Experimental treatments were included into the database for Analysis I, if (1) the dietary Zn content was maximum 90 mg Zn/kg diet for broilers and 155 mg Zn/kg diet for piglets meant to limit homeostatic Zn regulation, (2) inorganic and organic Zn sources were not fed in the same dietary treatment, (3) inorganic Zn and organic Zn treatments were iso-dosed, (4) the dietary phytase activity was <500 and 0 FTU/kg diet for broilers and piglets, respectively, (5) no other feed additive (e.g. amino acid, organic acid, etc.) than trace minerals were studied within an experiment. Regarding the second condition, the supplementation level for inorganic and organic Zn sources of the selected treatments were equal within experiments, otherwise factor disconnectedness may appear, which is not appropriate for a meta-analysis (Sauvant et al., Reference Sauvant, Schmidely, Daudin and St-Pierre2008). Two unpublished broiler studies (in 2002 and 2003) comparing the bioavailability of Zn sources were kindly provided by the company Pancosma (Geneva, Switzerland) and included into the broiler database. For Analysis II, experiments published by INRA between 1999 and 2010 were included into the database of each specie. All these studies dealt with the effect of phytase on Zn availability. To provide data having studied the effects of phytates and vegetal phytase on Zn bioavailability, two broiler experiments (Linares et al., Reference Linares, Broomhead, Guaiume, Ledoux, Veum and Raboy2007) conducted with a similar method than the ones conducted by INRA were also included.
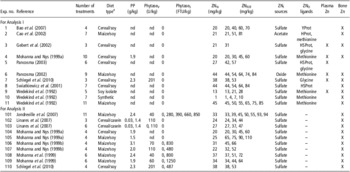
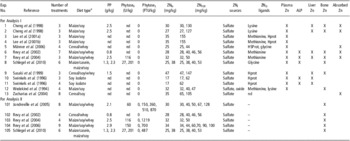
Eleven broiler experiments involving 72 treatments and 10 broiler experiments involving 62 treatments met the inclusion criteria for Analyses I and II, respectively. Thirteen piglet experiments involving 54 treatments and five piglet experiments involving 31 treatments met the inclusion criteria for Analyses I and II, respectively. Each experiment from the broiler and piglet database is summarized in Tables 1 and 2, respectively.
Summary of the broiler experiments

PP = phytic phosphorus; PhytaseV = vegetal phytase; PhytaseS = supplemented phytase; ZNN = native zinc; ZNTOT = total zinc; ZNI = inorganic zinc; ZNO = organic zinc; nd = not described; YProt = yeast protein; HProt = hydrolyzed protein; HSProt = hydrolyzed soybean meal protein.
aSoy = soybean meal; cereal = other cereals than maize.
Summary of the piglet experiments

PP = phytic phosphorus; PhytaseV = vegetal phytase; PhytaseS = supplemented phytase; ZNN = native zinc; ZNTOT = total zinc; ZNI = inorganic zinc; ZNO = organic zinc; ALP = alkaline phosphatase; nd = not described; HProt = hydrolyzed protein; HSProt = hydrolyzed soybean meal protein.
aSoy = soybean meal; cereal = other cereals than maize; Whey = whey powder.
Calculations and choice of the dependent and independent variables
The selected dependent variables were plasma Zn (expressed in mg/l) and bone Zn (expressed in mg/kg dry matter (DM)) in broilers and plasma Zn, plasma alkaline phosphatase activity (expressed in ALP, U/l), liver Zn (expressed in mg/kg DM), bone Zn and absorbed Zn (expressed in mg/kg diet ingested) in piglets. These dependent variables responded to increasing dietary Zn following graphical examination of the data using Minitab (2007). A bone ash content of 450 g/kg bone DM was defined when bone Zn content was expressed on ash basis.
Dietary independent variables were related to Zn, phytates and phytase activity. Zinc content (expressed in mg/kg diet) was identified as total Zn (ZNTOT) that was split into native Zn (ZNN), supplemented inorganic Zn (ZNI) and supplemented organic Zn (ZNO). In Analysis I, inorganic Zn was either zinc oxide or zinc sulfate with the exception of three broiler observations using zinc acetate. Organic Zn had either Zn with glycine, lysine, methionine, hydrolyzed soy protein (HSProt), hydrolyzed protein (HProt) or yeast protein (YProt) as ligand. In Analysis II, Zn was exclusively supplemented as ZnSO4. In case of missing information on ZNN, a value was estimated using the published feed ingredient formulation and the standard Zn contents of each ingredient from INRA-AFZ (Sauvant et al., Reference Sauvant, Perez and Tran2004). In case of missing information on supplemented Zn level, it was calculated as the difference between ZNTOT and ZNN. When dietary Zn was expressed in DM, a standard DM value of 890 g/kg diet was defined to calculate the value into fresh matter basis. Related to dietary phytates for Analysis II, PP content (expressed in g/kg diet), vegetal phytase activity (PhytaseV, expressed in U/kg diet), supplemented (microbial A. niger) phytase activity (PhytaseS, expressed in FTU/kg diet) and a new variable named ‘non-hydrolyzed phytic P’ content (PPNH, expressed in g/kg diet) were identified. The variable PPNH was introduced into the piglet model to take into account the phytate hydrolysis, mainly from dietary phytase. This approach was based on the hypothesis that the quantities of P and of Zn released are proportional when phytates are hydrolyzed. This proportionality was suggested by Jondreville et al. (Reference Jondreville, Hayler and Feuerstein2005) who have estimated that 1 additional g of digestible P equals 50 mg of Zn as sulfate in pigs. The new variable PPNH was calculated from the difference between dietary PP and the quantity of released P by phytase. The released P was estimated from an equation that predicts the amount of digestible P in the pig (Létourneau-Montminy et al., Reference Létourneau-Montminy, Jondreville, Sauvant and Narcy2012). The terms related to phytate hydrolysis (variables PP, PhytaseV and PhytaseS) were extracted from this equation to estimate the absorbed P from phytate hydrolysis, which was divided by 0.75 (Létourneau-Montminy et al., Reference Létourneau-Montminy, Narcy, Lescoat, Magnin, Bernier, Sauvant, Jondreville and Pomar2011), to represent the released P. PPNH is the difference between PP and this value: PPNH = PP−((0.208 × PP + 0.156 × PhytaseS−0.0132 × PhytaseS2 + 0.00298 × PhytaseS2 × PP + 0.052 × PhytaseV)/0.75), with PPNH and PP expressed as g/kg diet and PhytaseS and PhytaseV as 100 FTU/kg diet.
Mathematical model and statistical analysis
For Analysis I, the selected independent variables were ZNN, ZNI, ZNO and the dependent variables were plasma Zn, plasma ALP, liver Zn, bone Zn, absorbed Zn. For Analysis II, the selected independent variables were ZNN, ZNI, PPNH in pigs and ZNN, ZNI, PhytaseV and PhytaseS in broilers. The dependent variable was bone Zn. A graphical examination of the within- and between-experiment responses of each dependent variable to the main independent variables (ZNTOT and PPNH in pigs and ZNTOT in broilers) was also performed, as previously described by Sauvant et al. (Reference Sauvant, Schmidely, Daudin and St-Pierre2008). Through this examination, the data from Linares et al. (Reference Linares, Broomhead, Guaiume, Ledoux, Veum and Raboy2007) were excluded from the dataset, as the low PP treatments (0.03 g PP/kg diet) resulted in a maximized bone Zn content (plateau). This step made it possible to verify whether the relationship was the same within and between experiments and to choose the type of model to use. All statistical procedures were carried out using the GLM procedure of SYSTAT (2007). Descriptive statistics (mean and range of values) were generated for each variable. Pearson correlation matrices were calculated between ZNN and ZNI and between ZNN and ZNO (Analysis I), between ZNI and PhytaseV and ZNI and PhytaseS (broilers, Analysis II) and between ZNN and PPNH and ZNI and PPNH (piglets, Analysis II).
The following model was used to study the effect of supplemental inorganic or organic Zn sources on Zn status and on absorbed Zn in broilers and in piglets (Analysis I, equation (1)):
 $$ { {{Y}_{{\rm{uxyz}}}}\, = & \,a\, + \,{{a}_{\rm{u}}}\, + \,b\,\times \,{\rm{Z}}{{{\rm{N}}}_{{\rm{N}}{{\,}_{{\rm{ux}}}}}}\, + \,c\,\times \,{\rm{Z}}{{{\rm{N}}}_{{\rm{I}}{{\,}_{{\rm{uy}}}}}}\, + \,d\cr\times \,{\rm{Z}}{{{\rm{N}}}_{{\rm{O}}{{\,}_{{\rm{uz}}}}}}\, + \,c^{\prime}\,\times \,{\rm{ZN}}_{{{\rm{I}}{{\,}_{{\rm{uy}}}}}}^{{\rm{2}}} + \,d^{\prime}\,\times \,{\rm{ZN}}_{{{\rm{O}}{{\,}_{{\rm{uz}}}}}}^{{\rm{2}}} \, + \,bc\cr\times \,{\rm{Z}}{{{\rm{N}}}_{{\rm{N}}{{\,}_{{\rm{ux}}}}}}\,\times \,{\rm{Z}}{{{\rm{N}}}_{{\rm{I}}{{\,}_{{\rm{uy}}}}}}\, + \,bd\,\times \,{\rm{Z}}{{{\rm{N}}}_{{\rm{N}}{{\,}_{{\rm{ux}}}}}}\,\times \,{\rm{Z}}{{{\rm{N}}}_{{\rm{O}}{{\,}_{{\rm{uz}}}}}}\, + \,{{{\epsilon}}_{{\rm{uxyz}}}} $$
The model used to study the effect of Zn, phytates and phytases on Bone Zn content (Analysis II) was differentiated between animal species. As the new defined variable PPNH is based on pig data (Létourneau-Montminy et al., Reference Létourneau-Montminy, Jondreville, Sauvant and Narcy2012) and as the graphical examination of the broiler data did not indicate any clear sign that dietary PP content would affect the response of bone Zn, PPNH was only used in piglets. In addition, there was not enough intra-experimental variability for PP, ZNN and PhytaseV in the broiler database.
The following model was used to study the effect of dietary Zn and phytase on bone Zn content in broilers (Analysis II, equation (2)):
 $$ { {{Y}_{{\rm{uvy}}}}\, = & \,a\, + \,{{a}_{\rm{u}}}\, + \,c\,\times \,{\rm{Z}}{{{\rm{N}}}_{{{{\rm{I}}}_{{\rm{uy}}}}}}\, + \,c^{\prime}\,\times \,{\rm{ZN}}_{{{{{\rm{I}}}_{{\rm{uy}}}}}}^{{\rm{2}}} \, + \,f\cr\times \,{\rm{Phytas}}{{{\rm{e}}}_{{{{\rm{S}}}_{{\rm{uv}}}}}}\, + \,f{\rm{'}}\,\times \,{\rm{Phytase}}_{{{{{\rm{S}}}_{{\rm{uv}}}}}}^{{\rm{2}}} \, + \,cf\,\times \,{\rm{Z}}{{{\rm{N}}}_{{{{\rm{I}}}_{{\rm{uy}}}}}}\cr\times \,{\rm{Phytas}}{{{\rm{e}}}_{{{{\rm{S}}}_{{\rm{uv}}}}}}\, + \,{{{\epsilon}}_{{\rm{uvy}}}} $$
The following model was used to study the effect of dietary Zn, phytate and phytases on bone Zn content in piglets (Analysis II, equation (3)):
 $$ { {{Y}_{{\rm{uwxy}}}}\, = & \,a\, + \,{{a}_{\rm{u}}}\, + \,b\,\times \,{\rm{Z}}{{{\rm{N}}}_{{{{\rm{N}}}_{{\rm{ux}}}}}}\, + \,c\,\times \,{\rm{Z}}{{{\rm{N}}}_{{{{\rm{I}}}_{{\rm{uy}}}}}}\, + \,c{\rm{'}}\cr\times \,{\rm{ZN}}_{{{{{\rm{I}}}_{{\rm{uy}}}}}}^{{\rm{2}}} \, + \,g\,\times \,{\rm{P}}{{{\rm{P}}}_{{\rm{N}}{{{\rm{H}}}_{{\rm{uw}}}}}}\, + \,bg\,\times \,{\rm{Z}}{{{\rm{N}}}_{{{{\rm{N}}}_{{\rm{ux}}}}}}\cr\times \,{\rm{P}}{{{\rm{P}}}_{{\rm{N}}{{{\rm{H}}}_{{\rm{uw}}}}}}\, + \,cg\,\times \,{\rm{Z}}{{{\rm{N}}}_{{{{\rm{I}}}_{{\rm{uy}}}}}}\,\times \,{\rm{P}}{{{\rm{P}}}_{{\rm{N}}{{{\rm{H}}}_{{\rm{uw}}}}}}\, + \,{{{\epsilon}}_{{\rm{uwxy}}}} $$
In all three equations, Y uxyz,Y uvy and Y uwxy are the expected outcome for the dependent variable Y observed in experiment u with levels v, w, x, y and z of the independent variable PhytaseS, PPNH,, ZNN, ZNI and ZNO, respectively. a is the intercept, a u is the effect of the experiment u on the intercept a with the condition that the sum of each a u is equal to 0. b, c, d, f, g and c′, d′, f′ are the linear/quadratic coefficients of ZNN, ZNI, ZNO, PhytaseS, PPNH and ZNI2, ZNO2, PhytaseS2, respectively. Combined coefficients of variables are their interactions. ε uxyz, ε uwy and ε uwxy are the residual errors.
In Analysis I, three tests were run on each dependent variable to evaluate the difference between ZNI and ZNO by comparing the estimated coefficients for ZNIv. ZNO; ZNI2v. ZNO2 and ZNN × ZNIv. ZNN × ZNO. The relative bioavailability (RBV) from ZNO to ZNI was calculated from the ratio of the ZNO response slope to the ZNI response slope times 100. When ZNN × ZNI and ZNN × ZNO were significant, the RBV was calculated for several levels of ZNN.
In all three equations, the experiment was introduced in the model as fixed effect in order to ensure a proper prediction of coefficients of the model and an accurate description of the error of prediction (Sauvant et al., Reference Sauvant, Schmidely, Daudin and St-Pierre2008). Non-significant variables were sequentially removed from the model in order to simplify the final equation. The coefficient of determination (R 2) and the root mean square error (r.m.s.e.) of each generated equation were calculated between the predicted and observed value from each treatment. Differences between variables were considered significant, when P < 0.05 and as tendencial when P < 0.10. Graphical examinations were carried out at each stage of the meta-analysis process.
Results
Description of the databases
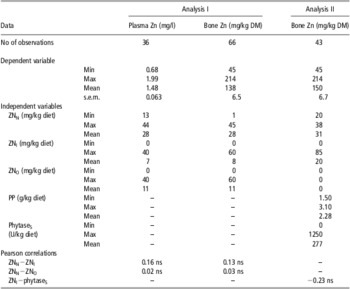
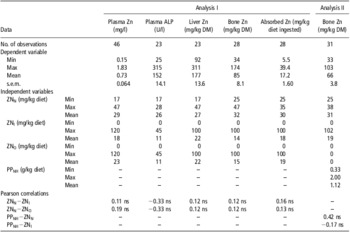
The broiler dataset (Table 1) included experiments based on synthetic, semi-synthetic, cereal/soybean meal- and maize/soybean meal-based diets with Zn contents ranging from 1 to 85 mg/kg and 20 to 110 mg/kg for Analysis I and II, respectively. The ZNO sources had synthetic amino acids as ligands in 72% of the observations in Analysis I. Broiler bone Zn responded quadratically to dietary Zn in the dataset for Analysis I (bone Zn (mg/kg DM) = −2.5 + 4.6 × Zn−0.028 × Zn2, R 2 = 0.95, r.m.s.e. = 12.4) and in the dataset for Analysis II (bone Zn (mg/kg DM) = −14.5 + 4.7 × Zn−0.026 × Zn2, R 2 = 0.92, r.m.s.e. = 13.7) indicating that the homeostatic counter regulation of Zn has started with the upper dietary Zn levels. The piglet dataset (Table 2) included experiments based on semi-synthetic, cereal/soybean meal and maize/soybean meal diets with Zn contents ranging from 17 to 155 mg/kg and 28 to 128 mg/kg for Analysis I and II, respectively. The ZNO sources had synthetic amino acid as ligands in 54% of the observations in Analysis I. Piglet bone Zn responded linearly to dietary Zn in the dataset for Analysis I (bone Zn (mg/kg DM) = 44.0 + 0.84 × Zn, R 2 = 0.97, r.m.s.e. = 9.7) and in the dataset for Analysis II (bone Zn (mg/kg DM) = 48.8 + 0.38 × Zn, R 2 = 0.29, r.m.s.e. = 19.3) indicating that the homeostatic counter regulation of Zn was negligeable. The descriptive statistics of the broiler and piglet data are presented in Tables 3 and 4, respectively. Some experiments did not report all dependent variables of interest; therefore, the number of observations across dependent variables was not constant. In Analysis I, Pearson correlations between ZNN and each of the supplemented Zn source were low and not significant (P > 0.10). In Analysis II, Pearson correlations between ZNI and PhytaseS in broilers and between PPNH, ZNN and ZNI in piglets were low and not significant (P > 0.10). Therefore, the effect of the dependent variables and their interactions could be adequately assessed from the different datasets to evaluate dietary Zn availability on broilers and piglets.
Descriptive statistics of the broiler variablesFootnote a

DM = dry matter; Min = minimum value; Max = maximum value; Mean = mean value; s.e.m. = standard error of the mean; ZNN = native zinc; ZNI = inorganic zinc; ZNO = organic zinc; PP = phytic phosphorus; PhytaseS = supplemented phytase.
ns: P > 0.10.
a Experiments 1 to 11 for Analysis I and experiments 101, 104 to 110 for Analysis II, described in Table 1.
Descriptive statistics of the piglet variablesFootnote a

ALP = alkaline phosphatase; DM = dry matter; Min = minimum value; Max = maximum value; Mean = mean value; s.e.m. = standard error of the mean; ZNN = native zinc; ZNI = inorganic zinc; ZNO = organic zinc; PPNH = non-hydrolyzed phytic phosphorus.
ns = P > 0.10.
a Data from experiments described in Table 2.
Bioavailability of zinc sources in broilers (Analysis I, equation (1))
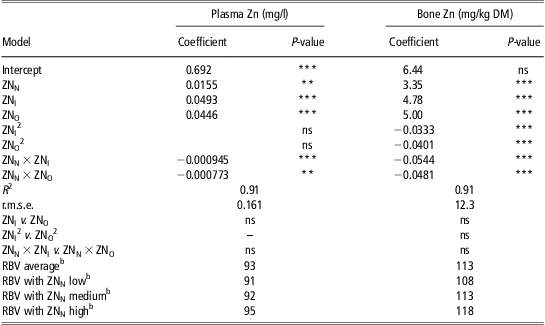
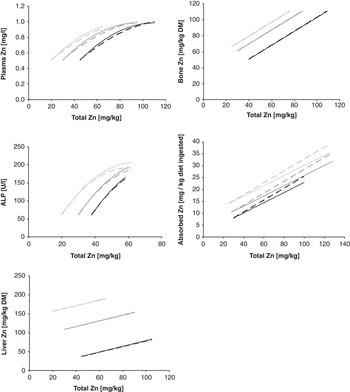
The estimated ZNN-, ZNI- and ZNO-dependent regressions for plasma Zn and bone Zn are presented in Table 5 and illustrated in Figure 1. Regression equations were calculated with an R 2 value of 0.91 for plasma Zn and bone Zn. The dependent variables increased linearly with increasing ZNN (P < 0.01). They also increased linearly with increasing ZNI and ZNO (P < 0.001), but in an extent that decreased as ZNN increased (interaction ZNN × ZNI and ZNN × ZNO, P < 0.01). In addition, bone Zn responded quadratically to ZNI and ZNO (P < 0.001). There was no difference (P > 0.10) between the coefficients for ZNI and ZNO in any of the dependent variables. As a consequence, the calculated bioavailability of ZNO relative to ZNI was very close to 100%, ranging between 93% and 113% depending on the used variable.
Adjusted dependent variable response to dietary zinc sources (mg/kg diet) in broilers (Analysis I)Footnote a
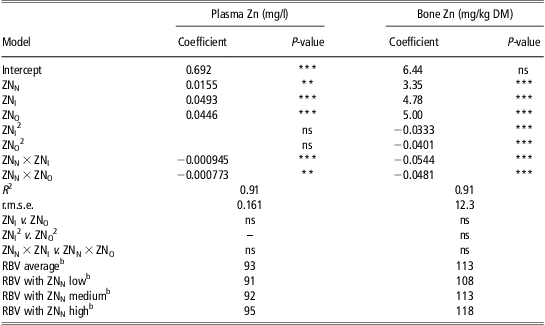
DM = dry matter; ZNN = native zinc; ZNI = inorganic zinc; ZNO = organic zinc; R 2 = coefficient of determination; r.m.s.e. = root mean square error; RBV = relative bioavailability.
*** P < 0.001; **P < 0.01; ns: P > 0.10.
a The model was based on equation (1). Data from experiment nos 1 to 11 are described in Table 1.
b Calculated RBV from ZNO to ZNI. The three defined ZNN levels for low, medium and high were 15, 30 and 40 mg/kg diet, respectively.
Response of plasma zinc (mg/l) and bone zinc (mg/kg dry matter) to total dietary zinc (mg/kg diet) in diets supplemented with inorganic (continuous curve) or with organic (dashed curve) sources in broilers (Analysis I)a,b. aData from experiment nos 1–11 described in Table 1. bZNI and ZNO were supplemented within their range of validity to a low (light gray), medium (gray) and high (black) level of ZNN. The three defined ZNN levels were 15, 30, 40 mg/kg for plasma Zn and bone Zn.

Bioavailability of zinc sources in piglets (Analysis I, equation (1))
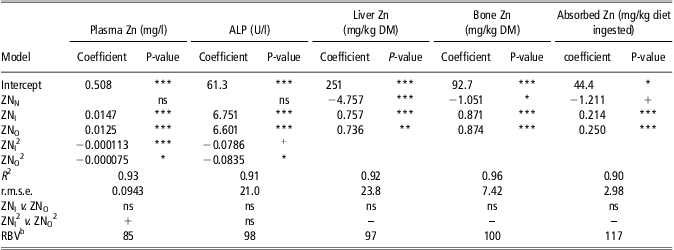
The estimated ZNN-, ZNI-, and ZNO-dependent regressions for plasma Zn, plasma ALP, liver Zn, bone Zn and absorbed Zn were calculated with R 2 values above 0.89 (Table 6 and Figure 2). An increase in ZNN did not improve the value of the dependent variables. It even reduced the response for absorbed Zn (P = 0.08), liver Zn (P < 0.001) and bone Zn (P < 0.05). The dependent variables responded linearly (absorbed Zn, plasma Zn, plasma ALP and bone Zn, P < 0.001 and liver Zn, P < 0.01) and quadratically (plasma Zn, P < 0.05 and plasma ALP, P < 0.10) with increasing supplemented Zn. No difference was calculated between coefficients for ZNI and ZNO (P > 0.05), except the coefficient for ZNO2, which was slightly inferior to the one for ZNI2 in plasma Zn (P < 0.10). As a consequence, the calculated bioavailability of ZNO relative to ZNI was very close to 100%, ranging between 85% and 117% for plasma Zn, plasma ALP, liver Zn, bone Zn and absorbed Zn.
Adjusted dependent variable response to dietary zinc sources (mg/kg diet) in piglets (Analysis I)Footnote a
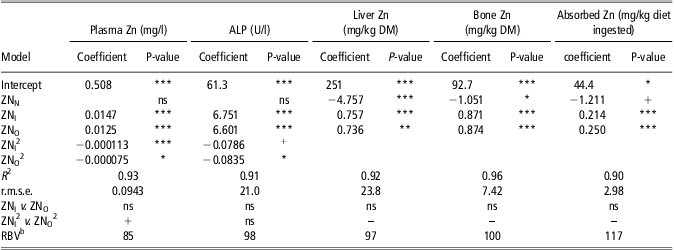
ALP = alkaline phosphatase; DM = dry matter; ZNN = native zinc; ZNI = inorganic zinc; ZNO = organic zinc; R 2 = coefficient of determination; r.m.s.e. = root mean square error; RBV = relative bioavailability.
*** P < 0.001; **P < 0.01; *P < 0.05; +P < 0.10; ns: P > 0.10.
a The model was based on equation (1). Data from experiment nos 1 to 13 are described in Table 2.
b Calculated RBV from ZNO to ZNI.
Response of plasma zinc (mg/l), plasma alkaline phosphatase (ALP) (U/l), liver zinc (mg/kg dry matter (DM)), bone zinc (mg/kg DM) and absorbed zinc (mg/kg ingested Zn) to total dietary zinc (mg/kg diet) in diets supplemented with inorganic (continuous curve) or with organic (dashed curve) sources in piglets (Analysis I)a,b. aData from experiment nos 1 to 13 described in Table 2. bZNI and ZNO were supplemented within their range of validity to either a low (light gray), medium (gray) and high (black) level of ZNN. The three defined ZNN levels were 25, 28, 30 mg/kg for absorbed Zn; 20, 30, 45 mg/kg for plasma Zn and liver Zn; 20, 30, 38 mg/kg for plasma ALP and 25, 30, 45 mg/kg for bone Zn.

Interaction between dietary phytase and zinc in broilers (Analysis II, equation (2))
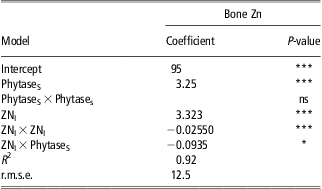
The graphical analysis of the broiler bone Zn response to the dietary Zn contents revealed a concordant curvilinear response between experiments (data not shown). As the data from Linares et al. (Reference Linares, Broomhead, Guaiume, Ledoux, Veum and Raboy2007) were discarded, there was no intra-experimental PP variability in any remaining experiment, which consequently excluded this variable from the model. The model included ZNI and PhytaseS as dependent variables to estimate bone Zn and revealed an R 2 value of 0.92 (Table 7). The improved bone Zn content originated from ZNI (linear and quadratic, P < 0.001) and from PhytaseS (linear, P < 0.001). In addition, the positive effect of ZNI on bone Zn was reduced as PhytaseS increased (interaction ZNI × PhytaseS, P < 0.05).
Bone zinc content (mg/kg DM) from broilers dependent from the dietary content of supplemented Zn (mg/kg diet) and supplemented phytases (100 FTU/kg diet; Analysis II)Footnote a
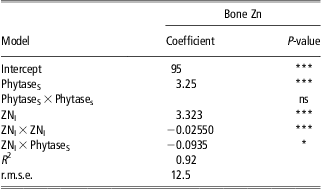
DM = dry matter; PhytaseS = supplemented phytase; ZNI = inorganic zinc; R 2 = coefficient of determination; r.m.s.e. = root mean square error.
*** P < 0.001; *P < 0.05; ns: P > 0.10.
a The model was based on equation (2). Data from experiment no. 101, 104 to 110 described in table 1.
Interaction between dietary phytates, phytase and zinc in piglets (Analysis II, equation (3))
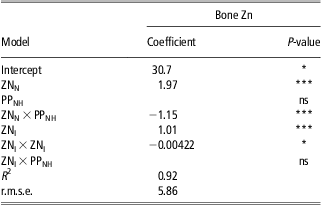
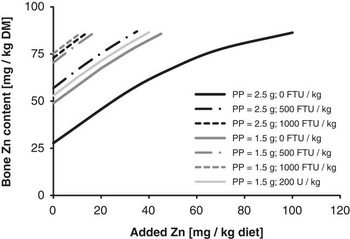
The graphical analysis of bone Zn response to dietary Zn revealed two distinct populations: one fed with high PP diets, without phytase supplementation and one fed with low PP diets or high PP diets, but including supplemented phytase (data not shown). The remaining PP after phytates hydrolysis from vegetal and supplemental phytase in the gut, represented by PPNH, made it possible to implement the inter-dependent variables PP, PhytaseV and PhytaseS into a single variable. The estimated ZNN, PPNH and ZNI dependent regression for bone Zn was calculated with an R 2 value of 0.92 (Table 8). The improved bone Zn content from ZNN (P < 0.001) was clearly reduced by the interaction with PPNH (ZNN × PPNH, P < 0.001). Bone Zn increased linearly (P < 0.001) and quadratically (P < 0.001) with dietary Zn supplementation. PPNH did not interact with supplemented Zn (ZNI × PPNH, P > 0.10). As PPNH is dependent from dietary PP level and from vegetal and supplemented phytase activity, the evolution of bone Zn content with increasing levels of supplemental Zn was calculated using the equation from Létourneau-Montminy et al. (Reference Létourneau-Montminy, Jondreville, Sauvant and Narcy2012) and the regression from Table 8 in diets with varying PP (2.5 g PP/kg representing maize–soybean meal diets and 1.5 g PP/kg representing cereal-based diets enriched with milk by-products), varying levels of phytase addition (0, 500 and 1000 FTU/kg) and of endogenous phytase activity (0, 200 U/kg) in the diet with lower PP level, simulating its inactivation or not through pelleting process for example. This simulation is illustrated in Figure 3.
Bone zinc content (mg/kg DM) from weaned piglets dependent from the dietary content of non-hydrolyzed phytic phosphorus (g/kg diet) and from native and supplemented zinc (mg/kg diet; Analysis II)Footnote a
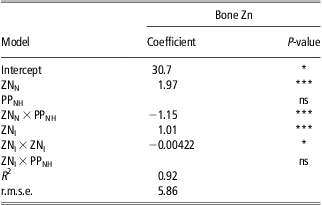
DM = dry matter; PPNH = non-hydrolyzed phytic phosphorus; ZNN = native zinc; ZNI = inorganic zinc; R 2 = coefficient of determination; r.m.s.e. = root mean square error.
*** P < 0.001; *P < 0.05; ns. P > 0.10.
a The model was based on equation (3). Data from experiment nos 101 to 105 are described in Table 2.
Model of piglet bone zinc (mg/kg dry matter) response to supplemental zinc (mg/kg diet) in various diets (Analysis II)a,b. aData from experiment nos 101 to 105 described in Table 2. bPPNH (g/kg) equivalencies for each diet: PP = 2.5 g/kg, 0 FTU/kg: 1.81; PP = 2.5 g/kg, 500 FTU/kg: 1.33; PP = 2.5 g/kg, 1000 FTU/kg: 0.49; PP = 1.5 g/kg, 0 FTU/kg: 1.08; PP = 1.5 g/kg, 500 FTU/kg: 0.34; PP = 1.5 g/kg, 1000 FTU/kg: 0.17; PP = 1.5 g/kg, 200 U/ kg: 0.95

Discussion
Bioavailability of supplemented zinc sources
The two supplemented Zn sources (ZNI and ZNO) were available to broilers and to piglets as the dependent variables responded positively (Analysis I). The positive response for plasma Zn and bone Zn in broilers and for plasma Zn and ALP in piglets decreased progressively with increasing dietary Zn content probably because of the approach of a physiological maximum (plateau). It was expressed with the negative quadratic effect of supplemented Zn (ZNI × ZNI and ZNO × ZNO) and with the interaction between ZNN and supplemented Zn (ZNN × ZNI and ZNN × ZNO) in broilers and with the quadratic effect of supplemented Zn (ZNI × ZNI and ZNO × ZNO) in piglets. The broiler bone Zn responded slightly better to ZNO than ZNI with increasing ZNN, but far away from any significant value. The piglet plasma Zn responded to a higher extent with the quadratic effect of ZNO compared with the one of ZNI, however, the response was counteracted by the numerically lower linear coefficient of ZNO (0.0125 v. 0.0147). This eliminated any visible difference between the sources (Table 6; Figure 2). Taking into account the linear and quadratic effects on supplemented Zn and their interactions with ZNN, ZNO and ZNI were finally equally bioavailable in broilers and in piglets. With the used dataset for broilers, it is however debatable to which extent the quadratic response of bone Zn had a softening effect on the ZNI and ZNO slopes and to which extent this may have attenuated potential differences. Nevertheless, The results suggest a similar bioavailability of ZNI and ZNO, in line with previous qualitative reviews on the subject (Ammerman et al., Reference Ammerman, Baker and Lewis1995; Jongbloed et al., Reference Jongbloed, Kemme, De Groote, Lippens and Meschy2002).
Zinc bioavailability in response to dietary phytates content and phytase activity
Only bone Zn was selected as independent variable for Analysis II. Bone Zn content is a reliable indicator for Zn bioavailability as it is highly correlated with dietary Zn content (Hill et al., Reference Hill, Peo, Lewis and Crenshaw1986; Wedekind et al., Reference Wedekind, Lewis, Giesemann and Miller1994; Mohanna and Nys, Reference Mohanna and Nys1998; Revy et al., Reference Revy, Jondreville, Dourmad and Nys2003) and as it's maxima (plateau) is reached when dietary Zn content is higher than needed for other parameters. When dietary zinc content is increased, the approach of a physiological plateau for bone Zn, most probably explains the negative quadratic effect of supplemented Zn observed in broilers (ZNI × ZNI, P < 0.001 in Analysis II) and in piglets (ZNI × ZNI, P < 0.05 in Analysis II) and the negative interaction between supplemented Zn and supplemented phytases observed in broilers (ZNI × PhytaseS, P < 0.05 in Analysis II).
In broilers, as PP, ZNN and PhytaseV could not be taken into account for bone Zn content (Analysis II), only ZNI and PhytaseS remained in the model. The equation presented in Table 7 shows, as expected, that dietary Zn and phytase supplementations improve bone Zn concentration. The calculated ZNI equivalency for PhytaseS is 1.0 mg ZNI/100 FTU in a non-Zn-supplemented diet. This value for non-supplemented Zn diets is compatible with the equivalency published by Jondreville et al. (Reference Jondreville, Lescoat, Magnin, Feuerstein, Gruenberg and Nys2007).
In piglets, the accuracy of the new variable PPNH was verified using non-supplemented Zn data. Although bone Zn content was poorly correlated to PP and ZNN content (R 2 = 0.003), bone Zn content was linearly dependent from PPNH and ZNN in unsupplemented Zn diets (Bone Zn = 18.07 (P = 0.11) + 2.4082 (P < 0.001) × ZNN−1.2033 (P < 0.001) × PPNH, R 2 = 0.93, r.m.s.e. = 4.60). PPNH is therefore a reliable variable and the release of P and Zn from phytates are proportional. In equation (3) (Table 8), the positive coefficients for ZNN and ZNI and the negative effect of PPNH on ZNN, but not on ZNI coefficients for bone Zn content suggests that phytates reduced Zn bioavailability from native Zn only in pigs. The antagonism of vegetal phytates on native zinc bioavailability, was observed earlier in human nutrition (Sandström et al., Reference Sandström, Almgren, Kivistö and Cederblad1987). More recently, Rodrigues-Filho et al. (Reference Rodrigues-Filho, Vaz, Felicissimo, Scarpellini, Cardoso, Vinhas, Landers, Schneider, Mc Garvey, Andersen and Skibsted2005) found that phytates and Zn are, at least partially, bound in wheat grains and Revy et al. (Reference Revy, Jondreville, Dourmad and Nys2003) observed a positive linear relation between these two components in vegetal feed ingredients (about 10 mg Zn for 1 g PP), which also suggests that they are bound. The facts that native Zn would be bound to phytates and that native Zn bioavailability in pigs was consequently reduced (Analysis II) explain the findings in Analysis I, where piglet's Zn absorption and Zn status was not improved or even reduced with increasing ZNN. In contrary to ZNN, PPNH was not an antagonist for ZNI bioavailability in piglets (Analysis II). This finding is in contradiction with the reduced Zn absorbability, Zn status or growth from experiments having studied the effect of supplemental phytate (mostly as sodium phytate, C6H6Na12O24P6) in semi-synthetic diets containing or not containing supplemental Zn (O'Dell and Savage, Reference O'Dell and Savage1960; Oberleas et al., Reference Oberleas, Muhrer and O'Dell1962; Rimbach and Pallauf, Reference Rimbach and Pallauf1992; Rimbach et al., Reference Rimbach, Pallauf, Brandt and Most1995; Windisch and Kirchgessner, Reference Windisch and Kirchgessner1999). As phytate from sodium phytate is easily ionizable under a wide pH range, ionized Zn from supplemental sources may rapidly bind to phytic acid (Davies and Nightingale, Reference Davies and Nightingale1975). Under such experimental conditions, organic Zn sources were also better absorbed than Zn as ZnSO4, probably from its reduced reaction with phytic acid issued from added sodium phytate (Schlegel and Windisch, Reference Schlegel and Windisch2006). However, as pointed out by Fordyce et al. (Reference Fordyce, Forbes, Robbins and Erdman1987), interactions between sodium phytate and supplemental Zn may be enhanced compared with the interactions between plant phytates and supplemental Zn. This hypothesis was already made by Erdman (Reference Erdman1979) who did not notice any effect of the presence of soy in rat diets on the bioavailability of Zn added as ZnCO3. Thus, the present data suggest that any protection of supplemental Zn sources from PP appears not necessary in diets containing plant phytates. This is consolidated by the present meta-analysis indicating that organic Zn sources were not more bioavailable than inorganic Zn sources in broilers nor in piglets (Analysis I).
As the form of supplemental Zn was not a limiting factor for dietary Zn bioavailability in broilers and piglets, and as these two species differed in the efficiency of dietary Zn use, ZNN bioavailability needs to be discussed between species. The data from Analysis I suggests that broilers are more efficient in using ZNN than piglets and the data from Analysis II show that ZNN was negatively affected by PPNH in piglets and that PhytaseS was more efficient in piglets to improve ZNN bioavailability than in broilers. Zinc bioavailability results from dietary Zn solubility in the digestive tract before absorption (Susaki et al., Reference Susaki, Matsui, Ashida, Fujita, Nakajima and Yano1999), which is dependent from pH conditions (Cao et al., Reference Cao, Henry, Guo, Holwerda, Toth, Littell, Miles and Ammerman2000; Jongbloed et al., Reference Jongbloed, Kemme, De Groote, Lippens and Meschy2002). Early in 1963, Reference LeaseLease measured that 66% of Zn from soybean meal was soluble when the raw material was previously digested with pepsin at pH 3, followed with an alcalinization to pH 6.8. In vitro, phytic acid bound with Ca2+, Cd2+, Zn2+ and Cu2+ becomes soluble from a pH lower than 4 to 5 (Kumar et al., Reference Kumar, Sinha, Makkar and Becker2010). The present data suggests that the gizzard pH would be sufficiently low to release, at least partially, native Zn from phytates (even not hydrolyzed), which is then rapidly absorbed in the beginning of the duodenum before pH of the digestive tract rises. The piglet stomacal pH is generally higher than in the gizzard (Létourneau-Montminy, Reference Létourneau-Montminy2009; Schlegel et al., Reference Schlegel, Nys and Jondreville2010), and piglets seem not capable to release a significant amount of native Zn from phytates. The capacity of broilers to release native Zn from phytates would also explain the 8 times lower Zn equivalence of supplemental phytase (500 FTU/kg diet) in broilers compared with the equivalence in piglets (Jondreville et al., Reference Jondreville, Hayler and Feuerstein2005 and Reference Jondreville, Lescoat, Magnin, Feuerstein, Gruenberg and Nys2007) also when the capacity of supplemented phytase to hydrolyze PP is similar between the two species (Selle and Ravindran Reference Selle and Ravindran2007 and Reference Selle and Ravindran2008; Létourneau-Montminy et al., Reference Létourneau-Montminy, Narcy, Lescoat, Bernier, Magnin, Pomar, Nys, Sauvant and Jondreville2010 and Reference Létourneau-Montminy, Jondreville, Sauvant and Narcy2012). It is also in accordance with the lower Zn requirements in this species compared with piglets (National Research Council 1994 and 1998).
Conclusions
The results from the four meta-analyses suggest that (1) broilers and piglets use supplemented Zn, independent from Zn source; (2) broilers are able to use native Zn and the use is slightly enhanced with supplemental phytase; (3) however, piglets are limited in the use of native Zn due to the antagonism of non-hydrolyzed dietary phytate. These results imply that the consideration of dietary native Zn and PP content and phytase activity are key solutions for an adapted Zn supplementation and an efficient Zn use in broilers and piglets.
Acknowledgement
The authors would like to thank the company Pancosma for having kindly provided the necessary data on two broiler studies.