INTRODUCTION
Communication is an inherently cognitive process as it draws on various abilities like perceiving, remembering, attending, analyzing, and generalizing aspects of incoming stimuli. Such cognitive functions regulate the use of our native language(s) (N. C. Ellis, Reference Ellis and Robinson2001, Reference Ellis2014), with working memory as the main orchestrator in charge of coding, storing, and processing verbal information (Baddeley, Reference Baddeley2007, Reference Baddeley2010). However, working memory is limited in its capacity to perform these functions simultaneously, which not only impacts first language (L1) comprehension and use, but is proposed to be even more crucial for adult learners learning nonprimary, or second, languages (L2s) because of adults’ limited cognitive capacity (e.g., McLaughlin, Reference McLaughlin1987) and the need to process linear sequences of symbols over time in language comprehension and production (Miyake & Friedman, Reference Miyake, Friedman, Healy and Bourne1998).
Therefore, variation in cognitive capacity may explain highly variable L2 outcomes for adult learners because of a less than optimal ability to simultaneously attend to meaning and form in L2 input (VanPatten, Reference VanPatten and VanPatten2004), a question that has received increasing theoretical and empirical attention since Harrington and Sawyer’s (Reference Harrington and Sawyer1992) seminal study. More than 20 years later, we continue to both widen and focus inquiries into the role of working memory capacity (WMC) in different aspects of L2 development from reading comprehension (e.g., Leeser, Reference Leeser2007) to oral fluency, complexity, and accuracy (e.g., O’Brien, Segalowitz, Freed, & Collentine, Reference O’Brien, Segalowitz, Freed and Collentine2007) to learning under more or less explicit instructional conditions (e.g., Sanz, Lin, Lado, Bowden, & Stafford, Reference Sanz, Lin, Lado, Bowden and Stafford2014) or contexts (Grey, Cox, Serafini, & Sanz, Reference Grey, Cox, Serafini and Sanz2015), to name a few. An area of particularly frequent investigation is the role of WMC in the development of L2 morphosyntax with a focus on overall proficiency (Hummel, Reference Hummel2009; Kormos & Sáfár, Reference Kormos and Sáfár2008; Linck et al., Reference Linck, Hughes, Campbell, Silbert, Tare, Jackson and Doughty2013b), morphological processing (Coughlin & Tremblay, Reference Coughlin and Tremblay2013; Foote, Reference Foote2011; Grey et al., Reference Grey, Cox, Serafini and Sanz2015; Sagarra & Herschensohn, Reference Sagarra and Herschensohn2010; Williams & Lovatt, Reference Williams and Lovatt2003), syntactic processing (Grey et al., Reference Grey, Cox, Serafini and Sanz2015; Havik et al., Reference Havik, Roberts, van Hout, Schreuder and Haverkort2009; Juffs, Reference Juffs2004, Reference Juffs2005), and the development of implicit and explicit linguistic knowledge (Erçetin & Alptekin, Reference Erçetin and Alptekin2013; Linck & Weiss, Reference Linck, Weiss, Sanz and Leow2011).
While the vast majority of studies find that learners with more efficient working memory resources tend to significantly outperform their peers with less efficient cognitive resources, supporting the “more is better” hypothesis (Miyake & Friedman, Reference Miyake, Friedman, Healy and Bourne1998), others have not found a significant role for WMC (e.g., Grey et al., Reference Grey, Cox, Serafini and Sanz2015; Juffs, Reference Juffs2004, Reference Juffs2005). This discrepancy may be linked to factors known to mitigate associations between WMC and L2 development such as the demands of experimental tasks (Roberts, Reference Roberts2012; Williams, Reference Williams, Gass and Mackey2012) and language tests (Robinson, Reference Robinson2005; Sanz, Reference Sanz, Glass and Pérez-Lerroux1997); the component of WMC investigated and how it is measured (Juffs & Harrington, Reference Juffs and Harrington2011); and the complexity of linguistic target(s) (Williams, Reference Williams, Gass and Mackey2012). More recently, Linck, Osthus, Koeth, and Bunting (Reference Linck, Osthus, Koeth and Bunting2013a) and Sagarra (Reference Sagarra and Chapelle2013) further considered the role that learner proficiency may play in determining the impact of WMC in L2 development.
The idea that cognitive ability may be differentially involved depending on the stage of L2 development (Robinson, Reference Robinson2001, Reference Robinson2005, Reference Robinson and Chapelle2013) and stage of language processing (Skehan, Reference Skehan and Robinson2002, Reference Skehan, Gass and Mackey2012) originates in discussions on language aptitude (i.e., general language learning ability). As it is traditionally measured on the Modern Language Aptitude Test (MLAT—Carroll & Sapon, Reference Carroll and Sapon1959), empirical evidence seems to indicate that aptitude matters most for learners in the initial stages of development (see Li, Reference Li2014 for a meta-analysis) and that different components of aptitude likely regulate encoding, storage, and retrieval stages of L2 processing that align with noticing, pattern identification, lexicalizing, output stages, and so forth (Skehan, Reference Skehan and Robinson2002). However, in terms of working memory, or the key component underlying aptitude (e.g., Robinson, Reference Robinson2005; Sanz, Reference Sanz2005; Sawyer & Ranta, Reference Sawyer, Ranta and Robinson2001), a review of empirical research reveals that few, if any, studies directly investigate whether individual variation in WMC exerts a similar influence between and within L2 learners at increasing proficiency over the course of an instructional period. To address this gap, the current study aims to differentiate the degree to which WMC impacts long-term morphosyntactic development in instructed adult L2 learners of Spanish at different skill levels.
BACKGROUND
Defining and Measuring Working Memory Capacity
Different models of WM vary in their specific theoretical conceptualization (Miyake, Reference Miyake2001; Miyake & Shah, Reference Miyake and Shah1999; Sagarra, Reference Sagarra and Chapelle2013) Footnote 1 but generally agree that WM is a limited-capacity construct that regulates online processing, storage, and retrieval. While these models have valuably contributed to our understanding of WM, the domain-specific, multiple-resource model (Baddeley, Reference Baddeley1986, Reference Baddeley2000, Reference Baddeley2003, Reference Baddeley2007, Reference Baddeley2010; Baddeley & Hitch, Reference Baddeley, Hitch and Dornic1974; Baddeley & Logie, Reference Baddeley, Logie, Miyake and Shah1999) remains dominant in the field (Miyake, Reference Miyake2001; Wen, Mota, & McNeill, Reference Wen, Mota and McNeill2015). This model posits a “nonunitary” view of WM with specialized processing and storage components that comprise a domain-general construct (i.e., executive function, EF) responsible for various attentional functions (e.g., inhibiting, switching, and retrieving information), and two domain-specific storage systems, the phonological loop (i.e., phonological working memory, PWM) that handles phonological and verbal information and has a span of about 1 to 2 seconds (Baddeley, Reference Baddeley1986, Reference Baddeley2003), and the visuospatial sketchpad, in charge of visual and spatial information. The episodic buffer (Baddeley, Reference Baddeley2000) encodes and retrieves information from long-term memory and communicates with storage components.
To measure the limits of EF and PWM components, the majority of studies in L2 learning have adopted WM span tasks widely used in cognitive psychology (Conway et al., Reference Conway, Kane, Bunting, Hambrick, Wilhelm and Engle2005). Such measures can be verbal (e.g., word span) or nonverbal (e.g., digit span) and simple or complex in nature. Only complex span tasks that impose dual-task demands sufficiently capture a learner’s WMC when being pushed to the limit (Logie, Reference Logie2011) as they require subjects to maintain target items (words or letters) in memory for later recall while reading or listening to sentences, as in the Reading and Listening span tasks (RSpan/LSpan—Daneman & Carpenter, Reference Daneman and Carpenter1980; Waters & Caplan, Reference Waters and Caplan1996) or calculating simple mathematical operations as in the Operation span (OSpan—Turner & Engle, Reference Turner and Engle1989; Unsworth, Heitz, Schrock, & Engle, Reference Unsworth, Heitz, Schrock and Engle2005). Nonverbal span tasks administered in the learners’ L1, rather than the L2, are argued to be preferable to avoid a potential confound with verbal processing (e.g., Engle, Reference Engle2002; Wen, Reference Wen2012) and L2 proficiency (e.g., Alptekin, Erçetin, & Özemir, Reference Alptekin, Erçetin and Özemir2014; Juffs & Harrington, Reference Juffs and Harrington2011; Sagarra, Reference Sagarra and Chapelle2013; Van den Noort, Bosch, & Hugdahl, Reference Van den Noort, Bosch and Hugdahl2006).
Working Memory and L2 Development
The past two decades of L2 research have provided accumulating empirical evidence that variation in the ability to temporarily store and process incoming information (i.e., EF) and to code and store acoustic sounds (i.e., PWM) constrains a range of L2 phenomena. However, certain methodological shortcomings still prevent us from determining the magnitude of WM effects. In the first meta-analysis on this topic, Linck and colleagues (2013a) investigated variables likely to influence the relationship between WM and L2 comprehension and production, focusing on characteristics of cognitive tasks (e.g., verbal vs. nonverbal), criterion measures (e.g., skills tested), and participants (e.g., less proficient vs. highly proficient).
A total of 748 correlation effect sizes were analyzed in 79 published and unpublished studies (N = 3,707 participants), revealing a robust, positive association between WMC and L2 processing and proficiency outcomes. Most relevant to the current study is that effect sizes did not vary by level of proficiency, leading the authors to infer that WM is similarly related to L2 outcomes for both less- and more-proficient adult learners. However, it is important to consider that studies differed greatly in how they described and/or quantified L2 proficiency in their samples, as acknowledged by the authors, and proficiency is operationalized as two levels only in the meta-analysis, likely because few studies include learners at low, medium, and high proficiency. Overall, Linck and colleagues argue that more research is needed to clarify the contributions of WM at earlier and later stages of L2 learning.
In the following section, we review research investigating the relationship between WMC and the ability to process and use L2 grammar in performance, highlighting, wherever possible, a potential interaction with L2 proficiency.
WMC and Overall L2 Proficiency
Winke (Reference Winke2005) found that L1 PWM positively correlated with writing, speaking, and reading abilities on a Chinese proficiency test for beginners, but only with listening ability for advanced learners. Other components of aptitude as measured on the MLAT (i.e., rote learning, phonetic coding, and grammatical sensitivity) also significantly related to beginning, but not advanced, learners’ performance. In a long-term study, Kormos and Sáfár (Reference Kormos and Sáfár2008) reported that L1 PWM correlated moderately with overall performance and several subcomponents of a standardized English exam for adolescent intermediate learners at the end of a one-year intensive program, while EF, but not PWM, in contrast to Winke’s finding, significantly related to overall performance and all test subcomponents (except writing) for beginners. However, the intermediate group did not complete the backward digit span task used to measure EF. Hummel (Reference Hummel2009) found moderate positive correlations between L1 PWM and L2 English proficiency in adult L1 French learners who were relatively proficient (mean score of 75% on TOEFL-like proficiency test). When learners were split into higher and lower proficiency subgroups using a median split, regression analyses determined PWM to be a significant predictor for the lower level subgroup only.
In contrast to the three studies mentioned previously, Sagarra (Reference Sagarra2000) did not find a relationship between L1 EF and the development of L2 grammatical knowledge of Spanish in a large sample of L1 English university learners tested as “early” (2nd semester) and “late beginners” (4th semester). Footnote 2 In one of the only studies to attempt to identify cognitive predictors of successful L2 learning in highly advanced learners, Linck et al. (Reference Linck, Hughes, Campbell, Silbert, Tare, Jackson and Doughty2013b) conducted logistic regression models with performance scores on a Hi-LAB test battery (developed by the Center for Advanced Study of Language at the University of Maryland) consisting of several cognitive, perceptual, and language tests. They found that associative memory, implicit learning, and PWM were particularly apt for classifying learners into high and mixed attainment groups.
In sum, both EF and PWM components significantly correlate with and predict learner performance on tests tapping overall L2 proficiency for lower level learners, though relationships do not always emerge with EF (Sagarra, Reference Sagarra2000) or PWM (Kormos & Sáfár, Reference Kormos and Sáfár2008) in beginning learners. Additionally, some evidence exists for a role for PWM in advanced (Winke, Reference Winke2005) and highly advanced learners (Linck et al., Reference Linck, Hughes, Campbell, Silbert, Tare, Jackson and Doughty2013b).
WMC and L2 Morphosyntax
In the domain of morphosyntax, many studies have relied on self-paced reading and GJT data to investigate the potential effects of WMC. For example, Kempe and colleagues provide robust evidence for the facilitative role of cognitive capacity in learning and generalizing L2 Russian case morphology in novice learners, specifically for verbal WMC in learning to mark gender in nontransparent (i.e., arbitrary or irregular) nouns (Kempe & Brookes, Reference Kempe and Brooks2008; Kempe, Brooks, & Kharkhurin, Reference Kempe, Brooks and Kharkhurin2010).
Other studies support a positive effect for L1 EF in processing gender agreement. Sagarra (Reference Sagarra and Han2008) found that L1 English beginning learners with high WMC were sensitive to gender agreement violations and Sagarra and Herschensohn (Reference Sagarra and Herschensohn2010) reported that intermediate (7–8th semester), but not beginning (3rd semester), learners with higher WMC were more sensitive to gender (but not number) disagreement. The lack of effects for beginners was potentially attributed to a low overall WMC mean for this group. In terms of PWM, Williams and Lovatt (Reference Williams and Lovatt2003) found that L2 PWM significantly related to novice learners’ ability to learn and generalize determiner-noun gender agreement rules in semiartificial microlanguages derived from Italian. However, given that knowledge of other gender-marking languages was not controlled and PWM was measured in the L2, prior knowledge could have accounted for results.
For higher proficiency learners, Coughlin and Tremblay (Reference Coughlin and Tremblay2013) found that learners’ WMC measured in L2 French, but not L1 English, significantly predicted sensitivity to number agreement violations in “mid” to “high” proficiency learners but did not differentiate performance in short- and long-distance conditions in which third-person direct object clitics were near or far from their left-dislocated antecedents. Havik and colleagues (2009) reported that L1 German−L2 Dutch learners with a high WM span performed similarly to low-span native Dutch speakers in resolving subject-object relative clause ambiguities on processing tasks. However, even though WM span scores in learners’ L2 were significantly lower than their L1 scores (see Havik et al., Reference Havik, Roberts, van Hout, Schreuder and Haverkort2009, pp. 84, 87) effects were not discussed or differentiated by language, leading the reader to assume that learners’ L1 German and L2 Dutch scores were analyzed as a composite. Dussias and Piñar (Reference Dussias and Piñar2010) also found a relationship between L1 WMC and the ability to process long-distance wh-questions in that only high-span L1 Chinese−L2 English learners utilized plausibility information to recover from initially misparsing subject-object asymmetries.
However, not all studies looking at morphosyntax have found facilitative effects of cognitive capacity for advanced learners. Foote (Reference Foote2011) reported that L2 WMC did not account for differential sensitivity in processing subject-verb number and noun-adjective gender agreement errors in nativelike English-Spanish late bilinguals. However, all groups showed similar sensitivity to grammaticality as a function of number and gender agreement distance (with one exception in Position 2, see p. 208). Thus reading time scores for late bilinguals might not have exhibited enough variation to yield a significant relationship with WMC. Grey and colleagues (2015) also failed to find a relationship between L1 WMC, L1 and L2 PWM, and gains in morphosyntactic and lexical accuracy and latency in advanced L1 English−L2 Spanish learners over a 5-week study abroad experience. Similarly, Juffs (Reference Juffs2004, Reference Juffs2005) found that neither L1 nor L2 WMC was related to variation in processing temporary syntactic ambiguities and wh- movements in L1 Chinese, Japanese, and Spanish−L2 English speakers but did report that low WMC scores (based on storage) were associated with slower reading times. However, one issue with clearly interpreting this finding is that learners were said to meet a minimal proficiency requirement based on standardized test performance but whether their test scores placed them at a beginning, intermediate, or advanced level was not entirely clear and test scores notably varied across L1 groups (Juffs, Reference Juffs2004, p. 208).
To summarize, more efficient resources in EF, and to a lesser extent PWM, have been reported to facilitate learners’ ability to process and use L2 morphology, particularly at low but not high L2 proficiency, with one exception (Coughlin & Tremblay, Reference Coughlin and Tremblay2013). For complex L2 syntax, some self-paced reading studies report facilitative effects for relatively advanced learners (Dussias & Piñar, Reference Dussias and Piñar2010; Havik et al., Reference Havik, Roberts, van Hout, Schreuder and Haverkort2009) while others provide weak evidence (Juffs, Reference Juffs2004, Reference Juffs2005).
Finally, three studies have investigated the role of WMC in the development and use of explicit grammatical knowledge measured using untimed, multiple-choice tests in beginning and intermediate learners (Linck & Weiss, Reference Linck, Weiss, Sanz and Leow2011; Roehr & Gánem-Gutiérrez, Reference Roehr and Gánem-Gutiérrez2009), and both implicit L2 knowledge, measured on a timed grammaticality judgment task and elicited imitation test, and explicit L2 knowledge, measured in an untimed grammaticality judgment task (following R. Ellis, Reference Ellis, Ellis, Loewen, Elder, Erlam, Philp and Reinders2009) in advanced learners (Erçetin & Alptekin, Reference Erçetin and Alptekin2013). Linck and Weiss (Reference Linck, Weiss, Sanz and Leow2011) found that L1 WMC (EF) was the only cognitive variable to account for a significant amount of unique performance variance at the start of the semester in 1st and 3rd semester L1 English−L2 German and Spanish learners and also was the only variable to reliably predict their development over the 3-month instructional period. In contrast, Roehr and Gánem-Gutiérrez (Reference Roehr and Gánem-Gutiérrez2009) did not find a significant association with L1 or L2 WMC in L1 English intermediate L2 learners of German and Spanish. However, L1 WMC was measured without a simultaneous processing requirement and previous study of typologically similar languages (e.g., French, Italian, Latin, and Dutch) was not controlled. At advanced proficiency, Erçetin and Alptekin (Reference Erçetin and Alptekin2013) found positive relationships between L2 WMC and both implicit and explicit linguistic knowledge in L1 Turkish−L2 English university learners, but with a stronger relationship on the explicit measure. However, WMC was measured in L2 English.
The mixed results in this domain prevent drawing clear conclusions and are further limited by methodological limitations. However, it seems that WMC may affect the development and use of explicit L2 knowledge in less proficient, and possibly advanced, learners.
Summary of Findings, Gaps, and Limitations
Taken together, the studies reviewed in the preceding text indicate that learner proficiency level may mediate the extent to which WMC constrains adult learners’ ability to process L2 grammar and access linguistic knowledge in performance, as has been previously observed (e.g., Sagarra, Reference Sagarra and Chapelle2013), but not empirically confirmed. That is, studies tend to more consistently report positive effects for lower proficiency learners whereas findings for advanced learners with more exposure to and practice in the target language are mixed.
However, not all studies have found the expected effects for lower proficiency learners. Certain methodological limitations may explain contradictory findings such as omitting a simultaneous processing task (e.g., reading or listening to sentences or calculating simple mathematical operations) in the L1 WM span measure (Roehr & Gánem-Gutiérrez, Reference Roehr and Gánem-Gutiérrez2009; Sagarra, Reference Sagarra2000), which does not follow recommended dual-task methodology and therefore cannot truly tap the limits of WMC (Conway et al., Reference Conway, Kane, Bunting, Hambrick, Wilhelm and Engle2005; Logie, Reference Logie2011). In addition, studies reporting WM effects for higher proficiency learners that measured WMC in the L2 are questionable (Coughlin & Tremblay, Reference Coughlin and Tremblay2013; Erçetin & Alptekin, Reference Erçetin and Alptekin2013) given that this method likely reflects variation in L2 skill, even at advanced levels, rather than variation in the construct of WMC per se.
A crucial methodological aspect limiting the conclusions we can draw from studies done to date is that most studies focus on one proficiency level only, or two at most, which are often too close to enable meaningful comparison (e.g., beginning and “pre-intermediate”—Kormos & Sáfár, Reference Kormos and Sáfár2008) or represent opposite ends of the developmental spectrum (e.g., beginning and advanced—Winke, Reference Winke2005). Another issue is clearly determining the proficiency level of participant samples, as some of the studies reviewed here underreported or did not interpret proficiency measures, if they were independently assessed, echoing previous critiques (Linck et al., Reference Linck, Osthus, Koeth and Bunting2013a; Tremblay, Reference Tremblay2011).
Finally, the overwhelming majority of studies employed a cross-sectional design that reflects a dominant trend in learner ID research (Ortega & Iberri-Shea, Reference Ortega and Iberri-Shea2005) given the challenge of obtaining longitudinal developmental data. Only a handful of studies to date considered learner development over some period of time (Grey et al., Reference Grey, Cox, Serafini and Sanz2015; Kormos & Sáfár, Reference Kormos and Sáfár2008; Linck & Weiss, Reference Linck, Weiss, Sanz and Leow2011; Sagarra, Reference Sagarra2000), though not all measured L2 performance at the beginning and end of the study period (Kormos & Sáfár, Reference Kormos and Sáfár2008). Importantly, no study has yet employed a longitudinal design with learners at different skill levels who completed the same cognitive and assessment tasks, which would arguably provide the most effective way of empirically determining the potentially differential and dynamic effects of WM components in L2 learning.
GOALS OF THE CURRENT STUDY
Motivated by gaps in previous research, the present study aims to discern the extent to which variation in the central executive and phonological loop components of WMC significantly relates to and is predictive of L2 grammatical development and retention of Spanish in L1 English university learners at three levels of proficiency. To address gaps, we posed three research questions:
-
1. Is the executive function component of WMC significantly related to the development and retention of L2 grammar during and after a semester of instruction in adult classroom learners of Spanish?
-
1 (a) If so, do relationships exist at beginning, intermediate, and advanced levels of L2 proficiency?
-
-
2. Is phonological working memory significantly related to the development and retention of L2 grammar during and after a semester of instruction in adult classroom learners of Spanish?
-
2 (a) If so, do relationships exist at three levels of L2 proficiency?
-
-
3. What is the relative explanatory capacity of the executive function and phonological loop components of WMC for adult L2 learners of Spanish at three levels of proficiency?
RESEARCH DESIGN AND METHODOLOGY
Participants
Eighty-seven native English speakers learning Spanish in a private northeastern U.S. university participated in this study (28 male, 59 female; M = 19 years old, standard deviation (SD) = .8). Twenty-three participants were enrolled in beginning courses (2nd semester), 33 in intermediate courses (4th semester), and 31 in advanced courses (6th semester). However, at later testing times overall sample size varied due to participant attrition (N = 87 > 83 > 33). Sample size by group is provided in the “Results” section. Prior to participating in the study, participants were screened using a biodata questionnaire that gathered language background information. All participants included in the study reported (a) English as (one of) their native language(s) and if bilingual, an additional non-Romance native language (Arabic (n =1), Mandarin Chinese (n =1), Geo (n =1), Urdu/Hindi (n =2), and Russian (n =1)); (b) no or limited in/formal study of a Romance language; Footnote 3 (c) a late age of first exposure to Spanish (Beginning group—M = 16 yrs, SD = 2.7; Intermediate—M = 13 yrs, SD = 1.7; Advanced—M = 12 yrs, SD = 1.9); and (d) spent no more than two weeks in a Spanish-speaking country. For their time, students were awarded extra credit points in their Spanish class.
L2 Proficiency Level
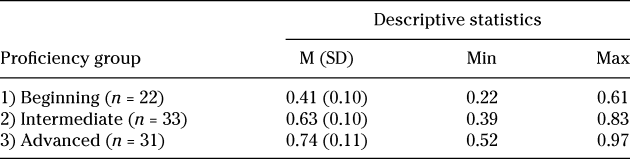
Participants also completed the grammar portion of a department-internal Spanish placement exam in an effort to employ more robust proficiency assessment standards (see Tremblay, Reference Tremblay2011), and to confirm the main operationalization of L2 proficiency level based on institutional course enrollment. Learners had up to 30 minutes to select the appropriate answer to 36 four-option multiple-choice items targeting a range of grammatical structures in Spanish such as tense, aspect and mood inflection, and gender and number agreement. Table 1 displays mean performance scores (calculated as a percentage), standard deviation from the mean, and minimum and maximum scores.
Descriptive statistics of the Spanish placement exam (36 items) by group

Note. M, Mean; SD, Standard deviation; Min, Minimum; Max, Maximum.
One participant in the beginning group did not complete the placement exam.
As Table 1 shows, intermediate learners outperformed beginners by 22% and advanced learners outperformed beginners and intermediate learners by 33% and 11%, respectively. Results of a one-way ANOVA revealed significant differences between groups (F(2, 85) = 67.96, p = .000**, ηp 2= .62) and post hoc Scheffé analyses determined each group to be significantly different from one another (p = .000**). Nonetheless, the minimum and maximum scores revealed that some learners performed well above or below their group mean. This intragroup variance may be due to chance, given the limited, receptive nature of the test (e.g., 36 multiple-choice items). Given the large effect size for between-group differences, groups were maintained based on course enrollment.
Materials
Working Memory Capacity Tests
WMC is operationalized as simultaneous storage capacity and processing efficiency. Two nonverbal measures conducted in the learners’ L1 (English) were used to tap executive function (OSpan task—Turner & Engle, Reference Turner and Engle1989; Unsworth et al., Reference Unsworth, Heitz, Schrock and Engle2005) and phonological working memory (Digit span task—Wechsler, Reference Wechsler1997). Both have been shown to be highly reliable in similar college-age participant populations (Conway et al., Reference Conway, Kane, Bunting, Hambrick, Wilhelm and Engle2005, p. 776).
OSpan Task and Scoring Procedure
In the modified OSpan version used here and standardized by Unsworth and colleagues, participants saw simple arithmetic equations like “IS (6 × 2) + 1 = 13? . . . F” and were instructed to solve it out loud (e.g., “Is six times two plus one equal to thirteen . . .Yes . . . F) and to maintain the capitalized letter in memory for later recall. There were twelve sets of varying difficulty, ranging from two to five mathematical operations/letters in each set. At the end of each set, participants saw three question marks cueing them to write down all of the letters from that set that they could remember in the correct order on an answer sheet provided. Participants first engaged in three practice trials to ensure full comprehension of task instructions. The OSpan was individually administered in Superlab 4.0 and took up to 20 minutes to complete.
Following recommended scoring procedure, a composite scoring method including both processing and storage was adopted to ensure the “maximum possible score when stretching [learner] abilities to their limits” (Logie, Reference Logie2011, p. 243). Processing and storage components were each worth 42 points (84 points total) respectively based on judging the accuracy of simple mathematical equations and number of letters accurately recalled. Following recommendations by Conway and colleagues (2005, p. 775), only learners who reached 80% accuracy in the processing task were included in subsequent analyses (all met this criterion) and the storage score was calculated following three methods varying in strictness: an all-or-nothing approach (Absolute—A) that awards one point for each letter only in sets where all letters were recalled in the correct order, and more flexible, partial-credit scoring methods that award a point for each letter accurately recalled but not for letters out of order (Total—T) and a point for any and all letters correctly recalled regardless of order (Lenient—L). Typically all three scoring methods correlate, but Conway and colleagues recommend using all three methods (2005, p. 776).
Digit Span Task and Scoring Procedure
In the digit span task, designed following Van den Noort and colleagues (2006), participants heard sets of two to nine digits and repeated the numbers aloud in the same order. If a participant failed to correctly repeat two sequential number sets, the experimenter terminated the task. Participants were awarded one point for every set remembered correctly (out of eight) until they reached the last set or until they missed two sets in a row. The number of sets repeated accurately is interpreted as their PWM, calculated out of a maximum 16 points possible. The digit span was individually administered in Superlab 4.0 and took up to 10 minutes to complete.
Target Grammatical Structures
In contrast with English, the target language, Spanish, has rich nominal and verbal inflectional systems (Montrul, Reference Montrul2004). For example, in the noun phrase, there must be gender and number agreement among nouns, determiners, and adjectives (e.g., es os niñ os travies os , “those naughty boys,” p. 32) and finite verbs are inflected for person (e.g., ( Yo ) habl o , “(I) speak”), tense (e.g., past-habl é , “I spoke,” future-hablar é , “I will speak”), aspect (preterite-habl é , imperfect-habl aba , “I used to speak,” progressive-est aba habl ando , “I was speaking”), and mood (indicative-habl o , subjunctive-habl e , “I speak,” conditional-hablar ía , “I would speak”) (pp. 26–27). For many reasons, these areas are known to cause the most persistent problems for adult English-speaking learners, one reason being that morphological agreement, including verbal inflection and grammatical gender, aspect, and mood, are not features of their L1 grammatical system (DeKeyser, Reference DeKeyser and DeKeyser2005). Such areas vary in difficulty based on complexity of (a) form, (b) meaning, and (c) (transparency) of the form-meaning relationship, causing problems especially in the initial stages of learning when morphology is a weak cue for meaning (p. 7).
Given these considerations, ten morphosyntactic structures increasing in form-meaning complexity were selected from 17 structures used in a study investigating type of grammatical knowledge in heritage and L2 learners of Spanish (Bowles, Reference Bowles2011). The reduction allowed for a slight increase in the overall number of grammatical and ungrammatical exemplars per target structure without substantially increasing the overall length of assessment tasks (see further description in the following text). Structures specifically targeted (a) agreement morphology (subject-verb, noun-determiner, and noun-adjective gender agreement), (b) constructions with gustar “to be pleasing to,” (c) aspect (preterit-imperfect aspectual distinction), (d) the copular contrast, ser/estar “to be” (use with locatives and events), and (e) mood (present subjunctive in noun clauses, imperfect subjunctive, and past hypothetical conditionals).
Assessment Tasks
To measure learners’ ability to process and use L2 Spanish grammar in comprehension and production, two assessment tasks adapted from Bowles (Reference Bowles2011) were used: (a) the elicited oral imitation task (OIT) designed to measure implicit linguistic knowledge and (b) the untimed grammaticality judgment task (UGJT) designed to measure explicit linguistic knowledge (e.g., R. Ellis, Reference Ellis2005; Erçetin & Alptekin, Reference Erçetin and Alptekin2013; Gutiérrez, Reference Gutiérrez2013). However, it is problematic to assume that late adult L2 learners in an instructed context have received enough naturalistic exposure to and practice in the target language to develop implicit grammatical representations, casting doubt on the OIT as a measure of implicit knowledge, particularly for lower level learners (Shiu & Spada, Reference Shiu and Spada2012; Spada, Reference Spada2013; Reference Suzuki and DeKeyserSuzuki & DeKeyser, in press). Rather, we postulate, along with Spada, DeKeyser, and others that the OIT more likely measures explicit knowledge that is more or less automatized depending on the amount and quality of practice and overall skill level of the learner (DeKeyser, Reference DeKeyser1997, Reference DeKeyser, VanPatten and Williams2015). However, to adequately address this question, we need behavioral data beyond accuracy, such as oral latency, and such data are not currently available.
Given the lack of cumulative behavioral evidence, the current study refrains from claiming which type of knowledge the OIT measures, and rather focuses on the demands of both tasks, which primarily differ based on timing and learners’ attentional focus on meaning (OIT) versus form (UGJT). See Serafini (Reference Serafini2013) for detail on the pilot testing phase of the study and resulting methodological revisions.
Elicited OIT and Scoring Procedure
Several studies have validated the OIT, albeit using slightly different versions, as a measure of L2 knowledge of Spanish (e.g., Bowles, Reference Bowles2011), English (e.g., Tomita, Suzuki, & Jessop, Reference Tomita, Suzuki and Jessop2009), and global proficiency in L2 Spanish (e.g., Ortega, Iwashita, Norris, & Rabie, Reference Ortega, Iwashita, Norris and Rabie2002). The OIT requires online aural comprehension and elicits an actual utterance from the learner with the logic being that a person’s ability to repeat the sentences is a reflection of his or her internal grammatical system (Mackey & Gass, Reference Mackey and Gass2005, p. 56) as learners can likely only repeat what they have comprehended and parsed (Bley-Vroman & Chaudron, Reference Bley-Vroman, Chaudron, Tarone, Gass and Cohen1994).
In the version of the OIT used here (following Bowles, Reference Bowles2011), learners were instructed to focus on the meaning of a series of randomized statements they heard aurally in Spanish and to agree with, disagree with, or indicate that they were not sure about the meaning of each statement. However, sentences were modified to be more objective and ensure that learners actually processed the semantic content of sentence stimuli (e.g., Los exámenes finales son en febrero, “Final exams are in February”; ¿Sí o No?, Yes or No?). Then, learners were instructed to immediately orally repeat the sentences they heard out loud in correct Spanish. There were two grammatical (GR) and two ungrammatical (UGR) items per target structure (40 items total) and syllable length was controlled in all test versions (see “Design and Procedure”), ranging from 16.7 (SD = 5.8), 17.3 (SD = 5.3), and 17.6 (SD = 5.9) syllables long on average. The task was individually administered in SuperLab 4.0 in a soundproof laboratory and took learners up to 18 minutes to complete. An effort was also made to gather reaction times (latency) for oral sentence repetitions but these data are not reported given technical issues that impeded precise measurement. Footnote 4
To score meaning processing accuracy, meaning judgment responses (e.g., ¿Sí o No?) were first converted into percentages (out of 40 possible points). Learners demonstrated above 75% comprehension accuracy on average (Beg—78%, SD = .12; Int—86%, SD = .06; Adv—92%, SD = .05). To score sentence repetition accuracy, a form and meaning-based method was adapted from Bowles and other studies (e.g., see Bowden, Reference Bowden2012; Ortega et al., Reference Ortega, Iwashita, Norris and Rabie2002). This scoring method not only considered whether learners accurately repeated the obligatory target structure, but also the extent to which learners repeated original meaning units. For instance, for the grammatical exemplar “Los exámenes finales son en febrero,” zero points were given to minimal (one word) or no repetition (e.g., Exámenes); one point was awarded for repeating up to 25% and two points for 25 to 50% of the original sentence stimulus but not accurately repeating or modifying the target structure (e.g., Los exámenes finales . . .); three points were awarded for sentences that included the obligatory target structure and more than 50% of idea units (e.g., Los exámenes finales son en . . .); Footnote 5 and four points were given for exact meaning and formal accuracy (e.g., Los exámenes finales son en febrero). Raw points were converted into percentages (0–4 pts × 40 items, 160 points total) and accuracy scores were also calculated separately for GR and UGR items (out of 80 points each) (see justification in the following text).
UGJT and Scoring Procedure
Participants were instructed to judge the grammaticality of 60 randomized written sentences they read in Spanish by selecting Grammatical or Ungrammatical (e.g., Muchos estudiantes viven en la residencia estudiantil, “Many students live in the student dormitory”). Then, they were asked to select the source of their judgment (Feel [intuition], Guess, or Rule) in order to increase confidence in the interpretation of their judgments (e.g. R. Ellis, Reference Ellis2004; Gass, Reference Gass, Tarone, Gass and Cohen1994; Sorace, Reference Sorace, Ritchie and Bhatia1996). There were three GR and three UGR items per target structure (60 items total). Learners completed the UGJT using Survey Monkey with no time limit but they took approximately 30 to 45 minutes.
To score performance on the UGJT, one point was awarded for correctly judged sentences and the raw number of points out of 60 was converted into a percentage score. As with the OIT, learners also received a separate accuracy score for GR and UGR sentence stimuli (30 points each) under the logic that the grammaticality of sentences may interact with learner knowledge and performance (R. Ellis, Reference Ellis2004, pp. 258–259). Judgment responses on the UGJT were also coded according to Feel, Guess, or Rule source attributions and rule accuracy although those data are not reported here.
Design and Procedure
A total of six research sessions were structured around the beginning of instruction (Time 1, T1), 10 weeks later at the end of instruction (Time 2, T2), and four weeks after a period without instruction (i.e., after the holiday break) (Time 3, T3) with two sessions at each testing time. To avoid test effects, or learners completing the same test three times, three comparable versions of each performance measure were distributed in a counterbalanced, or split-block, design to avoid ordering effects (see Mackey & Gass, Reference Mackey and Gass2005). Following this design, one third of all learners were randomly assigned to one of three groups (A, B, or C), regardless of proficiency level, and completed versions 1, 2 or 3 at T1, T2, or T3.
Sessions 1, 3, and 5 were completed individually with the researcher in a soundproof laboratory using SuperLab and Audacity to audio record oral production for later transcription. Learners completed the OIT, the OSpan, and digit span tasks during session 1 (T1) and again completed the OIT in sessions 3 (T2) and 5 (T3). Sessions 2, 4, and 6 were carried out in a group classroom laboratory and learners completed tasks on individual computers to access online applications. Learners completed the UGJT and the placement test during session 2 (T1) and again completed the UGJT in sessions 4 (T2) and 6 (T3). Total participation time lasted five to six hours for participants who completed all sessions.
Participants were recruited from several Spanish courses in order to reach numbers needed to meet statistical standards as determined in a series of a priori power analyses using R (version 3.0.0). Consequentially, the type of instruction learners were exposed to on a daily basis throughout the semester could not be strictly controlled in this study. Therefore, it was crucial to empirically determine whether any performance differences were attributable to different instructors. A series of one-way ANOVAs was run for the OIT and UGJT (Dependent variables) with Instructor as the Independent variable for each group. No significant differences by Instructor were found in the gain scores (Time 1 to Time 2) on the OIT for beginning (F(2, 20) = .214, p = .809), intermediate (F(2, 31) = 1.79, p = .184), or advanced learners (F(2, 29) = .003, p = .954) and the same was found for the UGJT (F(2, 20) = .214, p = .944; F(2, 31) = .443, p = .646; F(2, 29) = .02, p = .905, respectively). Thus, any significant differences found can more confidently be attributed to the cognitive variables of interest.
RESULTS
Before reporting the results of inferential statistics used to answer the three research questions guiding the study, preliminary analyses of performance data on the OSpan and digit span tasks are reported to determine whether learners possess comparable cognitive resources and reliability estimates (Cronbach’s alpha) for the two dependent measures are provided.
Descriptive Statistics: Cognitive Tasks
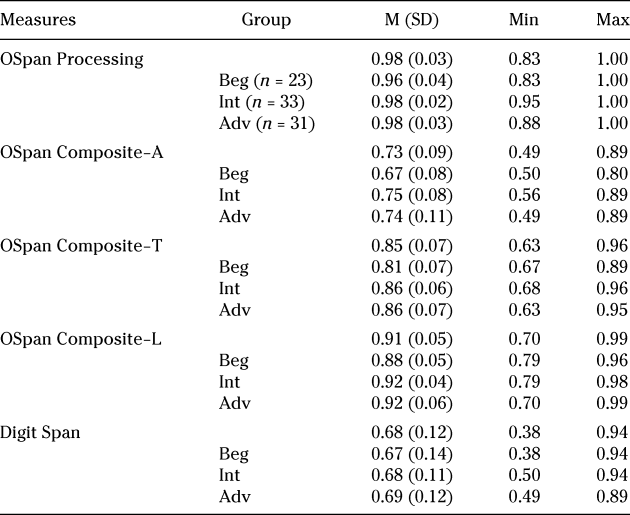
In Table 2, descriptive performance statistics, expressed in percentage scores, are provided for the OSpan (Composite) and digit span tasks.
Descriptive statistics (%) on measures of working memory capacity by group (N = 87)

Note. OSpan, Operation Span; A, Absolute; T, Total; L, Lenient; Beg, Beginning; Int, Intermediate; Adv, Advanced.
As displayed in Table 2, mean performance appears to be similar across groups with somewhat similar variance from the mean. To statistically compare participants’ WMC by group, a series of one-way ANOVAs was run with Group as the Independent variable and OSpan and digit span scores as the Dependent variables. The processing component of the OSpan revealed a significant main effect for Group (F(2, 84) = 6.46, p = .002, η2 = .13) and post hoc Scheffé comparisons showed that scores in the Beginning group were significantly lower than those in both the Intermediate (Mdiff = .023, p = .01, CI 95 = [.005; .042]; SE = .008) and Advanced groups (Mdiff = .025, p = .006, CI 95 = [.006; .044]; SE = .008). For the composite processing and storage scores, the main effect for Group reached statistical significance for the Composite-Absolute (F(2, 84) = 6.29, p = .003, η2 = .13), Composite-Total (F(2, 84) = 3.74, p = .03, η2 = .08), and Composite-Lenient scores (F(2, 84) = 4.17, p = .02, η2 = .09) with the Beginning group’s scores again significantly differing from Intermediate (Mdiff = .081, p = .004, CI 95 = [.022; .141]; SE = .024) and Advanced groups (Mdiff = .068, p = .02, CI 95 = [.007; .128]; SE = .024).
These results could be interpreted as showing that beginners possessed less efficient WM resources than the two higher proficiency groups. However, higher scores in the intermediate and advanced groups may reflect having completed similar memory tests before if they had participated in other research studies. Another plausible explanation could be the relatively smaller sample size for beginners (n = 23), leading to an overall lower range of scores. Given these possibilities, and the fact that standard deviation from the mean was relatively comparable across groups, all OSpan composite scores are maintained in subsequent statistical analyses.
On the measure of PWM (digit span), a one-way ANOVA showed no significant group differences in performance means (F(2, 84) = .91, p = .83). Overall, this learner population is interpreted to possess comparable phonological working memory capacity with some between-group variance in executive function, which may be related to unequal sample sizes.
Test Reliability: Assessment Tasks
Estimates of test reliability for the two dependent measures were calculated using Cronbach’s alpha (α). For the OIT, versions 1 (α = .93), 2 (α = .91), and 3 (α = .93) as well as version 2 of the UGJT (α = .82) were determined to have high internal consistency with alphas above .80 while the other two UGJT versions (V1−α = .75; V3−α = .72) fell within an acceptable range of reliability (.70–.80) according to most authors (Larson-Hall, Reference Larson-Hall2010, p. 171).
Descriptive Statistics: Assessment Tasks
Elicited OIT
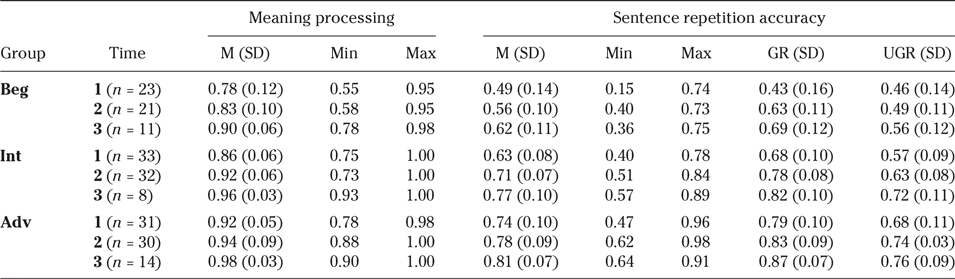
Table 3 reports the descriptive performance statistics by group, testing time, and item type (GR, UGR) for meaning comprehension and sentence repetition accuracy on the OIT, both calculated as percentages (40 points possible).
Descriptive statistics on the oral imitation task (OIT) by group and testing time

Note. Time 1 (Beginning of semester); Time 2 (End of semester); Time 3 (End of holiday break); Beg, Beginning group; Int, Intermediate group; Adv, Advanced Group.
The data presented in Table 3 show that, descriptively, all groups improved in their ability to accurately comprehend sentences they heard aurally and to orally repeat them correctly from the beginning to the end of the fall semester (2.5 months) with continued improvement one month later (3.5 months total). Beginning and intermediate learners’ scores improved 5 to 6% in meaning comprehension and advanced showed a 2% increase. Scores continued to improve at Time 3 by 4% (Int, Adv) and 7% (Beg), with net gains totaling 6% (Adv), 10% (Int), and 12% (Beg). On the sentence repetition component, performance gains were also evident over time. Beginners and intermediate learners respectively increased 7% and 8% while advanced learners gained 4% over the 2.5 month instruction period. One month later, beginners and intermediate learners each improved an additional 6% (equaling 13–14% net increases, respectively), whereas advanced learners gained 3% in accuracy for a 7% net increase. All within- and between-group performance differences reached statistical significance and are reported elsewhere (Serafini, Reference Serafini2013).
UGJT
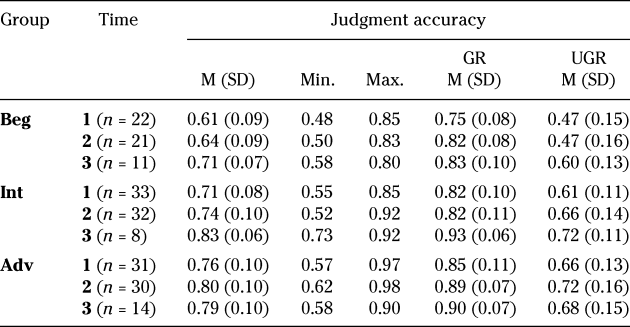
Table 4 reports the descriptive performance statistics on the UGJT by group, testing time, and item type (GR, UGR) as percentage scores (60 points possible).
Descriptive statistics on the UGJT by group and testing time

Note. Time 1; Time 2; Time 3; Beg, Beginning group; Int, Intermediate group; Adv, Advanced Group; GR, grammatical; UGR, ungrammatical.
Table 4 shows that by group, beginners and intermediate learners increased 3% in accuracy and advanced learners gained 4% over the semester. One month after the end of instruction, beginners improved an additional 7% and intermediate learners gained 9% in accuracy (10–12% net increases, respectively) but advanced learners decreased by 1% in accuracy at Time 3 (for a net 3% gain). Again, statistical within- and between-group performance differences are reported elsewhere as they are not the focus of the current study.
Results: Research Question 1
To address research questions 1 and 1(a) inquiring about the role of executive function, Pearson Product moment bivariate correlations were run both across groups and by proficiency group with composite scores on the OSpan task and mean accuracy on the elicited OIT and UGJT at each testing time as well as with calculated gain scores over time. Separate correlations were run for overall and GR/UGR item accuracy to better identify the nature of the relationship.
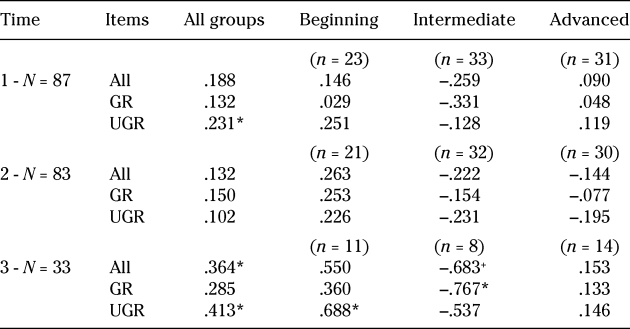
The correlation matrix for the OSpan and mean performance on the OIT by testing time and group is presented in Table 5. All r values reported are based on the composite OSpan-L (Lenient) given that relationships with OIT performance were more consistent with this scoring method. The only significant relationship with gain scores is noted in the following text.
Correlation matrix: OSpan and mean performance on the OIT by group and testing time

Note. OSpan, Operation Span; GR, Grammatical exemplars; UGR, Ungrammatical exemplars.
Correlation (r) is significant at the 0.01** level (2-tailed).
Correlation (r) is significant at the 0.05* level (2-tailed).
+ p = .06.
As can be seen in Table 5, a weak but significant relationship emerged between EF and performance on UGR items at the outset of the learning period (Power = 58%). However, no relationships by group were found, although the r value for the beginning group (.251) looks promising. At the end of the instructional period 2.5 months later, no significant relationships were found although the r values for the beginning group (r = .226–.263) again appear promising. One month after a holiday break without instruction (i.e., 3.5 months from the outset of the study), EF significantly correlated with performance on UGR items across groups (Power = 67%), accounting for the weak association with overall performance (Power = 55%). By group, a positive relationship between EF and UGR items was found for beginners (Power = 67%) while a significant negative relationship between EF and GR items emerged for the intermediate group (Power = 62%) meaning the lower their scores on the OSpan, the higher their performance on GR items. While this is a somewhat unexpected result, it is important to keep in mind the extremely low sample size for this group at T3 (n = 8).
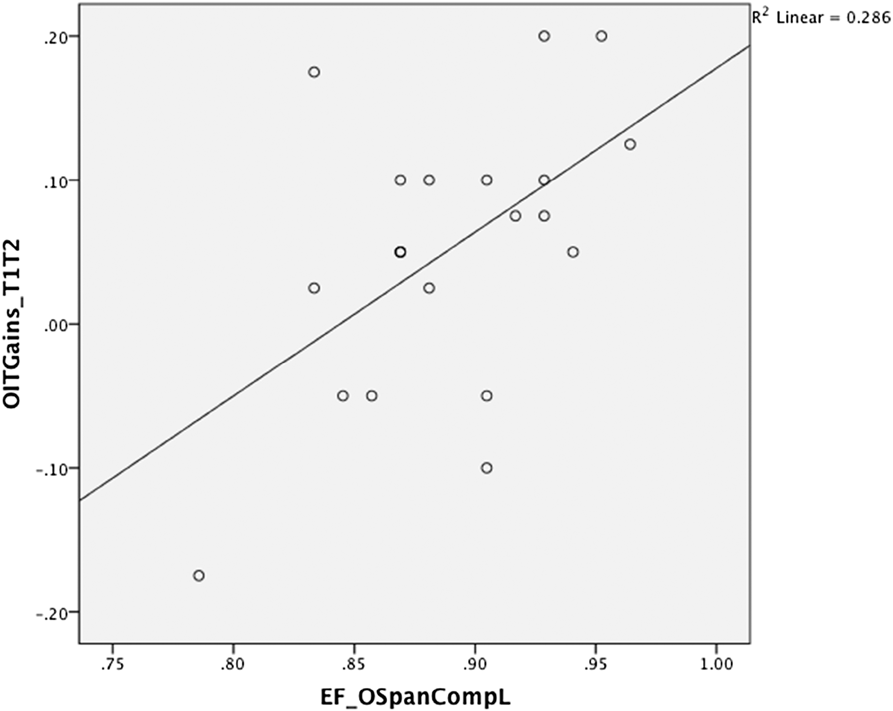
In terms of gain scores on the OIT (all items), the only significant relationship to emerge with EF was found for beginners from the beginning to the end of the semester (r = .535, p = .013, n = 21, Power = 72%) meaning that the more efficient their cognitive resources, the higher their development in grammatical accuracy over the 2.5-month instructional period. The scatterplot provided in Figure 1 depicts the linearity of this relationship.
Relationship between gain scores on the OIT (Time 1-Time 2) and EF (OSpan) for the beginning group.

By contrast, for the two higher proficiency groups, EF was significantly negatively related to gain scores on the OIT from Time 1 to Time 2 for advanced learners (r = –.441, p = .015, n = 30) and from Time 1 to Time 3 for intermediate learners (r = –.931, p = .001, n = 8), indicating that less efficient cognitive resources may be more beneficial to gains for the two higher proficiency groups. However, again the extremely low sample size for the intermediate group at Time 3 calls the validity of this result into question.
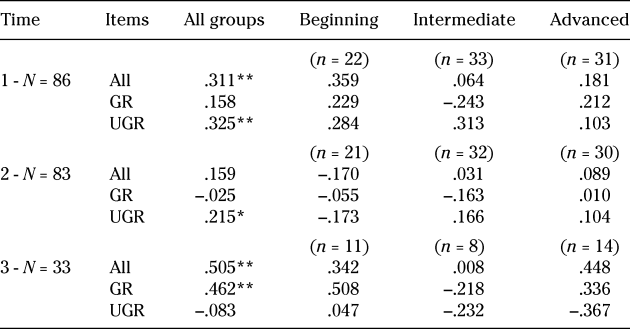
The correlation matrix for the OSpan and mean performance on the UGJT is presented in Table 6. All r values reported are based on composite OSpan-A (Absolute) scores given that relationships with UGJT performance were more consistent with this scoring method. No relationships between EF and gain scores on the UGJT were found for any group.
Correlation matrix: OSpan and mean performance on the UGJT by group and testing time

Note. OSpan, Operation Span; GR, Grammatical exemplars; UGR, Ungrammatical exemplars.
Correlation (r) is significant at the 0.01** level (2-tailed).
Correlation (r) is significant at the 0.05* level (2-tailed).
At the outset of instruction, robust relationships between EF and overall performance on UGR items on the UGJT were found with high power (> 80%). While these again lost significance by individual group, r values for beginners (All—.359; UGR—.284) and intermediate learners (UGR—.313) indicate medium effect sizes. At the end of the semester, a weak but significant association was found between EF and UGR exemplars across groups. In the last testing session, EF was significantly associated with performance on all items (Power = 86%) and, in contrast to the general trend, the relationship reached significance for GR items only (Power = 78%). The r values for beginning (All—.342; GR—.508) and advanced groups (All—.448; GR—.336) appear to account for these strong relationships found across groups at T3.
Results: Research Question 2
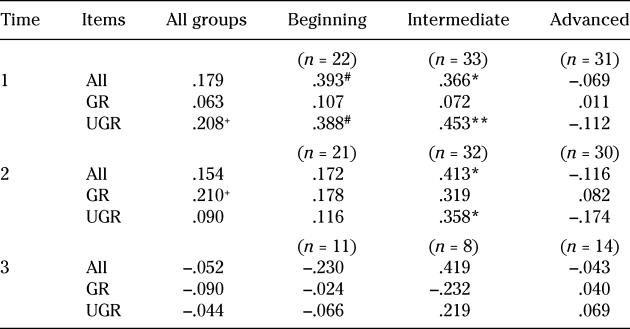
To address research questions 2 and 2(a) inquiring about the role of the phonological loop component of WMC, Pearson Product moment bivariate correlations were run both across and by group with scores on the digit span task and mean accuracy on performance tasks at each testing time and over time. The correlation matrix for the digit span and mean performance on the OIT is presented in Table 7. Significant relationships with calculated gain scores are subsequently reported in the text.
Correlation matrix: Digit span and mean performance on the OIT by group and testing time

Note. OSpan, Operation Span; GR, Grammatical exemplars; UGR, Ungrammatical exemplars.
Correlation (r) is significant at the 0.01** level (2-tailed).
Correlation (r) is significant at the 0.05* level (2-tailed).
+ p = .06; # p = .07.
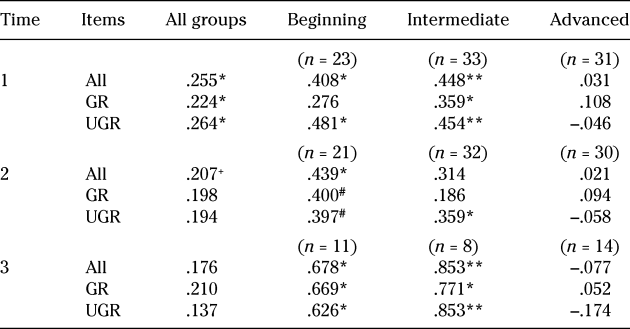
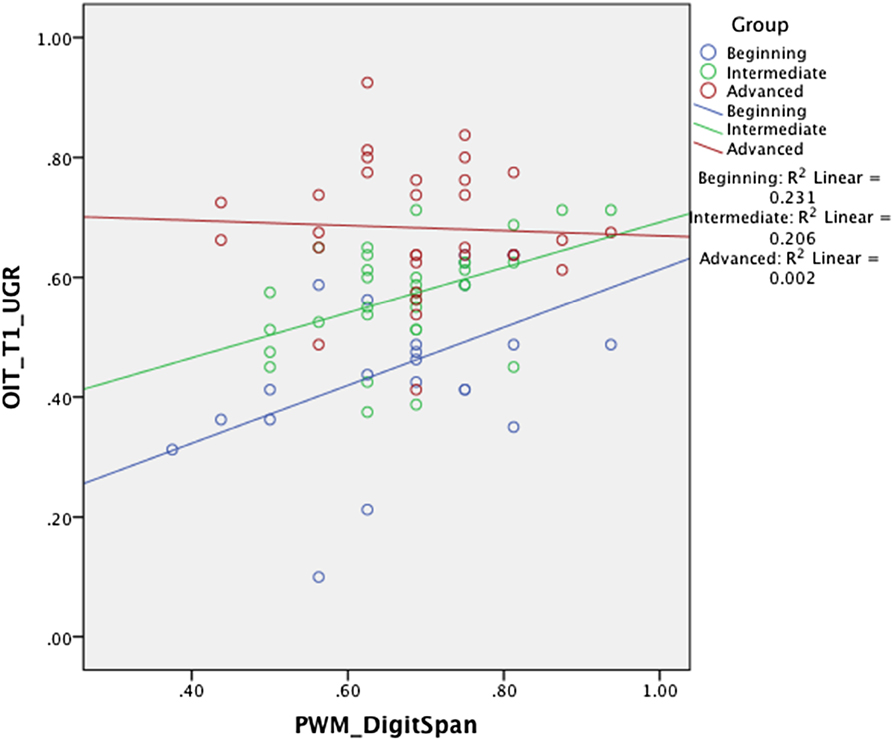
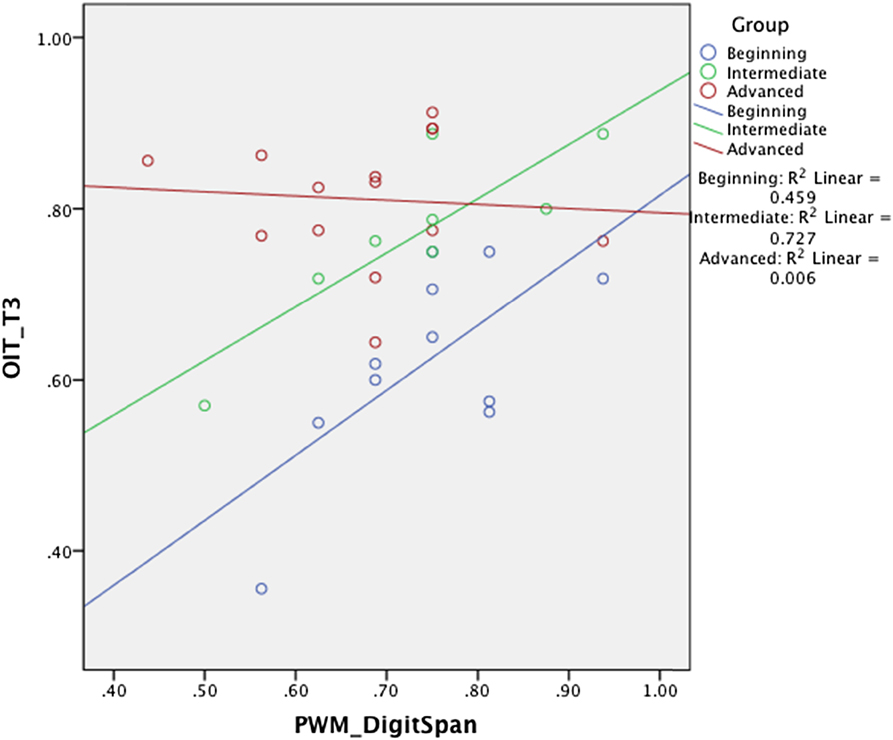
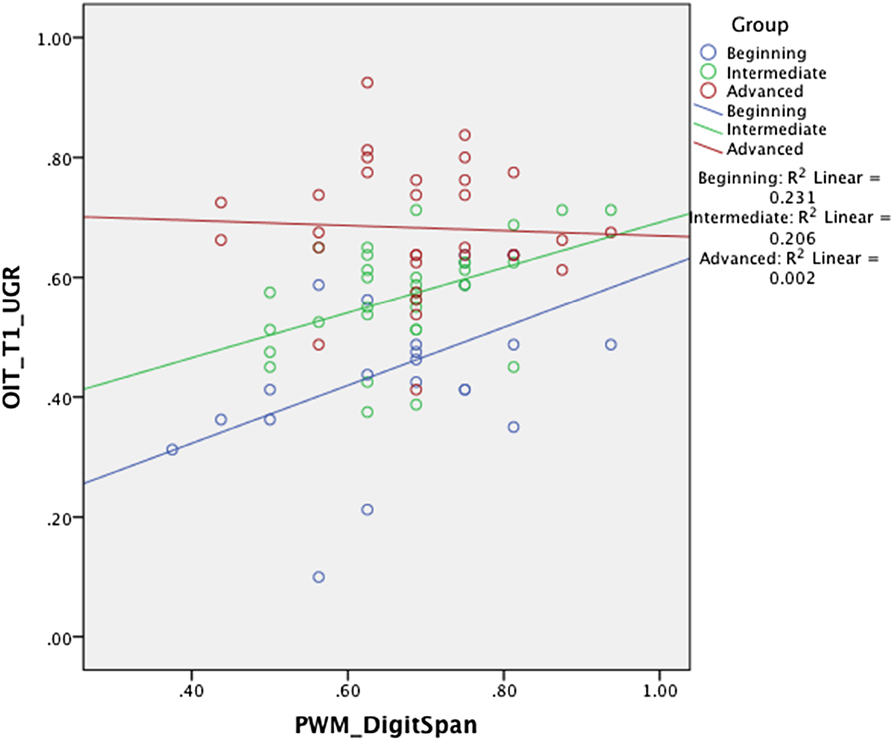
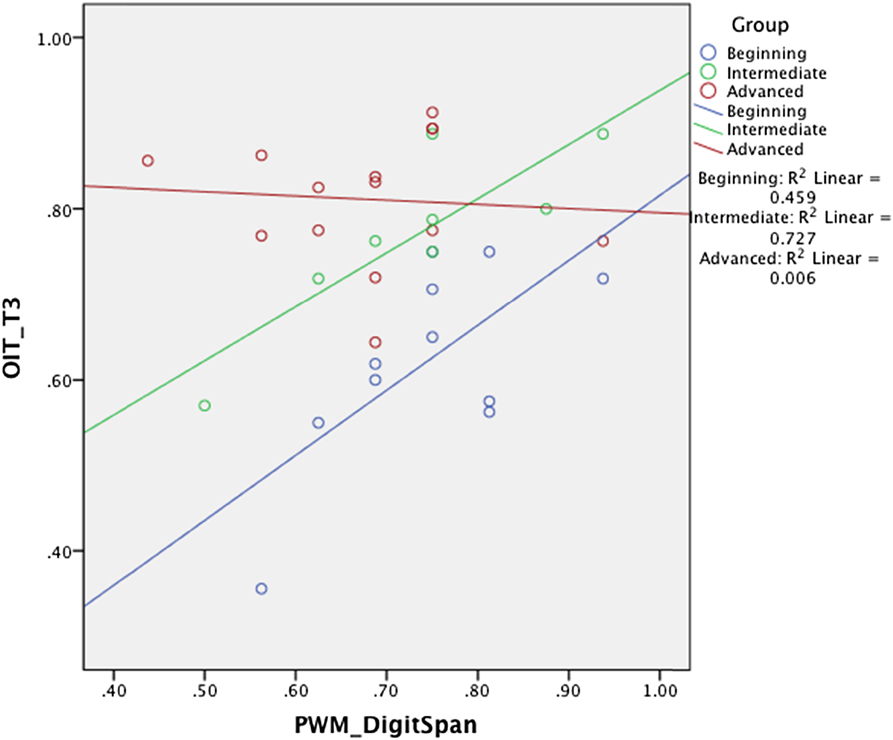
As Table 7 shows, significant positive associations between PWM and performance on the OIT at the start of the semester were found regardless of item type, though power was highest for performance on UGR exemplars (70%). These relationships were robust for the two lower proficiency groups only, with 65% and 77% power. After a 2.5-month period of instruction, positive relationships remained significant for overall performance for beginners and UGR items for intermediate learners with low power (51–52%). Three and a half months after instruction began, significant positive relationships with overall accuracy obtained for beginning (Power = 65%) and intermediate learners (Power = 81%) only. In Figures 2 and 3, robust relationships found with PWM at Times 1 and 3 for learners at lower proficiency are visually contrasted with the nonlinear association found for advanced learners.
Relationship between performance at Time 1 on the OIT (UGR items) and PWM (Digit span) by group.
Relationship between performance at Time 3 on the OIT (All items) and PWM (Digit Span) by group.
In terms of gain scores, PWM and improvement on the OIT from T1 to T3 obtained significance across groups (T1−T3, r = .377*, p = .031, n = 33). That is, the higher a learner’s PWM, the more they improved in sentence repetition accuracy over the entire span of the study. However, this relationship did not reach significance by group.
The correlation matrix for the digit span and mean performance on the UGJT is presented in Table 8.
Correlation matrix: Digit span and mean performance on the UGJT by group and testing time

Note. OSpan, Operation Span; GR, Grammatical exemplars; UGR, Ungrammatical exemplars.
Correlation (r) is significant at the 0.01** level (2-tailed).
Correlation (r) is significant at the 0.05* level (2-tailed).
+ p = .06; # p = .07.
Table 8 shows that at the outset of instruction, PWM was again significantly related to performance on UGR items for intermediate learners (Power = 76%) and approached significance for beginners. After 2.5 months of instruction, relationships between PWM and overall performance and UGR items held for the intermediate group only, albeit with lower power (62% and 52%, respectively). PWM did not reach significance at T3 for any group although the effect size for the intermediate group is high (.419). No relationships between PWM and gain scores on the UGJT were evident.
Results: Research Question 3
To answer research question 3 addressing the relative predictive power of L1 EF and L1 PWM, a series of sequential (hierarchical) multiple regression analyses were run with accuracy scores on the OIT and UGJT at each testing time as well as with gain scores over time. Sequential regressions are ideal when more than one explanatory variable overlaps with the response variable and when predictor variables (i.e., EF, PWM) share a significant amount of variance, as is the case in this learner sample (r = .857**).
The scores on the OSpan (A, L) and digit span tasks with the strongest correlations based on effect size (r) and power were entered in the first step of the regression model and scores with significant, though weaker, relationships were entered into the second steps to identify any unique variance explained. Unless otherwise noted, regressions are run with UGR item accuracy because they produced the most robust and consistent relationships. Also, given the lack of meaningful correlations found at the end of instruction (T2), only regression results for performance at the first and last testing times are reported in the following tables.
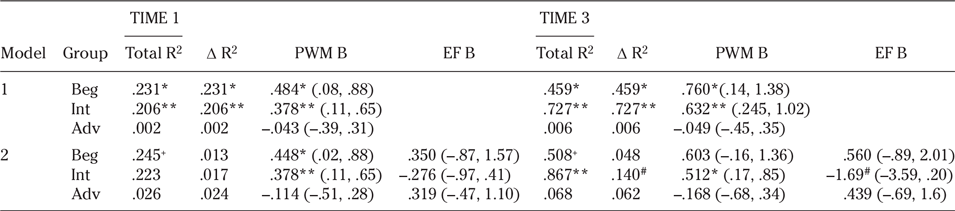
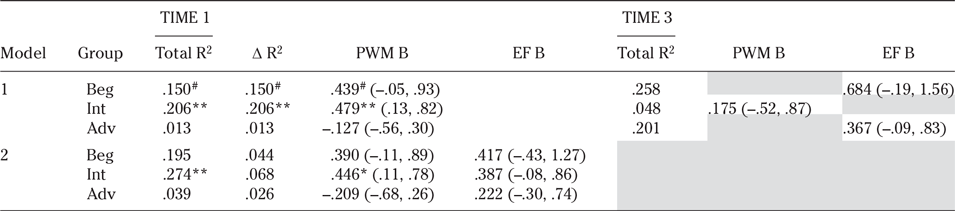
Once each model was run, output was further examined to assess the distribution of the data and test regression assumptions. Footnote 6 In Tables 9 and 10, information provided in each step of the model includes (a) Total R2, or how much performance variance is explained by variance in the predictor variable(s); (b) Δ R2, or the unique contribution of each variable to the overall R2; (c) unstandardized coefficients (B); (d) the significance of B (t-test); and (e) 95% Confidence Intervals (CIs), or the range of plausible values for B. As many researchers in L2 research have argued (e.g., Plonsky & Gass, Reference Plonsky and Gass2011; Plonsky & Oswald, Reference Plonsky and Oswald2014), CIs are more informative than a p value alone by indicating amount of sampling error and an effect with high power will have a narrower CI range.
Cognitive explanatory model: Oral imitation task

Note. PWM, Phonological working memory; EF, Executive function; Beg, Beginning; Int, Intermediate; Adv, Advanced.
p value is significant at the 0.01** level (2-tailed).
p value is significant at the 0.05* level (2-tailed).
+ p = .06; # p = .07.
Cognitive explanatory model: Untimed grammaticality judgment task

Note. PWM, Phonological working memory; EF, Executive function; Beg, Beginning; Int, Intermediate; Adv, Advanced.
p value is significant at the 0.01** level (2-tailed).
p value is significant at the 0.05* level (2-tailed).
# p = .07.
Table 9 reports the cognitive explanatory model for performance by proficiency group on the OIT. For the sake of comparison, regression data are included for advanced learners despite a lack of association between WMC and L2 performance.
In the first model, PWM explains a medium to large amount of performance variance on the OIT (UGR items) (20–23%) at the outset of the semester for the two lower proficiency groups when entered as the only explanatory variable. The narrow CIs (<1) further increase confidence in the predictive power of PWM at Time 1. In the second model, EF contributes a minimal portion of additional variance (1–2%) while PWM remains a significant predictor for both lower level groups. In contrast, neither PWM nor EF predicts performance for advanced learners.
Three and a half months later (T3), PWM actually increases in predictive power, accounting for almost half of the performance variance on the OIT (UGR) for the beginners (46%) and an astonishing 73% variance for intermediate learners. The small CI ranges indicate high power for this effect though caution is warranted as participant numbers at T3 (n = 11, 8) risk violating the minimal sample size assumption of 10 learners per explanatory variable (Howell, Reference Howell2008). In the second model, EF accounts for an additional 5 to 6% of variance for beginners and advanced learners, respectively, but the model loses predictive power for beginners when EF is entered. For the intermediate group at T3, EF accounts for an additional 14% variance and the model remains significant, accounting for 87% total R2.
A series of standard regressions were run to determine whether PWM and EF significantly predicted learners’ gain scores over time on the OIT. Results showed that PWM predicted a medium to large amount of total variance in overall gain scores across groups from T1 to T3 (R2 = .142*; B = .308*; CI 95 = [.03; .59]) while EF accounted for a large amount of variance in overall gain scores from the beginning to the end of instruction for beginners (R2 = .286**; B = 1.14**; CI 95 = [.28; 2.00]) and a medium amount of variance for advanced learners (R2 = .194*; B = -.650*; CI 95 = [–1.16; –.14]), though the former relationship was positive and the latter was negative.
Table 10 reports the cognitive explanatory model for performance by group on the UGJT at the first and last testing times. PWM is again entered in the first step of the sequential model at Time 1 based on strength of relationships. However, at Time 3, standard regressions were run as EF was the only variable with potentially meaningful, though not significant relationships for the beginning (r = .508) and advanced groups (r = .448) and PWM was the only variable to produce meaningful associations for intermediate learners (r = .419). With more participants these relationships would likely reach high power (>80%).
In the first model, PWM explains a significant medium to large amount of performance variance (21%) on the UGJT (UGR) at T1 for the intermediate group with a low range of CIs, while explaining slightly less variance for beginners (15%). When EF is entered in Model 2, it explains an additional 3 to 7% variance though Δ R2 is nonsignificant. PWM remains a significant predictor only for the intermediate group in Model 2, accounting for a large portion of variance (27%). At the final testing time, EF predicts a large amount of variance in accuracy for GR items for beginners (26%) and a medium amount of variance in overall accuracy for the advanced group (20%), though these do not reach significance, and PWM only accounts for a small portion of variance (5%) for intermediate learners. Regressions were not performed with gain scores on the UGJT given the lack of associations found.
DISCUSSION
The current study aimed to account for variability in adult L2 development by identifying relationships with working memory capacity. To better understand this phenomenon, the study took a longitudinal perspective and differentiated the relative impact of its components by learner proficiency level, allowing for a more dynamic understanding of the relationship between WMC and inter- and intraindividual variation in language development. Specifically, the study is the first to compare learners at a range of L2 proficiency from beginner to advanced levels relying on performance data from a set of shared assessment measures and cognitive tasks, while controlling for methodological variables like the language in which WMC is measured.
Correlational and regression analyses revealed several relationships between L1 EF (measured using a nonverbal operation span task) and L1 PWM (measured using a nonverbal digit span task) and performance on two tests assessing knowledge of L2 Spanish grammar, specifically the ability to aurally comprehend and verbally repeat (OIT) or receptively judge written target stimuli (UGJT). Importantly, results clearly showed that (a) learner skill level, (b) performance task demands, (c) testing time, and (d) item grammaticality were key factors mediating the impact of WM components. Findings related to each of these factors are discussed in turn as they relate to theory and previous empirical research.
Working Memory and L2 Proficiency
A consistent finding of the study is that a more efficient ability to code, store, and retrieve information (i.e., EF), particularly the capacity to encode, store, and rehearse sounds (i.e., PWM), significantly facilitated morphosyntactic development for learners with less exposure to and practice in L2 Spanish. This finding not only extends previous research on language aptitude reporting high correlations with instructed language learning outcomes for learners in the early stages of development (Dörnyei & Skehan, Reference Dörnyei, Skehan, Doughty and Long2003; Li, Reference Li2014; Sawyer & Ranta, Reference Sawyer, Ranta and Robinson2001; Skehan, Reference Skehan1989, Reference Skehan1998, Reference Skehan and Robinson2002), but crucially supports a growing body of empirical evidence reporting positive WM effects for grammatical development in beginning and intermediate learners (Dussias & Piñar, Reference Dussias and Piñar2010; Kempe & Brookes, 2008; Kempe, Brooks, & Kharkhurin, Reference Kempe, Brooks and Kharkhurin2010; Kormos & Sáfár, Reference Kormos and Sáfár2008; Linck & Weiss, Reference Linck, Weiss, Sanz and Leow2011; Sagarra, Reference Sagarra and Han2008; Sagarra & Herschensohn, Reference Sagarra and Herschensohn2010; Williams & Lovatt, Reference Williams and Lovatt2003; Winke, Reference Winke2005).
In contrast, for learners with the most exposure to and practice in L2 Spanish, WMC played a minimal role in explaining L2 development, parallel to other studies reporting a lack of relationships (with L1 WMC) for more advanced learners (e.g., Coughlin & Tremblay, Reference Coughlin and Tremblay2013; Foote, Reference Foote2011; Grey et al., Reference Grey, Cox, Serafini and Sanz2015; Hummel, Reference Hummel2009). Though this result was strikingly consistent across tests and testing times, it is important to consider that advanced learners completed the same performance tasks as their less proficient peers with such tasks targeting a range of early and late-acquired morphosyntactic structures that differed in form-meaning complexity. As argued by DeKeyser (Reference DeKeyser and DeKeyser2005) complex morphosyntax causes persistent challenges for L2 learners whose primary language has less rich inflectional systems and these challenges are most acute in the initial stages of learning when morphology is not a salient cue for meaning. Thus, it is more likely that a relationship between variation in grammatical performance and variation in cognitive ability would obtain for lower level learners who have less exposure to and practice using Spanish grammar. In the same vein, advanced learners’ higher overall scores and lower performance gains over time indicate that task demands were less challenging, which also begs the question of whether WM would have yielded relationships at the advanced level with more challenging tasks requiring, for example, spontaneous oral production as elicited by narrative speech tasks used in other studies (e.g., O’Brien, Segalowitz, Collentine, & Freed, Reference O’Brien, Segalowitz, Collentine and Freed2006; O’Brien et al., Reference O’Brien, Segalowitz, Freed and Collentine2007).
However, current findings contradict other studies reporting no WM effects for lower level L2 learners (e.g., Juffs, Reference Juffs2004, Reference Juffs2005; Roehr & Gánem-Gutiérrez, Reference Roehr and Gánem-Gutiérrez2009; Sagarra, Reference Sagarra2000) and positive relationships (with L1 WMC) at higher proficiency (e.g., Havik et al., Reference Havik, Roberts, van Hout, Schreuder and Haverkort2009; Linck et al., Reference Linck, Hughes, Campbell, Silbert, Tare, Jackson and Doughty2013b; O’Brien et al., Reference O’Brien, Segalowitz, Collentine and Freed2006; Winke, Reference Winke2005). While Coughlin and Tremblay (Reference Coughlin and Tremblay2013) and Erçetin and Alptekin (Reference Erçetin and Alptekin2013) also found positive WM effects for advanced learners, they measured WMC in the L2 and thus results are not directly comparable. Other key methodological limitations limiting interpretation of findings include conflating L1 and L2 WM span (Havik et al., Reference Havik, Roberts, van Hout, Schreuder and Haverkort2009) and not employing dual-task methodology in measurement and scoring (Roehr & Gánez-Gutiérrez, Reference Roehr and Gánem-Gutiérrez2009; Sagarra, Reference Sagarra2000), which both hinder construct validity (Logie, Reference Logie2011; Van den Noort et al., Reference Van den Noort, Bosch and Hugdahl2006). In other studies, the actual skill level of learners is not entirely clear. For example, learners in Juffs’s studies may actually be more advanced than indicated in the description, which would align with current findings.
Other typical methodological differences between tasks used may explain discrepancies, supporting the proposed interaction between WM components and task characteristics (Robinson, Reference Robinson2005; Sanz, Reference Sanz, Glass and Pérez-Lerroux1997; Wen, Reference Wen2012). For example, studies employing an open-ended communicative task have reported that PWM is positively related to oral fluency and accuracy in L2 Spanish at high proficiency (e.g., O’Brien et al., Reference O’Brien, Segalowitz, Collentine and Freed2006). Such tasks clearly contrast the demands of the controlled oral repetition task used here. It may be that tasks eliciting spontaneous production rather than structured repetition are more likely to push the limits of WMC in learners at advanced proficiency. Standardized tests probing the four skills may also be more likely to reveal positive effects for advanced learners, as Winke (Reference Winke2005) found for PWM and listening ability. However, Winke investigated L2 Chinese, which requires the acquisition of characters. Thus, the role of phonological processing ability could play a more persistent role at advanced stages of learning Chinese but less so with Romance languages that do not require learning a novel script.
The current data clearly show that the explanatory power of WMC decreases as L2 proficiency increases in this learner sample. However, the interaction between WMC and the demands of the tasks used in the study is important to consider given that adults rely on different cognitive resources as they progress in development (Robinson, Reference Robinson2001, Reference Robinson2005, Reference Robinson and Chapelle2013).
Working Memory and Task Demands
Beginners and intermediate learners in this study clearly relied on their PWM to carry out the OIT, a reconstructive task (Erlam, Reference Erlam2006; Spada, Reference Spada2013) that requires learners to aurally process incoming acoustic input, make online sound-symbol connections, and immediately orally reproduce what they heard accurately. Such dual online requirements are likely to push and exceed WM limitations (Sawyer & Ranta, Reference Sawyer, Ranta and Robinson2001), especially for less proficient learners, and reinforces the asserted importance of phonetic coding in processing auditory input in real time (Skehan, Reference Skehan1998, Reference Skehan and Robinson2002) as well as sequencing, or chunking ability in adults (N. C. Ellis & Sinclair, Reference Ellis and Sinclair1996).
PWM was also implicated in performance on the written UGJT, particularly for intermediate learners. In this offline task, learners read, rather than heard, sentences and had more time to make a receptive judgment about grammaticality. This finding underscores that variation in phonological loop function underlies aspects of L2 learning beyond phonological processing and vocabulary learning (e.g., Baddeley, Gathercole, & Papagno, Reference Baddeley, Gathercole and Papagno1998; N. C. Ellis, Reference Ellis2012), including grammatical rule learning (Williams & Lovatt, Reference Williams and Lovatt2003), generalization (Martin & Ellis, Reference Martin and Ellis2012), and productive grammatical accuracy (N. C. Ellis & Sinclair, Reference Ellis and Sinclair1996). This study extends PWM’s significance to receptive grammatical accuracy for lower level learners, though whether the advantage of enhanced articulatory rehearsal lies at input or output still remains to be determined (N. C. Ellis & Sinclair, Reference Ellis and Sinclair1996, p. 243).
Executive function also played a facilitative role for less proficient learners though effect sizes were small to medium. Nonetheless, EF was the only variable to positively predict variance in development on the OIT over the semester for beginners, similar to what Linck and Weiss (Reference Linck, Weiss, Sanz and Leow2011) found for the development of explicit knowledge in low-level L2 learners of German and Spanish. This is expected, at least theoretically, given the involvement of EF in regulating actions under controlled, conscious processing (e.g., Baars, Reference Baars and Osaka2003; Baars & Franklin, Reference Baars and Franklin2003; N. C. Ellis, Reference Ellis2005). Therefore, the untimed, offline UGJT, which invites conscious reflection on form, would be expected to produce stronger relationships with EF compared to the online OIT performed under time pressure with a focus on meaning. However, this assumption was not born out in the data, indicating that beginning learners relied heavily on controlled attentional processing (Engle, Kane, & Tuholski, Reference Engle, Kane, Tuholski, Miyake and Shah1999) to monitor their speech production while completing the OIT.
The predictive capacity of EF on the OIT for beginners aligns with previous research that questions the validity of interpreting the OIT as a measure of “implicit” knowledge in lower level instructed learners (Shiu & Spada, Reference Shiu and Spada2012; Spada, Reference Spada2013; Reference Suzuki and DeKeyserSuzuki & DeKeyser, in press). By contrast, advanced learners with more efficient EF were found to gain less in accuracy on the OIT from the beginning to the end of the semester and this negative relationship had medium power, which seems to support a “less is more” view (Miyake & Friedman, Reference Miyake, Friedman, Healy and Bourne1998). However, this conclusion is premature given previous research reporting a robust role for WMC in both less and more proficient learners (e.g., Linck et al., Reference Linck, Osthus, Koeth and Bunting2013a) and the fact that performance tasks used here may not have been challenging enough to elicit WM effects at high proficiency, as argued previously. Another possible explanation for the differential impact of EF in regulating attentional resources on the OIT is that less proficient learners drew on explicit knowledge while completing the task whereas advanced learners drew on automatized explicit knowledge (Serafini, Reference Serafini2013; Spada, Reference Spada2013), thus diminishing the role of EF and the amount of attention required to complete the task. Nonetheless, this issue remains an open, empirical question and requires oral latency data to sufficiently address it.
The Role of Working Memory over Time
Interestingly, the strength and durability of relationships found in the lower level groups varied over time with moderate to strong relationships at the outset of instruction and 3.5 months later and relatively weaker relationships at the end of instruction. This finding indicates that a semester of exposure to Spanish in a classroom setting may have neutralized the facilitative role of WMC, echoing claims that explicit L2 instruction with grammatical explanation “levels the playing field” in lessening the impact of learner aptitude (Erlam, Reference Erlam2005; Sanz et al., Reference Sanz, Lin, Lado, Bowden and Stafford2014). Moreover, this study shows that WMC mediates learners’ ability to accurately retrieve their knowledge of Spanish grammar after one month without L2 exposure and extends previous research reporting that WMC mediates retention of L2 learning on delayed posttests two weeks after an instructional intervention (Erlam, Reference Erlam2005; Robinson, Reference Robinson and Robinson2002, Reference Robinson2005; Sanz et al., Reference Sanz, Lin, Lado, Bowden and Stafford2014). While an “encoding-dominated” perspective (Skehan, Reference Skehan1998) in WM research remains pervasive, as represented in self-paced reading designs, significant relationships found between WMC and retention underscore the retrieval function of WMC in accessing stored long-term knowledge relevant to the tasks at hand (Baddeley & Logie, Reference Baddeley, Logie, Miyake and Shah1999). However, it is important to keep in mind that performance at Time 3 only reflects a third of the total learner sample, warranting caution.
Working Memory and Item Grammaticality
Finally, a novel finding of this study is that the most robust and consistent relationships found with L2 performance pertained to sentences that were ungrammatical in Spanish, which required learners to make a verbal correction (OIT) or a receptive judgment (UGJT). While little to no empirical research to date addresses this question, this finding indicates that grammaticality interacts with cognitive resources in determining L2 grammatical performance. Other studies (e.g., Zalbidea, Faretta-Stutenberg, Issa, & Bartlett-Hsu, Reference Zalbidea, Faretta-Stutenberg, Issa and Bartlett-Hsu2014) have observed the same phenomenon and speculated that because learners tend to endorse sentences by default, more variation in performance is expected to arise for UGR items, and thus, relationships may be more likely to emerge with variation in ID variables. Alternatively, as proposed by R. Ellis (Reference Ellis2004), UGR items are more likely to tap learners’ explicit knowledge while GR items are more likely to tap implicit knowledge, as Gutiérrez (Reference Gutiérrez2013) found in his study. If so, this finding underscores a more robust role for WMC in conscious processing and performance (e.g., Baars, Reference Baars and Osaka2003; Baars & Franklin, Reference Baars and Franklin2003), specifically by lower level learners, and implies that analyzing performance by grammaticality of test items is methodologically desirable in order to reveal effects with cognitive learner differences, if they exist. Overall, results in this area are exploratory but warrant further replication.
LIMITATIONS AND DIRECTIONS FOR FUTURE RESEARCH
This study indicates that limited cognitive capacity in adults indeed constrains development in the early stages of language development, but may matter less at later stages. While this finding advances our ability to make informed predictions about individual differences between learners (Roberts & Meyer, Reference Roberts and Meyer2012), our results are not universally applicable; rather, they are specific to the population of L1 English learners of L2 Spanish studying in an instructed university setting, which according to the most recent MLA report (2013), had reached 790,756 in the United States alone at the time these data were collected.
Future studies should endeavor to investigate the impact of WMC over a longer period of L2 development, given the current investigation period (3.5 months, or a semester and the break that followed) was relatively short compared to other quantitative longitudinal research (Ortega & Iberri-Shea, Reference Ortega and Iberri-Shea2005). Studying this relationship over 6 months or a year or more would yield more data points and allow for more complex, nonlinear L2 development to emerge, thus providing a more sophisticated picture of the extent to which relationships with cognitive capacity endure, or fluctuate, over the course of L2 development.
Finally, this study measured performance of a range of target structures rather than isolating one or two specific targets. While providing a comprehensive look at learner performance at different stages of morphosyntactic development, the overall number of item exemplars could be increased if fewer target structures were analyzed, thereby strengthening confidence in results. This approach would also help determine the extent of interaction between WMC and increasing linguistic complexity (Williams, Reference Williams, Gass and Mackey2012).