As universities and other postsecondary institutions seek to attract an increasingly diverse student body, they face the responsibility of providing valid assessments of incoming students' language ability, especially when the students' mother tongue is not the language of instruction (Cheng, Myles, & Curtis, Reference Cheng, Myles and Curtis2004). There have been attempts to develop technology-based, automated assessment instruments for spoken English (Downey, Farhady, Present-Thomas, Suzuki, & Van Moere, Reference Downey, Farhady, Present-Thomas, Suzuki and Van Moere2008). However, the most commonly used second language (L2) speaking tests in academic settings, whether they rely on recorded speaking prompts (e.g., Test of English as a Foreign Language [TOEFL] Internet-Based Test, Test of Spoken English [TSE]) or on face-to-face interaction (e.g., International English Language Testing System [IELTS]), are scored by human raters (Templer, Reference Templer2004). Rater judgments in academic settings are central to high stakes decisions, including whether a candidate is admitted to the university, placed in a remedial language course, or awarded a teaching assistantship.
Although rater judgments are often used as the chief source of evidence of L2 speakers’ language proficiency in academic settings, such judgments might not always be reliable (e.g., when scoring is not internally consistent) or valid (e.g., when scoring is influenced by factors extraneous to the construct being measured). That is, raters’ judgments might reflect not simply speakers’ performance, but also individual differences among raters themselves. For example, ongoing validation research of standardized L2 tests such as the TOEFL, TSE, and IELTS has revealed various sources of rater variability (Brown, Iwashita, & McNamara, Reference Brown, Iwashita and McNamara2005; Myford & Wolfe, Reference Myford and Wolfe2000; Taylor, Reference Taylor, Taylor and Falvey2007), including raters’ experience (Cumming, Reference Cumming1990), gender (O'Loughlin, Reference O'Loughlin, Taylor and Falvey2007), the relative weight they place on different scoring criteria (Eckes, Reference Eckes2008), and their native (first) language (L1) background (Kim, Reference Kim2009). What is not known, however, is whether other sources of rater variability, for example, those related to individual differences in raters’ cognitive abilities (e.g., phonological memory, attention control, or music aptitude), also influence raters’ assessments of spoken language.
In the present study, we therefore investigated whether individual differences in raters’ phonological memory (auditory working memory capacity), attention control (ability to allocate attention efficiently), or musical skill (musical aptitude) influence raters’ judgments of L2 speech on dimensions of accentedness, comprehensibility, and fluency. Accentedness is defined here as listeners’ judgments of how closely the pronunciation of an utterance approaches that of a native speaker (Munro & Derwing, Reference Munro and Derwing1999). Comprehensibility refers to listeners’ perceptions of how easily they understand an utterance (Munro & Derwing, Reference Munro and Derwing1999). Fluency denotes listeners’ assessments of how smoothly and rapidly an utterance is spoken (cf. Derwing, Rossiter, Munro, & Thomson, Reference Derwing, Rossiter, Munro and Thomson2004). Our overall goal was to determine how phonological memory, attention control, and musical ability could contribute to listeners’ perceptual judgments of L2 speech and, as a result, could influence their scoring decisions.
PHONOLOGICAL MEMORY
Phonological memory (also referred to as phonological short-term memory) refers to a language user's capacity to retain spoken sequences temporarily in a short-term memory store. This capacity is usually associated with the phonological loop, a subcomponent of the human working memory system responsible for temporary storage of verbal–acoustic information (Baddeley, Reference Baddeley2003; Baddeley & Hitch, Reference Baddeley, Hitch and Bower1974). Often measured in terms of language users’ ability to recall digits or repeat nonwords, phonological memory is a strong predictor of vocabulary knowledge in both L1 and L2 (French & O'Brien, Reference French and O'Brien2008; Gathercole, Hitch, Service, & Martin, Reference Gathercole, Hitch, Service and Martin1997; Masoura & Gathercole, Reference Masoura and Gathercole2005). Other evidence has implicated phonological memory in the development of L2 grammar (Ellis & Sinclair Reference Ellis and Sinclair1996; O'Brien, Segalowitz, Collentine, & Freed, Reference O'Brien, Segalowitz, Collentine and Freed2006; Trofimovich, Ammar, & Gatbonton, Reference Trofimovich, Gatbonton and Segalowitz2007) and L2 speaking (Fortkamp, Reference Fortkamp1999; O'Brien, Segalowitz, Freed, & Collentine, Reference O'Brien, Segalowitz, Freed and Collentine2007). Phonological memory is also a predictor of overall L2 learning success, as assessed through classroom grades or standardized tests (Kormos & Sáfár, Reference Kormos and Sáfár2008). In this study, we hypothesized that phonological memory plays a role in listeners’ perceptual judgments of L2 accentedness, comprehensibility, and fluency.
The link between phonological memory and speech perception is well established. Early experiments showed that listeners perceive speech in a speech-specific manner, relying on phonological memory to do so. For example, Baddeley, Lewis, and Vallar (Reference Baddeley, Lewis and Vallar1984) examined the phonological similarity effect. These researchers showed that listeners recall phonologically dissimilar items better than similar ones. This finding suggests that speech is encoded in a temporary phonological memory store, where similar sounding items are subject to considerably more interference and are thus harder to recall than dissimilar items. In another line of research, Rowe and Rowe (Reference Rowe and Rowe1976) studied the so-called stimulus suffix effect (see also Morton, Crowder, & Prussin, Reference Morton, Crowder and Prussin1971). These researchers had listeners recall sequences composed of either speech (words) or nonspeech (environmental sounds). Each sequence was followed by an extraneous “suffix,” which was also either speech (e.g., the word go) or nonspeech (e.g., a bird chirp). The results extended a finding from previous research that the presence of a suffix impairs listeners’ recall (Conrad, Reference Conrad1960; Crowder & Morton, Reference Crowder and Morton1969), and suggested that this disruption occurs when the suffix matches the type of sequence to be recalled (speech or nonspeech). This implies that listeners tend to rely on different mechanisms to process speech versus nonspeech material, with phonological memory involved in the processing of speech and an acoustic storage system involved in the processing of nonspeech (Crowder & Morton, Reference Crowder and Morton1969).
Recent evidence points to a more direct role of phonological memory in speech perception. For example, phonological memory is involved in listeners’ ability to discriminate stress contrasts not present in their L1 (Dupoux, Peperkamp, & Sebastián-Gallés, Reference Dupoux, Peperkamp and Sebastian-Galles2001) and in listeners’ perceptual learning of words, especially when such words are degraded to make the learning task more difficult (Hervais-Adelman, Davis, Johnsrude, & Carlyon, Reference Hervais-Adelman, Davis, Johnsrude and Carlyon2008). In addition, phonological memory seems to underlie, at least in part, listeners’ ability to perceive spoken sentences, as shown in tasks requiring listeners to detect mispronunciation or to comprehend sentences involving minimal pairs (Jacquemot, Dupoux, Decouche, & Bachoud-Lévi, Reference Jacquemot, Dupoux, Decouche and Bachoud-Lévi2006). Phonological memory also appears to be related to listeners’ subjective ratings of speech. For instance, Gould, Saum, and Belter (Reference Gould, Saum and Belter2002) reported a relationship between listeners’ recall of spoken directions, their phonological (working) memory, and their subjective reactions to speech (e.g., rating the speaker as being kind and caring vs. patronizing and disrespectful).
In light of these findings, we hypothesized that listeners’ perceptual judgments of L2 speech might also be related to phonological memory. However, there is little in existing literature to indicate how phonological memory could influence ratings of speech in general, and ratings of L2 speech in particular, that would favor one set of predictions over another, allowing us to propose a directional hypothesis. For example, listeners with a large phonological memory, compared to listeners with a small memory capacity, could retain more L2 speech in their short-term memory, which would make the task of listening to L2 speech easier for them. As a result, they could judge L2 speech as being more comprehensible, more fluent, and less accented. In contrast, listeners with a large phonological memory, precisely because of their superior memory capacity, could be highly sensitive to various phonetic and prosodic deviations of L2 speech from L1 “norms” and, consequently, could judge L2 speech as being less comprehensible, less fluent, and more accented. We investigated these possibilities here by studying the link between individual differences in listeners’ phonological memory and their perceptual judgments of L2 speech.
ATTENTION CONTROL
Attention control refers to an individual's ability to efficiently allocate attention among different aspects of language or different cognitive processing tasks. As a cognitive construct, attention control involves a number of functions associated with a variety of neurobiological structures (Posner & DiGirolamo, Reference Posner, DiGirolamo, Gazzaniga and Bizzi2000). When applied to language, attention control may refer to enhanced processing of the linguistic stimuli that are relevant to the task at hand and to inhibited processing of the stimuli that are irrelevant to it (Eviatar, Reference Eviatar, Stemmer and Whitaker1998). Attention control may also refer to an individual's ability to shift attention efficiently among different sets of linguistic relationships (Talmy, Reference Talmy, Shibatani and Thompson1996).
The existing literature on attention control and speech perception is extensive (see Cowan & Saults, Reference Cowan, Saults and Winitz1995, and Cowan et al., Reference Cowan, Elliott, Saults, Morey, Mattox and Hismjatullina2005), dating back to early studies of selective attention (e.g., Cherry, Reference Cherry1953) and its conceptualizations in theories of information processing (e.g., Atkinson & Shiffrin, Reference Atkinson, Shiffrin, Spence and Spence1968). Several findings from this literature are pertinent here. One finding is that attention control is implicated in speech processing at all levels, from fine-grained phonetic perception to higher order semantic processing. At the level of phonetic perception, for example, efficient attention control might be required for listeners to perceive phonetic cues signalling voicing distinctions (Gordon, Eberhardt, & Rueckl, Reference Gordon, Eberhardt and Rueckl1993) and vowel contrasts (Assmann & Summerfield, Reference Assmann and Summerfield1994), especially when listeners perform multiple tasks at once. At the level of speech comprehension, recall of speech is often disrupted when listeners’ attention is divided, suggesting that speech comprehension draws on substantial attentional resources (Craik & McDowd, Reference Craik and McDowd1987; Wood & Cowan, Reference Wood and Cowan1995).
Several other findings from attention literature suggest that speech perception tasks require efficient attention control, especially when such tasks are performed under nonideal listening conditions. One example of such tasks includes monitoring speech for a particular speech segment (e.g., /b/ or /v/) when listening to two competing spoken messages (Mullennix, Sawusch, & Garrison, Reference Mullennix, Sawusch and Garrison1992). Another example is listening to speech and detecting errors in it while performing a secondary (concurrent) task (Oomen & Postma, Reference Oomen and Postma2002). It is likely that these tasks might be comparable (at least to a certain extent) in their demands on the listener to the task of listening to L2 speech, particularly if L2 speech is accented, difficult to understand, and dysfluent. To understand L2 speech, listeners may need to allocate their attention efficiently to several competing dimensions in speech, including its phonetic and perceptual aspects and its semantic content (von Kriegstein, Eger, Kleinschmidt, & Giraud, Reference von Kriegstein, Eger, Kleinschmidt and Giraud2003), particularly when these dimensions do not correspond to what listeners might consider nativelike in their language.
It is conceivable, then, that listeners’ judgments of accentedness, comprehensibility, and fluency of L2 speech might be related to individual differences in listeners’ attention control. In other words, listeners’ ability to optimize a balance in attentional focus between processing the interlocutor's speech on the one hand and constructing a mental representation of the message on the other might underlie, at least in part, their ability to process and evaluate L2 speech. Similarly, listeners may also need to switch their attention seamlessly among different linguistic dimensions when attending to speech, and these “shift costs” may vary depending on how heavily accented, difficult to understand, or dysfluent L2 speech seems to listeners.
Based on previous research, we were again unable to predict the exact nature of the relationship between listeners’ judgments of L2 speech and their attention control capacity. On the one hand, listeners with efficient attention control could shift their attentional focus effortlessly among different linguistic dimensions of speech or between the tasks of constructing perceptual and conceptual representations of speech. As a result, these listeners could judge L2 speech as being more comprehensible, more fluent, and less accented than listeners with less efficient attention control. In contrast, listeners with efficient attention control could be overly sensitive to additional shift costs imposed on them by L2 speech because of some extra effort needed for parsing the linguistic dimensions of speech or for constructing its conceptual representation. Compared to listeners with less efficient attention control, these listeners could downgrade their ratings of L2 speech and could judge it to be less comprehensible, less fluent, and more accented. We explored these possibilities here by investigating the link between individual differences in listeners’ attention control and their perceptual judgments of L2 speech.
MUSICAL ABILITY
We hypothesized that individual differences in musical ability might also be related to how listeners evaluate L2 speech. For the purposes of this study, musical ability is defined as an individual's ability to “hear” (internalize) music that is no longer present in the physical environment, a skill that Gordon (Reference Gordon1995) termed “audiation.” For example, upon hearing two musical phrases played consecutively, listeners with greater musical ability, compared to listeners with weaker musical ability, would presumably be able to judge whether the two phrases are similar in their melodic contour (overall pattern of pitch rises and falls), even if the two phrases differed in the overall number of notes. Musical ability, defined in this manner, is often measured using standardized tests that target several aspects of this ability, including pitch, intensity, rhythm, timbre, tonal memory, and timing (Bentley, Reference Bentley1966; Gordon, Reference Gordon1995; Seashore, Reference Seashore1919; Wing, Reference Wing1968).
It appears that musicians (i.e., individuals who are presumably good at the skills involved in how we have defined musical ability) are at an advantage over nonmusicians in a variety of speech perception tasks. For example, in a series of behavioral and neuroimaging experiments, Schön, Magne, and Besson (Reference Schön, Magne and Besson2004) demonstrated that musicians are more accurate than nonmusicians at detecting melodic incongruities (tones that violate musical or prosodic contours) in both music and L1 speech. Similarly, Gottfried (Reference Gottfried, Bohn and Munro2007) showed that trained musicians are more adept than nonmusicians at perceiving (and producing) the lexical tones of an unfamiliar tone language (Mandarin), with musicians outperforming nonmusicians in both tone discrimination tasks and goodness of production ratings assigned by native speaking listeners. Alexander, Wong, and Bradlow (Reference Alexander, Wong and Bradlow2005), who reported a similar finding in Mandarin pitch perception tasks, suggested that musicians’ extensive pitch processing experience may positively transfer to speech perception.
Although these results point to an important link between musical ability and L1 speech processing, the relationship between musical ability and L2 speech processing remains unclear. Some researchers who have investigated this relationship reported a positive correlation between musical ability and L2 production (Arellano & Draper, Reference Arellano and Draper1972; Nakata, Reference Nakata2002; Slevc & Miyake, Reference Slevc and Miyake2006). However, many others have failed to reveal any clear relationship between these two variables (Dexter & Omwake, Reference Dexter and Omwake1934; Flege, Munro, & MacKay, Reference Flege, Munro and MacKay1995; Pimsleur, Stockwell, & Comrey, Reference Pimsleur, Stockwell and Comrey1962; Tahta, Wood, & Loewenthal, Reference Tahta, Wood and Loewenthal1981). The link between musical ability and L2 speech perception has been even more elusive, essentially because this relationship has been studied much less extensively. For example, Slevc and Miyake (Reference Slevc and Miyake2006) showed that a standardized measure of musical ability accounted for up to 12% of variance in native Japanese speakers’ perception of L2 (English) contrasts in words, sentences, and spoken texts (see also Pimsleur et al., Reference Pimsleur, Stockwell and Comrey1962). However, no association between musical ability and L2 perception was found in several other studies (Arellano & Draper, Reference Arellano and Draper1972; Nakata, Reference Nakata2002).
More research is clearly needed not only to enhance our understanding of the link between musical ability and L2 processing but also to explore the interface between musical ability and the assessment of L2 speech. For example, it is not clear whether trained musicians would judge L2 speech differently than listeners with little or no musical experience and with lower musical ability. In this study, we therefore investigated the link between individual differences in listeners’ musical ability and their perceptual judgments of L2 speech. Based on previous research (e.g., Alexander et al., 2004; Gottfried, Reference Gottfried, Bohn and Munro2007), we predicted that listeners with greater musical ability will judge L2 speech as being more accented, less comprehensible, and less fluent than raters with weaker musical ability. We reasoned that listeners with greater musical ability would be more sensitive to certain aural components of L2 speech (e.g., nonnative voice quality or pitch fluctuations) than listeners with weaker musical ability (see Gottfried, Reference Gottfried, Bohn and Munro2007). As a result, those listeners who are more musical, compared to those who are less musical, would have a lower impression of the L2 speech they heard, assigning lower scores for accentedness, comprehensibility, and fluency.
THE CURRENT STUDY
To the best of our knowledge, the relationship between cognitive variables, which underlie any form of language functioning, and listener judgments of L2 speech has not been examined in prior research. Therefore, the overall goal of this study was to investigate the extent to which native speaking listeners’ judgments of L2 speech are mediated by individual differences in listeners’ phonological memory, attention control, and musical ability. To accomplish this goal, we asked 60 listeners (half of whom were formally trained musicians and half not) to rate the speech of 40 francophone L2 speakers of English for accentedness, comprehensibility, and fluency. We also asked all listeners to perform three cognitive tasks: a serial nonword recognition task to measure listeners’ phonological memory, the Trail Making Test to measure their attention control, and three subtests of the Musical Aptitude Profile (MAP) to measure their musical ability. We then analyzed the speech ratings as a function of these three cognitive measures to determine how the speech ratings related to the cognitive measures.
METHOD
Speakers
The speech samples for this study were elicited from 40 adult native speakers of French (27 female, 13 male) tested as part of a larger, unrelated project (Trofimovich, Gatbonton, & Segalowitz, Reference Trofimovich, Ammar, Gatbonton and Mackey2007). All speakers (mean age = 35.6 years, range = 18−61) were born into francophone families in Québec and were educated in French. With the exception of two, whose first exposure to English occurred between birth and age 2 through interaction with an English-speaking parent, all speakers were first exposed to English in elementary school (mean age = 9.3 years) as part of English as an L2 instruction in Québec. Prior to providing speech samples, the speakers rated their proficiency in speaking and listening in English and French on a 9-point scale (1 = extremely poor, 9 = extremely proficient) and estimated their daily use of French and English on a 0% to 100% scale. In French, the mean ratings for the two skills were consistently high (8.9–9.0); in English, they were intermediate (5.7–6.6) and highly variable. On average, the speakers used French 80% (30%–100%) and English 20% (0%–70%) of the time daily.
As part of the earlier project (Trofimovich et al., Reference Trofimovich, Ammar, Gatbonton and Mackey2007), a separate test was administered to determine that the speakers represented a wide range of L2 pronunciation abilities. The test was a reading task in which the speakers read a simple 440-word story in English and were recorded directly onto a computer using a Plantronics (DSP-300) microphone. The recordings were subsequently presented to a panel of five judges (mean age = 38.2 years; all exposed to English from birth) to assess the degree of accentedness in the speakers’ speech. The judges listened to a short excerpt from each speaker's recording (mean duration = 18 s) and independently rated each sample for accentedness using a 9-point Likert-type scale (1 = heavily accented, 9 = not accented at all). An accent score was computed for each speaker by averaging the five judges’ accent ratings (interrater reliability: α = 0.96). The scores ranged between 1.8 and 9.0, with a mean of 5.3. The speakers thus represented different pronunciation ability levels, from beginning to advanced.
For the current study, we used samples of extemporaneous speech recorded by the 40 speakers in response to a simple eight-frame picture narrative. Used in previous studies with L2 speakers (e.g., Derwing et al., Reference Derwing, Rossiter, Munro and Thomson2004), the picture narrative depicted a man and a woman who, having bumped into one another on a busy street corner, realized their mishap of having switched suitcases only after they had arrived at their respective destinations. The speakers were asked to study the picture narrative for approximately 1 min prior to recording their story directly onto a computer (using a Plantronics DSP-300 microphone). The recorded stories ranged in duration between 26.4 and 322.8 s. Excerpts containing the first 20 s of each story, excluding initial pauses and false starts, were then saved separately as digital audio files, normalized for peak intensity, and randomized for their presentation to raters. The procedure of having raters judge the first few seconds of a speech sample (cf. Derwing, Thomson, & Munro, Reference Derwing, Thomson and Munro2006) has the advantage of keeping the content of the story relatively constant across speakers in a naturalistic, extemporaneous speech task, where the precise output of the speaker is unpredictable.
Raters
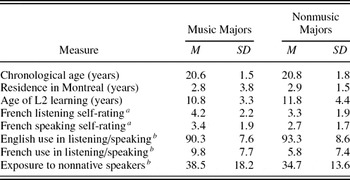
The raters who listened to and evaluated the speech samples included 60 native English-speaking undergraduate students (26 males, 34 females). Of these, 30 were music majors enrolled in a music program at an English-medium university in Montreal, Canada, and 30 were nonmusic majors studying a variety of disciplines at the same university (e.g., psychology, political science, electrical engineering, English literature, computer science). All raters were native speakers of English from either the United States (31) or English-speaking areas of Canada (29), with a similar proportion of Americans in the music and nonmusic major groups (53% and 47%, respectively). One music major reported being a monolingual English speaker, 24 in both rater groups cited knowledge of an L2, and 6 music and 7 nonmusic majors indicated knowing a third language as well. Overall, 41 raters reported that their L2 was French, 8 cited Spanish, 4 identified German, and the rest named other minority languages. All raters reported having normal hearing and none had had language teaching experience or had taken a phonetics/phonology course, although 6 of the voice majors had taken a diction course for singers. A summary of the raters’ background information, which includes their estimates of language use and their proficiency self-ratings in French, appears in Table 1.
Raters' background and language proficiency characteristics

Note: L2, second language.
aMeasured on a 9-point scale (1 = extremely poor, 9 = extremely proficient).
bMeasured on a 0–100% scale.
The music majors consisted of 19 performance majors, 6 music education students, 4 Bachelor of Arts music majors (music theory or music history concentrations), and a composition major (mean self-reported musical experience = 10.5 years, range = 3−19 years). The primary instruments for the music majors included string instruments (8), voice (7), woodwinds (7), brass (3), keyboard (3), and percussion instruments (2). In addition, the majority (24) had received formal training in a second or third instrument. By the time of the testing, all music majors had completed a minimum of 1 year of required courses in musicianship (ear training) and music theory (tonal counterpoint and harmony analysis). Although 3 of the performance majors were jazz musicians, they had received training in the Western classical music tradition during their first year of university coursework.
The nonmusic majors, who were not pursuing a university music degree and had no aspiration to become professional musicians, had varying degrees of musical training (mean self-reported musical experience = 3.4 years, range = 0–9 years), with eight reporting no musical training at all. Our intent was not to recruit a homogeneous group of nonmusicians with absolutely no musical background. We chose instead to access a group who, along with the music majors, varied in the quantity (and likely also the quality) of musical experience they had received. Obtaining a wide distribution of musical ability was consistent with our goal here, namely, to determine whether listeners’ musical ability and other cognitive variables influence their accentedness, comprehensibility, and fluency ratings.
A series of independent samples t tests was conducted to determine if the two rater groups differed for any of the eight demographic and language use variables listed in Table 1. These tests revealed no statistically significant differences between the groups, suggesting that both rater groups were matched on all demographic and language use variables examined here.
Phonological memory task
A serial nonword recognition task was used in this study to measure phonological memory. In this task, listeners hear sequences of pronounceable nonwords (with sequences increasing in length as the task progresses) and decide whether the sequences are presented in the same or in a different order. A recognition task of this kind has at least two advantages over widely used measures of phonological memory based on word/nonword recall and repetition. First, a recognition task does not contain an articulatory (motor) component. In contrast, both recall and repetition tasks place articulatory demands on the speaker and likely show bias against participants with speech impediments (Snowling, Chiat, & Hulme, Reference Snowling, Chiat and Hulme1991). Second, a recognition task, compared to recall and repetition tasks, appears to minimize lexical (vocabulary knowledge) influences on phonological memory, yielding a relatively accurate estimate of phonological memory (Gathercole, Pickering, Hall, & Peaker Reference Gathercole, Pickering, Hall and Peaker2001). For example, Gathercole et al. (Reference Gathercole, Pickering, Hall and Peaker2001) reported effect size (partial η2) values of 0.71–0.94 for lexical influences in a serial recall task as compared to effect sizes of 0.25–0.27 for lexical influences in a serial recognition task.
The materials for the serial recognition task used here consisted of 160 one-syllable consonant–verb–consonant (CVC) nonwords from Gathercole et al. (Reference Gathercole, Pickering, Hall and Peaker2001). The nonwords (which respected English phonotactics) were digitally recorded by a male native English speaker and were organized into sequences of five, six, and seven items, with 8 pairs of sequences of each length (for a total of 24 pairs). All items within a sequence had a different vowel sound, and the consonant composition within each sequence was as distinctive as possible. Half of the pairs were ordered identically (e.g., loog jahl deech kerp meb . . . loog jahl deech kerp meb, where ellipses indicate a short pause). In the other half of the pairs, one of the items was transposed in the second presentation of the sequence relative to the first, so that there was an order mismatch (e.g., lod tudge jick norb garm . . . lod tudge norb jick garm). To reduce the salience of transposed items and to encourage the listener to process the complete sequence, the first or the last item in the sequence was never transposed. The location of the transposed items was varied randomly across sequence lengths.
The 24 nonword sequences were presented to the raters over a Koss R/80 headset using speech presentation software (Smith, Reference Smith1997). The five-item sequence pairs were presented first, followed by the six- and seven-item sequence pairs. The nonwords were presented at the rate of one item every 800 ms, with a 1.5-s pause between the two sequences in each pair. Upon hearing each pair, the raters indicated whether the two sequences were presented in the same or a different order by clicking one of the buttons labeled “same order” and “different order” on the computer screen. The raters had unlimited time to provide their judgment but were not permitted to replay the sequence or to change their response. Prior to carrying out this task, the raters were given two same and two different sequence pairs as practice. The number of correct responses (out of 24) was recorded for each rater and used as a measure of phonological memory.
Attention control task
The Trail Making Test, originally designed as part of the US Army Individual Test Battery (1944), was used in this study to estimate attention control. The test appears to provide a language-neutral estimate of an individual's ability to shift attention between two sets of stimuli (Lee, Cheung, Chan, & Chan, Reference Lee, Cheung, Chan and Chan2000). The test consists of two parts and involves drawing a line to connect consecutive digits from 1 to 25 (1-2-3-4-5-6, etc.) in Part A and drawing a similar line to connect alternating digits and letters (1-A-2-B-3-C, etc.) in Part B. Assuming that the time it takes to complete a nonalternating digit sequence (Part A) provides the baseline for each individual's motor and visual control, the additional cost imposed on the individual by the alternating digit–letter sequence (Part B) provides a measure of this individual's executive control, or the ability to switch attention between two stimulus sequences. In other words, the difference in completion time between Part B and Part A of the test is indicative of the individual's attentional control of switching between different stimuli (Corrigan & Hinkeldey, Reference Corrigan and Hinkeldey1987) and between different cognitive tasks (Arbuthnott & Frank, Reference Arbuthnott and Frank2000).
For all raters, Part B of the test followed Part A, each preceded by an eight-item practice session. The completion times for both parts of the test were measured using a digital stopwatch and were recorded in seconds, with the values rounded to the nearest one-hundredth of a second. For each rater, the difference in completion times between Part B and Part A of the test was used as a measure of attention control. A smaller score, corresponding to a smaller difference in completion time between Parts A and B, represented more efficient attention control.
Test of musical ability
Three subsections (melody, tempo, phrasing) of the MAP, a test battery used to predict musical learning in Grade 4 to college-level students (Gordon, Reference Gordon1967, Reference Gordon1995, Reference Gordon2001; see also Carson, Reference Carson1998), were used to measure musical ability. The test assumes no prior knowledge of music other than general exposure to music. A lack of musical training does not preclude an individual from receiving a high score on the test, although individuals who do have musical training are more likely to receive high scores than those with no musical training (Gordon, Reference Gordon2001).
In the melody subtest the listeners hear two consecutive short musical phrases performed on a violin and judge whether the first musical phrase (stimulus item) sounds similar to or different from the second musical phrase (test item) in terms of melodic contour (overall pattern of pitch rises and falls). In the tempo subtest the listeners hear two musical phrases and judge tempo consistency. If the tempo is inconsistent, the test item gradually speeds up or slows down relative to the tempo that had been established in the stimulus. Listeners are required to indicate whether the tempo in the two musical excerpts is the same or different. Finally, in the phrasing subset, which was performed by violin and cello, listeners hear the same musical phrase twice and judge which rendition they feel sounds better in terms of phrasing (i.e., is performed more musically). The intent of this subtest is to go beyond tonal and rhythmic dimensions of music to assess interpretive aptitude by measuring listeners’ responses to the combined effect of dynamics, tempo, tone quality, and musical articulation (for details on the validation of MAP subtests, see Gordon, Reference Gordon1995). We used these three subtests because they covered a range of skills that could potentially differentiate among individuals with stronger and weaker musical ability.
There were no forced-choice responses for any of the subtests, and listeners had the option of indicating “unsure” (counted as a nonresponse in the scoring) if they did not want to venture a guess. The number of correct responses was calculated for each rater on each subtest and used as measures of musical ability. The melody and tempo subtests were scored out of 40, and the phrasing subtest was scored out of 30.
Procedure
The testing, which took approximately 2 hr to complete, was conducted individually in a quiet room using a desktop computer and a Koss R/80 headset. The raters first listened to the 40 speech samples presented one at a time in one of four randomized orders and rated each sample for accentedness, comprehensibility, and fluency using separate numerical scales. These three constructs were operationalized based on previous L2 research (e.g., Derwing et al., Reference Derwing, Rossiter, Munro and Thomson2004; Kennedy & Trofimovich, Reference Kennedy and Trofimovich2008; Munro & Derwing, Reference Munro and Derwing1999): accentedness (1 = heavily accented, 9 = not accented at all), comprehensibility (1 = hard to understand, 9 = easy to understand), and fluency (1 = not fluent at all, 9 = very fluent). The listening session was self-paced; the raters were allowed to listen to each recording, to replay its segments, and to change their responses as many times as they wished. With rare exceptions, all maintained an efficient scoring pace, making rating decisions without frequent replaying of recordings and changing of the ratings given. The raters then completed the three subsections of the MAP. All MAP instructions and musical excerpts were played on the CDs included with the test battery, and the raters marked their responses on the standardized scoring sheets. Finally, the raters performed the serial nonword recognition test and the Trail Making Test (in that order).
RESULTS
For all statistical tests, the α level for significance was set at 0.05. A Bonferroni procedure was applied to adjust the level of significance for all multiple comparisons. All t tests and correlations are based on two-tailed distributions. Effect sizes are reported as r correlations.
Preliminary Analyses
Prior to examining the relationship between cognitive variables and ratings of accentedness, comprehensibility, and fluency of L2 speech, we performed four preliminary analyses. The goal of the first analysis was to determine the relationship among the three cognitive measures. We computed Pearson correlation coefficients among the raters’ (n = 60) phonological memory scores, attention control scores, and their scores on the three MAP subtests (α = 0.005). The three music scores were significantly correlated with one another, r (58) = .43−.69, p < .001, suggesting that the three subtests measured a related construct. By contrast, neither the phonological memory score nor the attention control score was significantly correlated with each other or with the music scores, r (58) = −.13−.09, p > .32, suggesting that the three cognitive measures focused on here represented separate constructs.
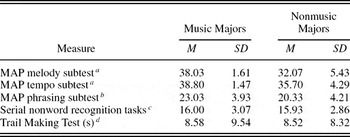
The goal of our second analysis was to determine whether there were any differences between the two rater groups (music and nonmusic majors) for the three cognitive measures investigated here. We computed independent samples t tests comparing the two groups (α = 0.01). These tests yielded significant differences between the groups for all three MAP subtests: melody, t (58) = 5.67, p < .0001, r = .60, tempo, t (58) = 3.79, p < .0001, r = .45, and phrasing, t (58) = 2.75, p = .01, r = .34. In all cases, the music majors outperformed the nonmusic majors. By contrast, these tests yielded no significant differences between the two groups for phonological memory and attention control (p > .92). Thus, the music and nonmusic majors, as intended, differed only in their musical ability. Mean scores for the music and nonmusic majors on the MAP subtests, serial nonword recognition task, and Trail Making Test are provided in Table 2.
Mean scores on cognitive ability tests

Note: MAP, Musical Aptitude Profile.
aScored out of 40.
bScored out of 30.
cScored out of 24.
dCalculated as the difference in completion time between Part B and Part A.
We focused on rater reliability in the third analysis. This was done to determine whether a given rater's behavior was consistent with the other raters in their group. We assessed rater reliability separately for each rater group (the 30 music majors and 30 nonmusic majors) for each of the three ratings. To allow for comparison of reliability coefficients across studies, we computed two interrater reliability measures: Cronbach α and mean intercorrelations (Pearson r) corrected for distortion using the Fisher Z transformation. The obtained Cronbach α values for both groups ranged between 0.98 and 0.99 for the three ratings. These values were about 0.03 to 0.04 higher than those reported for untrained novice raters in Derwing and Munro (Reference Derwing and Munro1997) and Derwing et al. (Reference Derwing, Rossiter, Munro and Thomson2004), where rater sample sizes were 26 and 28 respectively, and comprehensibility, accentedness, and fluency were operationalized using 9-point numerical rating scales. The mean Pearson r value obtained for both rater groups was .76 for the three ratings. These values were about .05 higher than the values obtained by Munro and Derwing (Reference Munro and Derwing2001), who examined 48 raters’ judgments of speakers from multiple L1 groups; but they were nearly equivalent to the values reported by Derwing et al. (Reference Derwing, Rossiter, Munro and Thomson2004), who tested speakers from a homogenous L1 background. Thus, the interrater reliability for both rater groups here was sufficiently high for listeners with no rater training. Based on these analyses, we computed a single mean accentedness, comprehensibility, and fluency score for each rater by averaging across each rater's 40 individual accentedness, comprehensibility, and fluency ratings.
In our final analysis we closely examined the distribution of these mean accentedness, comprehensibility, and fluency scores to determine if they were appropriate for parametric analyses. We conducted a series of Kolmogorov–Smirnov goodness of fit tests, separately for the music and nonmusic majors, to compare whether the distributions of these mean scores were different from normally distributed sets of scores with the same means and standard deviations. These tests yielded no significant values for any ratings, Ds (30) < 0.12, p > .20, suggesting that the assumption of normality was met and that the mean rating scores could be analyzed using parametric procedures.
Phonological memory and ratings of L2 speech
The raters’ phonological memory scores ranged between 10 and 23, with a mean of 15.9 and a median of 16. To determine the relationship between phonological memory and ratings of comprehensibility, accentedness, and fluency, we divided the entire sample of raters (n = 60) into two equal groups using a median split: those whose phonological memory scores were above the median value (mean = 18.2, range = 16–23) and those whose memory scores were below this value (mean = 13.6, range = 10–15). We then examined whether there were differences between these two groups in their mean ratings of accentedness, comprehensibility, and fluency (shown for both groups in Table 3). These comparisons (α = 0.016) yielded no statistically significant differences between the groups of high and low phonological memory, ts (58) < .53, ps > .60, rs < .07. This finding suggested that, at least in this study, there was no relationship between the raters’ phonological memory and their ratings of L2 speech.
Mean (standard deviation) accentedness, comprehensibility, and fluency ratings as a function of phonological memory, attention control, and musical training

Attention control and ratings of L2 speech
The raters’ attention control scores ranged between −9.7 (for a rater who was actually faster in Part B than in Part A of the test) and 31.7, with a mean of 8.6 and a median of 8.3. As in the previous analysis, to determine the relationship between attention control and ratings of comprehensibility, accentedness, and fluency, we used a median split to divide the entire sample of raters (n = 60) into a group of raters with better attention control, that is, those whose scores fell below the median value (mean = 1.3, range = −9.7–8.3) and a group of raters with worse attention control (mean = 15.8, range = 8.4–31.7). As before, we tested for differences between these two groups in their mean ratings of accentedness, comprehensibility, and fluency (shown for both groups in Table 3). These comparisons (α = 0.016) yielded no statistically significant differences between the groups of better and worse attention control, ts (58) < 1.21, ps > .23, rs < .16. This finding suggested that, at least in this study, there was no relationship between the raters’ attention control and their ratings of L2 speech.
Musical training and ratings of L2 speech
Because in our preliminary analyses we determined that our original groups of the music and nonmusic majors differ significantly in their musical ability, as measured by the three MAP subtests, we proceeded to examine whether these two groups differed in their mean ratings of accentedness, comprehensibility, and fluency (shown in Table 3). These comparisons (α = 0.016) yielded a difference only for accentedness, t (58) = 2.37, p = .021, r = .30, with the music majors assigning significantly lower mean ratings than the nonmusic majors. Although the music majors tended to score both comprehensibility and fluency more negatively than the nonmusic majors (see Table 3), neither of these differences was statistically significant, ts (58) < 1.73, ps > .09, rs < .22. These results suggest that there might be a difference in how the music and nonmusic majors rate accentedness in L2 speech (although this difference, at p = .021, failed to reach statistical significance after a Bonferroni adjustment). We explored this finding in greater detail in a follow-up analysis.Footnote 1
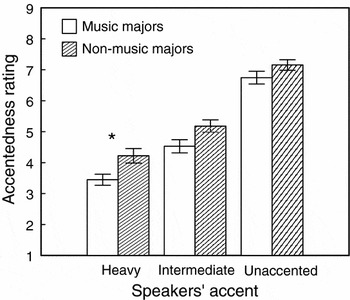
In comparisons between the groups of the music and nonmusic majors, we used speech ratings that were averaged across the 40 speakers. However, these mean ratings conceal much variability. At least some of this variability is specific to differences in speakers’ ability and to differences in how negatively listeners rate speakers of different ability. One possible way to explore the relationship between musical ability and accentedness ratings further is to examine the music and nonmusic majors’ ratings of accentedness for speakers of different ability. In order to accomplish this, we divided our original sample of 40 speakers into separate groups based on the accentedness ratings (1 = heavily accented, 9 = not accented at all) given to these speakers by an independent group of raters as part of an earlier study (Trofimovich et al., Reference Trofimovich, Ammar, Gatbonton and Mackey2007). These ratings (described in the Speakers Section) allowed us to create three groups: heavily accented speakers (n = 15, mean accentedness rating = 2.9, range = 1.8–3.8), speakers with intermediate accent (n = 13, mean = 5.5, range = 4.2–6.4), and unaccented speakers (n = 12, mean = 8.0, range = 7.0–9.0).
For each of the 60 raters, we computed three mean accentedness ratings by averaging each rater's accentedness ratings across the speakers in each group. These mean accentedness ratings, which were normally distributed according to Kolmogorov–Smirnov tests, Ds (30) < 0.13, p > .21, were then submitted to comparisons between the groups of the music and nonmusic majors. These tests (α = 0.016) yielded a significant difference in accentedness ratings between the music and nonmusic majors for the heavily accented speakers, t (58) = 2.61, p = .011, r = .32. However, the difference between the two groups for the speakers with intermediate accent became nonsignificant after a Bonferroni correction was applied, t (58) = 2.23, p = .03, r = .28. In both of these cases, the music majors assigned lower accentedness scores (i.e., rated them as sounding less nativelike) than the nonmusic majors. Finally, no difference was detected between the two groups for the unaccented speakers, t (58) = 1.52, p = .13, r = .19. It appears, then, that raters with university-level musical training assigned lower accentedness ratings than raters with little or no musical experience, especially when rating L2 speakers of lower ability. The mean accentedness ratings given by the raters to the speakers of different ability are plotted in Figure 1.
Mean accentedness ratings by music and nonmusic majors for second language (L2) speakers with heavy, intermediate, and little accent. The bars enclose ±1 SE. *There is a significant difference between the two rater groups after a Bonferroni adjustment.

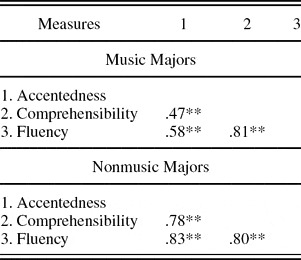
In a subsequent analysis, we explored further the relationship among the three ratings for the music and for the nonmusic majors. Our intention here was to determine how ratings of accentedness, comprehensibility, and fluency relate to one another for individuals with musical training and those with no academic training in music. For this analysis, we first computed three Pearson product moment correlation coefficients among the mean ratings of accentedness, comprehensibility, and fluency for the music and nonmusic majors separately. These correlation coefficients (shown in Table 4) revealed that all correlations were overall lower for the music majors than for the nonmusic majors. Next we applied the Fisher r to z transformation (Clark-Carter, Reference Clark-Carter1997) to compare the correlations obtained from the music and nonmusic majors (independent samples). The correlation between accentedness and comprehensibility was significantly higher for the nonmusic majors than for the music majors (z = −1.97, p < .05). The correlation between accentedness and fluency was also higher for the nonmusic majors than for the music majors (z = −1.93, p = .053); this difference, however, narrowly missed statistical significance. This suggests that the three rating dimensions, particularly accentedness and comprehensibility, were more independent (distinct) for the music majors than for the nonmusic majors.
Pearson product-moment correlations among accentedness, comprehensibility, and fluency ratings for music versus nonmusic majors

**p < .001 (two tailed).
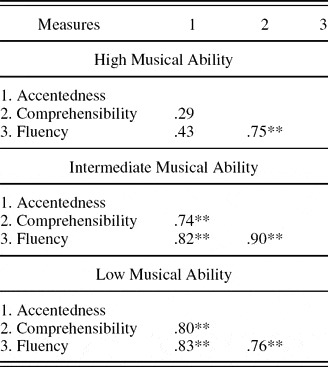
In our final analysis, we sought to examine the relationship between accentedness, comprehensibility, and fluency for raters classified into different musical ability groups based on their performance on the MAP subtests. A measure of musical ability derived from a standardized test is arguably a more objective criterion for classifying raters into musical ability groups than their university major status, which at least partially reflects raters’ self-selection into a program with music specialization. In order to examine musical ability in relation to the rating outcomes, we therefore split the raters into three musical ability groups based on their composite scores on the MAP subtests, regardless of their university major status, with an equal number of raters placed into each group. The raters assigned to the low ability group received a mean MAP composite score of 82.35 (range = 51–92), the intermediate ability group's mean composite score was 96.45 (range = 93–99), and the high ability group achieved a mean score of 103.15 (range = 100–108). In light of the finding that accentedness appears to be more distinct (i.e., linearly independent) for the music majors than for the nonmusic majors relative to comprehensibility and fluency, we predicted lower correlation coefficients between each of the three rating dimensions (particularly between accentedness and comprehensibility) for higher musical ability raters than for lower musical ability raters.
The Pearson correlation coefficients for the three musical ability groups are reported in Table 5. The results of the significance tests using the Fisher r to z transformation showed that the correlation between accentedness and comprehensibility was significantly higher for the low ability group than for the high ability group (z = −2.33, p = .020) and approached significance for the low versus the intermediate ability groups (z = −1.90, p = .057). In addition, the correlation between accentedness and fluency was significantly higher for the low ability group than for both the intermediate (z = −2.03, p = .004) and the high (z = −2.12, p = .003) ability groups. As in the previous analysis, there were no significant differences among the groups in the correlation coefficients obtained for comprehensibility and fluency. To summarize, when raters were grouped into high, intermediate, and low musical ability groups based on their composite MAP scores, raters with higher musical ability appeared to differentiate accentedness from comprehensibility or fluency to a greater extent than raters with lower musical ability. These findings are virtually identical to those we reported in the previous analysis, where we compared raters with university musical training to those with no university musical training.
Pearson product-moment correlations among accentedness, comprehensibility, and fluency ratings for low, intermediate, and high musical ability raters grouped by composite score on the Musical Aptitude Profile subtests

**p < .001 (two tailed).
DISCUSSION
Our overall motivation in conducting the present study was to determine the role of cognitive variables in rater judgments of L2 speech, and to understand how these cognitive variables affect the reliability of language assessments and ultimately influence high-stakes decision making. We started from the premise that English language speaking proficiency in North American higher educational institutions is typically assessed through such standardized tests as the TOEFL, IELTS, or TSE, all used for admission or placement purposes or for the selection of international teaching assistants (Fox, Reference Fox2005; Luoma, Reference Luoma2001). Although there has been some research into sources of rater variability (e.g., Cumming, Reference Cumming1990; Eckes, Reference Eckes2008; Kim, Reference Kim2009), ours appears to be the first study that examines how individual differences in raters’ cognitive abilities impact their judgments of L2 speech. To this end, we analyzed accentedness, comprehensibility, and fluency ratings of L2 speech as a function of raters’ phonological memory, attention control, and musical ability.
There were two main findings. Our first main finding was that the speech ratings examined here did not depend on listeners’ phonological memory or attention control. This finding suggests that individual differences in raters’ phonological memory and attention control (at least insofar as they were measured here) do not play a strong role in rater judgments of accentedness, comprehensibility, and fluency. This result is reassuring because these potential biasing effects, which are not relevant to the rating constructs, do not seem to threaten the validity of the speaking assessments scored by human raters. Our second main finding was that the speech ratings examined here depended on raters’ musical training, such that university-trained musicians tended to assign lower mean scores than musically untrained raters. These differences were the most pronounced when raters evaluated the accentedness of L2 speech, especially for speakers of low pronunciation ability. Accentedness and comprehensibility also appeared to be more independent (distinct) dimensions for university trained musicians than for musically untrained raters. This result suggests that musical training, which was strongly associated with musical ability in this study, is a factor that could bias L2 speaking assessments. We discuss both of these main findings in turn.
Phonological memory, attention control, and assessments of speaking
Our first main finding was that raters’ judgments of L2 speech did not depend on individual differences in raters’ phonological memory and attention control. From an assessment point of view, this finding is encouraging as it suggests that individual differences in these two cognitive abilities might not contribute to unwanted variance in speech ratings. From a psycholinguistic perspective, however, this finding raises interesting questions regarding the precise contribution of phonological memory and attention control to listener judgments of speech. To the best of our knowledge, our study was the first to begin addressing these questions.
In setting up our study, we argued that phonological memory, given its extensive involvement in a variety of speech processing tasks (Baddeley, Reference Baddeley2003), could be involved in listener judgments of L2 speech. There are at least two reasons why we found no evidence for this. The first reason relates to the measure of phonological memory used here. We employed a serial nonword recognition task to estimate the raters’ phonological memory capacity. It could be that other tasks (e.g., nonword repetition or recall tasks), despite their shortcomings that we attempted to sidestep here (see Gathercole et al., Reference Gathercole, Pickering, Hall and Peaker2001), could yield a measure of phonological memory that would be associated with perceptual judgments of L2 speech. Another (and perhaps more plausible) reason is that perceptual judgments of speech may not draw heavily on phonological memory. This is because phonological memory, as its name suggests, operates on phonological, not necessarily rich physical (acoustic–phonetic) details of the speech signal (Baddeley, Reference Baddeley2003). If listeners rely on physical details of speech (such as pitch fluctuations or phonetic substitutions) for their ratings of L2 speech, then it is not surprising that individual differences in phonological memory do not appear to influence these ratings. Perhaps what could play a role in perceptual ratings of L2 speech is acoustic memory, which refers to an individual's capacity for storing acoustic-phonetic information in speech (Cowan, Reference Cowan1984). Research on the suffix effect (discussed earlier) would seem to support the interpretation that the raters in this study were primarily storing and retaining acoustic information in the short-term store (Crowder & Morton, Reference Crowder and Morton1969; Rowe & Rowe, Reference Rowe and Rowe1976). That is, it appears that the rating task, which entailed listening to but not verbally recalling the speech, likely encouraged the raters to encode the speech as a series of sounds or syllables (i.e., using bottom-up processes) rather than as words or conceptual categories (cf. Bloom, Reference Bloom2006). Because acoustic memory is involved in a variety of language processing tasks (Cowan & Saults, Reference Cowan, Saults and Winitz1995), it would be interesting to explore its contribution to perceptual judgments of speech.
At the outset of this study, we also predicted that attention control could be involved in listener judgments of L2 speech. We defined attention control broadly as an individual's ability to efficiently allocate attention among different aspects of language (e.g., separate linguistic dimensions of speech) or different cognitive processing tasks (e.g., constructing perceptual and conceptual representations of speech). Given the extensive evidence showing the involvement of executive attention control in speech processing tasks (Cowan & Saults, Reference Cowan, Saults and Winitz1995; Cowan et al., Reference Cowan, Elliott, Saults, Morey, Mattox and Hismjatullina2005), our failure to find a significant association between attention control and perceptual ratings of speech could be an artifact of our testing procedure. It is likely that the listeners in this study did not need to rely extensively on their attention control capacity, simply because the task of rating L2 speech, as implemented here, was not cognitively demanding and therefore did not require listeners to exercise efficient attention control. This interpretation is supported by the results of one previous study that used the Trail Making Test to estimate participants’ attention control. In that study, the measure of attention control was a stronger predictor of participants’ performance when the cognitive demands of the task were elevated (Trofimovich et al., Reference Trofimovich, Ammar, Gatbonton and Mackey2007). Thus, it would appear that providing perceptual judgments of L2 speech may not be a cognitively demanding task for a native speaker of a language, and perhaps even judging L2 speech that is highly accented, difficult to understand, and dysfluent does not call extensively on listeners’ attentional resources.
In a recent overview of attention and its role in various cognitive tasks, Cowan and colleagues (Reference Cowan, Elliott, Saults, Morey, Mattox and Hismjatullina2005) offered yet another reason for why attention control (as it was conceptualized here) might not be relevant to perceptual judgments of speech. These researchers suggested that a more meaningful measure of attention and its role in processing tasks should be the scope of attention, and not necessarily its control. Broadly, the scope of attention, as defined by Cowan et al. (Reference Cowan, Elliott, Saults, Morey, Mattox and Hismjatullina2005), refers to “the capacity of the focus of attention” (p. 49). The scope of attention is assumed to be specific to an individual language user, and its size is believed to be related to a language user's working memory capacity and intellectual aptitude. In future investigations of the role of cognitive factors in perceptual judgments of L2 speech, it would be interesting to examine these claims further. Such an investigation could, for example, employ a test of the scope of attention (Cowan, Fristoe, Elliott, Brunner, & Saults, Reference Cowan, Fristoe, Elliott, Brunner and Saults2006) to examine whether and to what extent the scope of attention can be predictive of listeners’ perceptual judgments of speech.
Musical training and assessments of speaking
Our second main finding was that raters’ judgments of L2 speech depended on raters’ musical training, which was strongly associated in this study with raters’ musical ability. This finding shows an important link between musical training and L2 speech processing, and adds to a growing body of research that reveals cognitive consequences of musical training and aptitude for the perception and production of L2 speech (e.g., Arellano & Draper, Reference Arellano and Draper1972; Pimsleur et al., Reference Pimsleur, Stockwell and Comrey1962; Slevc & Miyake, Reference Slevc and Miyake2006). However, unlike the findings of previous studies that show positive effects of musical ability on perception and production, our findings point to a potentially negative, biasing effect of musical training on native speaking listeners’ judgments of L2 speech.
It is important to bear in mind that, in the present study, musical training appeared to be associated statistically significantly only with raters’ judgments of L2 accentedness, although a similar association (albeit a weak one) was also found for judgments of L2 comprehensibility and fluency. This raises an interesting question of how essential accentedness ratings are to speaking assessment of L2 speakers. Previous research has shown that accentedness, as it was defined in this study, tends to be associated with lower ratings than either comprehensibility or fluency (e.g., Derwing & Munro, Reference Derwing and Munro1997; Munro & Derwing, Reference Munro and Derwing1999). One of the most robust findings from this body of research is that a strong nonnative accent does not necessarily impede intelligibility (extent to which listeners understand L2 speech), although unintelligible speech is almost always judged to be heavily accented (Derwing & Munro, Reference Derwing and Munro2005). If the goal of language teachers, assessment specialists, and L2 learners themselves is for learners to be fully intelligible in their L2, as opposed to sounding like a native speaker (Levis, Reference Levis and Hughes2005), then perceptual ratings of speech, especially accentedness ratings, should not be done in isolation but should always be tied to an assessment of how well L2 speakers are understood (for a similar argument, see Jenkins, Reference Jenkins2000). In other words, when accentedness judgments are carried out in the absence of assessment of L2 speakers’ intelligibility, they can be misleading and biasing and ultimately not particularly useful.
Although ratings of L2 accentedness done in isolation might not be particularly revealing of overall L2 speaking ability, it is nevertheless important to understand precisely why musically trained raters appear to assign lower scores than musically untrained raters. Accentedness ratings have been shown to correlate with prosodic aspects of L2 speech (e.g., intonation, pitch accent) for speakers of several languages (Anderson-Hsieh & Koehler, Reference Anderson-Hsieh and Koehler1988; Mareüil & Vieru-Dimulescu, Reference Mareüil and Vieru-Dimulescu2006). Given a growing body of evidence for music–language transfer effects at the prosodic level (e.g., Patel, Peretz, Tramo, & Labreque, Reference Patel, Peretz, Tramo and Labreque1998), it is likely that musicians’ enhanced sensitivity to certain aspects of L2 speech, particularly at the level of prosody, is linked to their lower accentedness ratings. Future research could attempt to isolate those accent-related aspects of L2 speech that lend themselves to differences between musically trained and less musically experienced raters.
In future research, it would also seem appropriate to investigate the precise contribution of musical training and experience to the reliability and validity of L2 speaking assessment. In this study, the musically trained raters tended to judge L2 speech more negatively than the raters with little or no musical training (although the accentedness variable was the only one that reached statistical significance). At the same time, however, accentedness appeared to be a more independent (distinct) dimension relative to comprehensibility and fluency for music majors and raters with higher musical ability than for nonmusic majors and raters with lower musical ability. Thus, although musical training might lead to L2 speech ratings that could be more biased toward the negative end of the rating scale, these ratings might more precisely target each of the constructs being measured. This raises an intriguing possibility that needs to be investigated in future research, namely, that musical training (i.e., experience through which listeners get implicitly sensitized to certain aspects of L2 speech) and rater training (i.e., explicit instructions and practice about certain aspects of L2 speech given to raters prior to assessment) have a similar impact on the rater. Both types of experiences might sensitize raters to those aspects of L2 speech that are relevant to each construct being measured, ultimately leading to more accurate assessment of L2 speech.
Implications
Although interesting from a research perspective, our findings may not at this time have immediate implications for real-world high-stakes assessments, where standards for reliability need to be high and sources of rater variability should be minimized to the extent possible in the interests of test fairness. In high-stakes assessments, raters are also calibrated in a norming process, with the overall goal of minimizing individual raters’ scoring idiosyncrasies in order to achieve greater homogeneity of scoring. It is clear that the current study was not conceived with such a high-stakes assessment context in mind. Therefore, it remains unclear whether and to what extent raters’ musical experience (or musical ability) would reduce the interrater reliability or pose a threat to the validity of raters’ subjective judgments of L2 speech in a high-stakes assessment setting. It may be that raters with more musical experience assign a greater weighting to a particular aspect of speech (e.g., segmental errors that contribute to the impression of an L2 accent) than raters with less musical experience, whether or not those aspects of speech are specified in the rating scale descriptors (e.g., Eckes, Reference Eckes2008; Elder, Barkhuizen, Knoch, & von Randow, Reference Elder, Barkhuizen, Knoch and von Randow2007). It may also be that musical experience contributes to systematic differences in rater leniency or severity, a source of variability that researchers have sought to address with rater training (e.g., Elder, Knoch, Barkhuizen, & von Randow, Reference Elder, Knoch, Barkhuizen and von Randow2005; Lumley & McNamara, Reference Lumley and McNamara1995).
Even if it is established in future research focusing on operational L2 speaking tests that rater behavior differs as a function of musical experience, the implication is not necessarily that judgments of a musically homogenous group of raters should be sought. Perhaps a rater training component could be introduced to help mitigate the musical experience effect. The scope of such an intervention could be partially determined by considering what aspects of speech musically experienced raters are overly sensitive to and whether those aspects are relevant to the construct being measured. This and other factors, such as the feasibility of the training and its real-world applicability, could be used to decide which raters should serve as the norming group. It would be interesting to examine the extent to which a rater training procedure would be effective in getting raters to attend to the target aspect of speech, and whether this procedure would alter their ratings in the desired direction. Such considerations, which lie beyond the scope of the present study, are fertile ground for future research.
CONCLUSION
We examined the role of cognitive variables in rater judgments of L2 speech, with an overall goal of understanding how cognitive variables could affect the validity of language assessments and could ultimately influence high-stakes decision making. However, this study is only a first attempt to address this research goal. It is still unclear how cognitive variables affect different types of speaking assessments, such as paired tasks or tasks specific to a profession or occupation, where the construct of speaking ability is perhaps more broadly defined (e.g., incorporating grammar or vocabulary). Likewise unknown are the effects of many other individual differences, for example, field dependence or analytical ability, on the assessment of speaking. Musical ability, the factor that appeared to influence scalar judgments of L2 speech in this study, also needs to be explored in greater detail in order to understand precisely the nature of the impact of musical expertise and experience on rater behavior. These and other issues remain to be explored in future research.
ACKNOWLEDGMENTS
This research was supported by a Social Sciences and Humanities Research Council of Canada (SSHRC) doctoral fellowship to the first author and by both SSHRC and Fonds québécois de la recherche sur la société et la culture grants to the second author. The authors thank Randall Halter for his invaluable statistical advice; Tracey Derwing, Murray Munro, Irena O'Brien, and Norman Segalowitz for sharing some of their testing materials; Sarita Kennedy for her assistance with participant recruitment; Hyojin Song for her help with participant selection and testing; and two anonymous reviewers for their insightful comments on earlier versions of this paper.